


Joachim Fuchs
@joachimfuchs.bsky.social
Postdoc Hiesinger-Lab (FU Berlin) working with #Drosophila brain development (https://lab.flygen.org) previously PhD Eickholt Lab (Charité Berlin) | Filopodia & AxonBranching & Synapse formation | FijiSc | R | DataViz | UltimateFrisbee | he/him
Reposted by Joachim Fuchs
This #microscopymonday is a cleaning day. Watch how a #microglia cell mops up and phagozytoses debris and junk in a very messy neuronal co-culture. BTW, it was a proper cleaning job → the neurons made it and formed nice networks
Phase contrast imaging started at DIV1. One frame per 20 min.
Phase contrast imaging started at DIV1. One frame per 20 min.
October 12, 2025 at 4:32 PM
This #microscopymonday is a cleaning day. Watch how a #microglia cell mops up and phagozytoses debris and junk in a very messy neuronal co-culture. BTW, it was a proper cleaning job → the neurons made it and formed nice networks
Phase contrast imaging started at DIV1. One frame per 20 min.
Phase contrast imaging started at DIV1. One frame per 20 min.
Reposted by Joachim Fuchs

Job alert!
We are looking for a bioimage analysis to work in an image analysis core facility in beautiful Paris. Can I ask you to share this opportunity with your networks?
See also on the forum:
forum.image.sc/t/research-e...
We are looking for a bioimage analysis to work in an image analysis core facility in beautiful Paris. Can I ask you to share this opportunity with your networks?
See also on the forum:
forum.image.sc/t/research-e...

Research engineer in Bioimage Analysis for the researchers of the inIdEx FORMULA
Hi all We are looking for a bioimage analysis to work in an image analysis core facility in beautiful Paris. Can I ask you to share this opportunity with your networks? The position is in the Instit...
forum.image.sc
October 7, 2025 at 12:39 PM
Job alert!
We are looking for a bioimage analysis to work in an image analysis core facility in beautiful Paris. Can I ask you to share this opportunity with your networks?
See also on the forum:
forum.image.sc/t/research-e...
We are looking for a bioimage analysis to work in an image analysis core facility in beautiful Paris. Can I ask you to share this opportunity with your networks?
See also on the forum:
forum.image.sc/t/research-e...
Reposted by Joachim Fuchs

BioImage analysis friends - King's are recruiting for a full-time, permanent facility position! Come and work with fun microscopes and fun people (and me!) - please share! www.kcl.ac.uk/jobs/126345-...

Bioimage Analysis Specialist | King's College London
www.kcl.ac.uk
September 29, 2025 at 9:48 AM
BioImage analysis friends - King's are recruiting for a full-time, permanent facility position! Come and work with fun microscopes and fun people (and me!) - please share! www.kcl.ac.uk/jobs/126345-...
Reposted by Joachim Fuchs

Reconstructing long-range axons from dense brain images is tough.
This study introduces a novel method that separates axon identification from global statistical rules, showing big improvements over existing tools for mapping neuronal projections.
buff.ly/OBKr9cM
This study introduces a novel method that separates axon identification from global statistical rules, showing big improvements over existing tools for mapping neuronal projections.
buff.ly/OBKr9cM
September 7, 2025 at 10:01 AM
Reconstructing long-range axons from dense brain images is tough.
This study introduces a novel method that separates axon identification from global statistical rules, showing big improvements over existing tools for mapping neuronal projections.
buff.ly/OBKr9cM
This study introduces a novel method that separates axon identification from global statistical rules, showing big improvements over existing tools for mapping neuronal projections.
buff.ly/OBKr9cM
Reposted by Joachim Fuchs
🔬🧠 Our paper on smart microscopy & the issue of interoperability! www.biorxiv.org/content/10.1... LONG THREAD WARNING: Smart microscopy uses real-time image analysis to automatically guide the acquisition or perturbation of the sample (closed feedback-control loop). Many applications exist:

August 21, 2025 at 2:22 PM
🔬🧠 Our paper on smart microscopy & the issue of interoperability! www.biorxiv.org/content/10.1... LONG THREAD WARNING: Smart microscopy uses real-time image analysis to automatically guide the acquisition or perturbation of the sample (closed feedback-control loop). Many applications exist:
Reposted by Joachim Fuchs
Automated optogenetic control of hundreds of cells in parallel. Each cell is individually steered, collectively acting as a "tissue printer". Preprint & code out! www.biorxiv.org/content/10.1...
August 21, 2025 at 8:16 PM
Automated optogenetic control of hundreds of cells in parallel. Each cell is individually steered, collectively acting as a "tissue printer". Preprint & code out! www.biorxiv.org/content/10.1...
Reposted by Joachim Fuchs

Our bryozoan paper is out in @genomeresearch.bsky.social! Led by @tomlewin.bsky.social, we report genome shuffling across the phylum and synteny evidence for the Lophophorata hypothesis. Grateful to John Bishop @thembauk.bsky.social and the DToL project for sharing openly!
doi.org/10.1101/gr.2...
doi.org/10.1101/gr.2...

January 7, 2025 at 6:20 AM
Our bryozoan paper is out in @genomeresearch.bsky.social! Led by @tomlewin.bsky.social, we report genome shuffling across the phylum and synteny evidence for the Lophophorata hypothesis. Grateful to John Bishop @thembauk.bsky.social and the DToL project for sharing openly!
doi.org/10.1101/gr.2...
doi.org/10.1101/gr.2...
Reposted by Joachim Fuchs
FlyBase needs your help! We ask that European labs continue to contribute to Cambridge, UK FlyBase, whereas US and other non-European labs can contribute to US FlyBase. For more information and how to donate: wiki.flybase.org/wiki/FlyBase...
FlyBase:Contribute to FlyBase - FlyBase Wiki
wiki.flybase.org
August 15, 2025 at 12:45 PM
FlyBase needs your help! We ask that European labs continue to contribute to Cambridge, UK FlyBase, whereas US and other non-European labs can contribute to US FlyBase. For more information and how to donate: wiki.flybase.org/wiki/FlyBase...
Reposted by Joachim Fuchs

A reminder you/your lab can support FlyBase at Cambridge through the following link. Every bit helps. Please share if you yourself can't donate.
www.philanthropy.cam.ac.uk/give-to-camb...
www.philanthropy.cam.ac.uk/give-to-camb...
August 14, 2025 at 5:25 AM
A reminder you/your lab can support FlyBase at Cambridge through the following link. Every bit helps. Please share if you yourself can't donate.
www.philanthropy.cam.ac.uk/give-to-camb...
www.philanthropy.cam.ac.uk/give-to-camb...
Reposted by Joachim Fuchs
Reminder that all three books I've co-authored are freely available online for non-commercial use (and the fourth will be, too)
All three books I've co-authored are freely available online for non-commercial use:
- #Bayesian Data Analysis, 3rd ed (aka BDA3) at stat.columbia.edu/~gelman/book/
- #Regression and Other Stories at avehtari.github.io/ROS-Examples/
- Active Statistics at avehtari.github.io/ActiveStatis...
- #Bayesian Data Analysis, 3rd ed (aka BDA3) at stat.columbia.edu/~gelman/book/
- #Regression and Other Stories at avehtari.github.io/ROS-Examples/
- Active Statistics at avehtari.github.io/ActiveStatis...

August 11, 2025 at 5:44 PM
Reminder that all three books I've co-authored are freely available online for non-commercial use (and the fourth will be, too)
Reposted by Joachim Fuchs
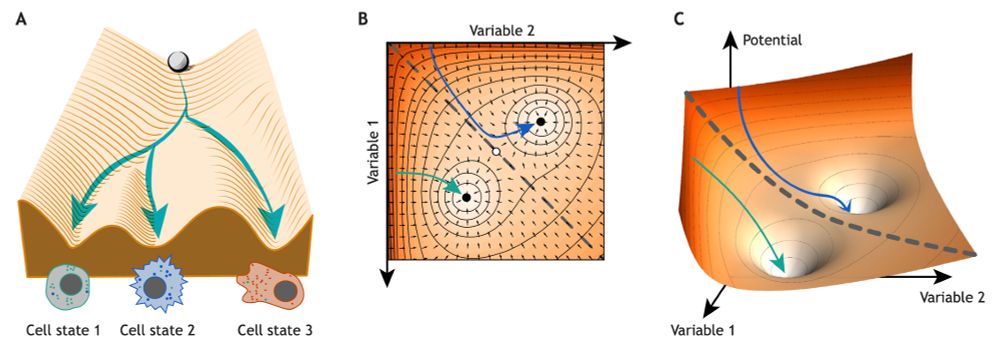
Introducing five concepts from dynamical systems to decode developmental regulatory mechanisms, have a read! @perez-carrasco.bsky.social @roederlab.bsky.social @mpipz.bsky.social This effort started in a morphogenesis meeting @kitp-ucsb.bsky.social in 2023. journals.biologists.com/dev/article/...
August 4, 2025 at 6:42 AM
Introducing five concepts from dynamical systems to decode developmental regulatory mechanisms, have a read! @perez-carrasco.bsky.social @roederlab.bsky.social @mpipz.bsky.social This effort started in a morphogenesis meeting @kitp-ucsb.bsky.social in 2023. journals.biologists.com/dev/article/...
Reposted by Joachim Fuchs

I read and re-read the paper and talked to some on the experienced editorial staff.
My conclusion was that there were not sufficient reasons to retract the paper. The evidence was much weaker than was needed to fully support the claims. but this was true to some degree for many papers.
9/n
My conclusion was that there were not sufficient reasons to retract the paper. The evidence was much weaker than was needed to fully support the claims. but this was true to some degree for many papers.
9/n
July 27, 2025 at 11:48 AM
I read and re-read the paper and talked to some on the experienced editorial staff.
My conclusion was that there were not sufficient reasons to retract the paper. The evidence was much weaker than was needed to fully support the claims. but this was true to some degree for many papers.
9/n
My conclusion was that there were not sufficient reasons to retract the paper. The evidence was much weaker than was needed to fully support the claims. but this was true to some degree for many papers.
9/n
Reposted by Joachim Fuchs

At this point, I might as well --
Here's an infographic showing different ways to include age as a predictor. The top shows two extremes, just as a plain old numerical predictor (imposes linear trajectory) vs. categorical predictor (imposes nothing whatsoever). And then three solutions in between!
Here's an infographic showing different ways to include age as a predictor. The top shows two extremes, just as a plain old numerical predictor (imposes linear trajectory) vs. categorical predictor (imposes nothing whatsoever). And then three solutions in between!

July 16, 2025 at 12:33 PM
At this point, I might as well --
Here's an infographic showing different ways to include age as a predictor. The top shows two extremes, just as a plain old numerical predictor (imposes linear trajectory) vs. categorical predictor (imposes nothing whatsoever). And then three solutions in between!
Here's an infographic showing different ways to include age as a predictor. The top shows two extremes, just as a plain old numerical predictor (imposes linear trajectory) vs. categorical predictor (imposes nothing whatsoever). And then three solutions in between!
Reposted by Joachim Fuchs
The "reproducibility crisis" in science constantly makes headlines. Repro efforts are often limited. What if you could assess reproducibility of an entire field?
That's what @brunolemaitre.bsky.social et al. have done. Fly immunity is highly replicable & offers lessons for #metascience
A 🧵 1/n
That's what @brunolemaitre.bsky.social et al. have done. Fly immunity is highly replicable & offers lessons for #metascience
A 🧵 1/n
July 10, 2025 at 8:23 AM
The "reproducibility crisis" in science constantly makes headlines. Repro efforts are often limited. What if you could assess reproducibility of an entire field?
That's what @brunolemaitre.bsky.social et al. have done. Fly immunity is highly replicable & offers lessons for #metascience
A 🧵 1/n
That's what @brunolemaitre.bsky.social et al. have done. Fly immunity is highly replicable & offers lessons for #metascience
A 🧵 1/n
Reposted by Joachim Fuchs

How can we reform science? I have some ideas. But I am not sure you’ll like them, because they don’t promise much. elevanth.org/blog/2025/07...

Which Kind of Science Reform
What hope is there for science reform, if we can't agree on what to reform? Right now, principles are more important than practices.
elevanth.org
July 9, 2025 at 1:40 PM
How can we reform science? I have some ideas. But I am not sure you’ll like them, because they don’t promise much. elevanth.org/blog/2025/07...
Reposted by Joachim Fuchs

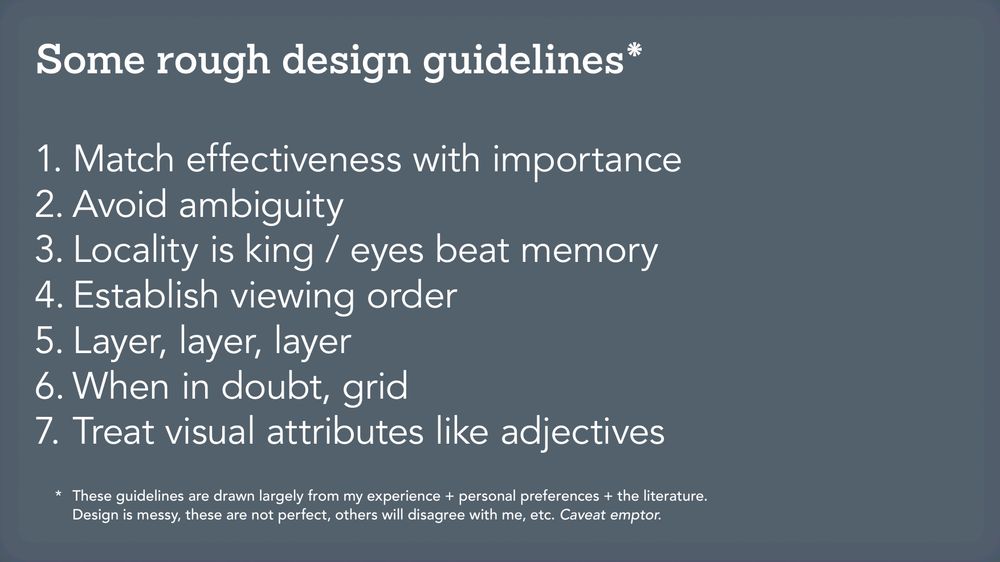
These are the design guidelines I teach. From halfway through this deck: www.mjskay.com/presentation...
These days (for academic vis) I'd add "ensure natural visual operations correspond to meaningful operations in data space". Need to make slides for that.
These days (for academic vis) I'd add "ensure natural visual operations correspond to meaningful operations in data space". Need to make slides for that.
July 3, 2025 at 6:22 PM
These are the design guidelines I teach. From halfway through this deck: www.mjskay.com/presentation...
These days (for academic vis) I'd add "ensure natural visual operations correspond to meaningful operations in data space". Need to make slides for that.
These days (for academic vis) I'd add "ensure natural visual operations correspond to meaningful operations in data space". Need to make slides for that.
Reposted by Joachim Fuchs
I gave in! After students asking for it, I now made a simple figure design checklist.
To help all scientists w/o graphic skills create clear, accessible, and truthful charts!
-> Out in @nature Cell Biology: rdcu.be/erwl4
#DataVisualization #PhD #SciComm
Thx for review @bethcimini.bsky.social + 2
To help all scientists w/o graphic skills create clear, accessible, and truthful charts!
-> Out in @nature Cell Biology: rdcu.be/erwl4
#DataVisualization #PhD #SciComm
Thx for review @bethcimini.bsky.social + 2
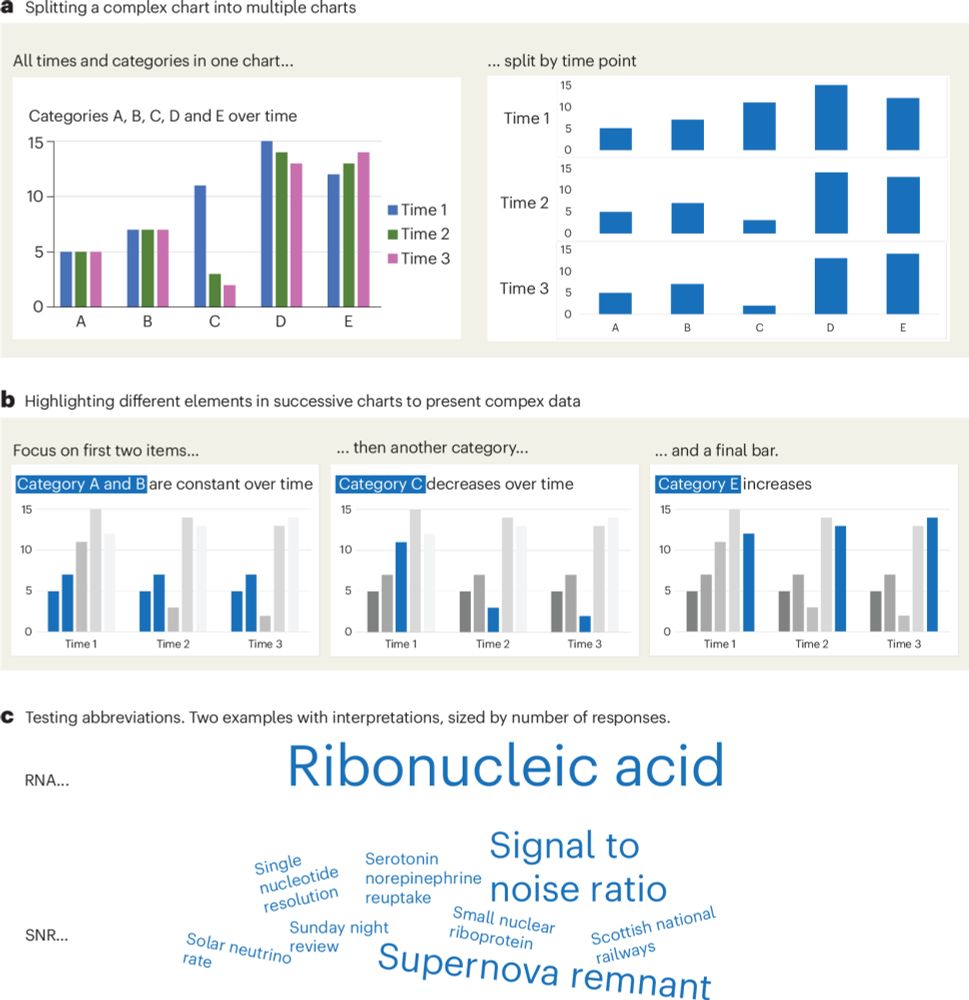
A checklist for designing and improving the visualization of scientific data
Nature Cell Biology - Creating clear and engaging scientific figures is crucial to communicate complex data. In this Comment, I condense principles from design, visual perception and data...
rdcu.be
June 18, 2025 at 8:33 AM
I gave in! After students asking for it, I now made a simple figure design checklist.
To help all scientists w/o graphic skills create clear, accessible, and truthful charts!
-> Out in @nature Cell Biology: rdcu.be/erwl4
#DataVisualization #PhD #SciComm
Thx for review @bethcimini.bsky.social + 2
To help all scientists w/o graphic skills create clear, accessible, and truthful charts!
-> Out in @nature Cell Biology: rdcu.be/erwl4
#DataVisualization #PhD #SciComm
Thx for review @bethcimini.bsky.social + 2
Reposted by Joachim Fuchs

The hunt for a soulmate can be hard work. Neurons in the developing Drosophila antennal lobe simplify the problem by turning a 3D search into a 1D one.
By @callimcflurry.bsky.social
#neuroskyence
www.thetransmitter.org/developmenta...
By @callimcflurry.bsky.social
#neuroskyence
www.thetransmitter.org/developmenta...
How developing neurons simplify their search for a synaptic mate
Streamlining the problem from 3D to 1D eases the expedition—a strategy the study investigators deployed to rewire an olfactory circuit in flies.
www.thetransmitter.org
June 6, 2025 at 1:35 PM
The hunt for a soulmate can be hard work. Neurons in the developing Drosophila antennal lobe simplify the problem by turning a 3D search into a 1D one.
By @callimcflurry.bsky.social
#neuroskyence
www.thetransmitter.org/developmenta...
By @callimcflurry.bsky.social
#neuroskyence
www.thetransmitter.org/developmenta...
Reposted by Joachim Fuchs

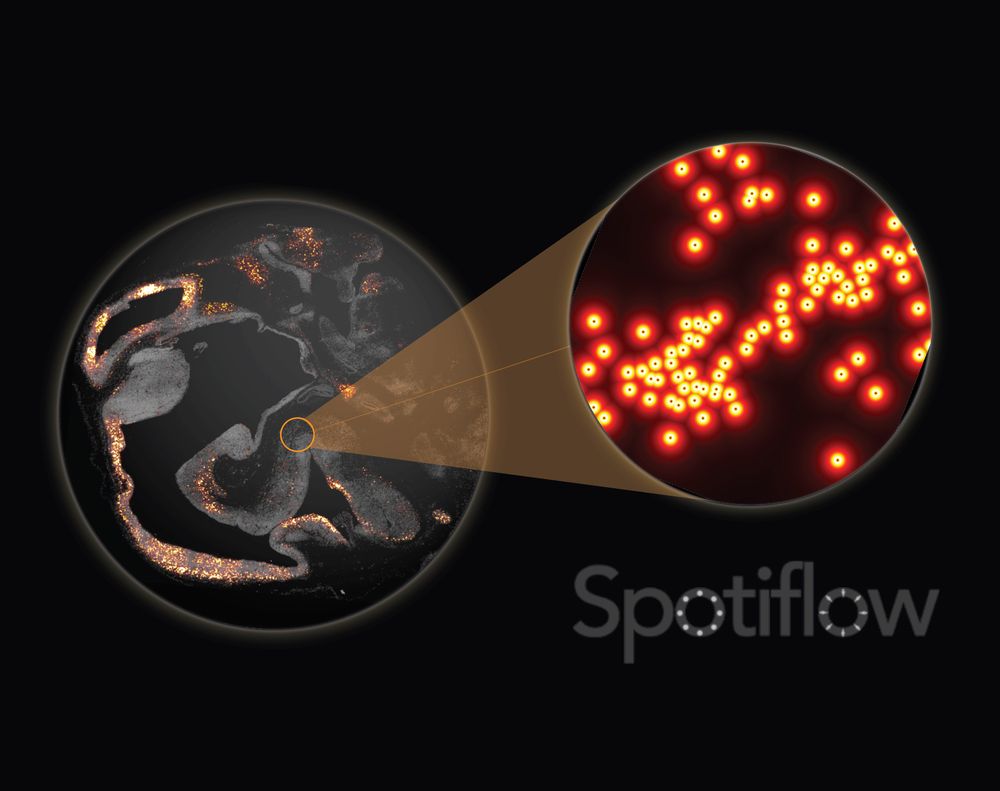
Out today in @natmethods.nature.com : Spotiflow, our transcript localization method for imaging-based spatial transcriptomics. Led by amazing PhD student @albertdm.bsky.social, joint work w @gioelelamanno.bsky.social at EPFL / @scadsai.bsky.social
www.nature.com/articles/s41...
rdcu.be/epIB7
www.nature.com/articles/s41...
rdcu.be/epIB7
June 6, 2025 at 7:06 PM
Out today in @natmethods.nature.com : Spotiflow, our transcript localization method for imaging-based spatial transcriptomics. Led by amazing PhD student @albertdm.bsky.social, joint work w @gioelelamanno.bsky.social at EPFL / @scadsai.bsky.social
www.nature.com/articles/s41...
rdcu.be/epIB7
www.nature.com/articles/s41...
rdcu.be/epIB7
Reposted by Joachim Fuchs
#drosophila @flybase.bsky.social request emergency funding:
"As it stands, by the end of July, 2025, there will be no future updates to FlyBase, and in the worst case scenario access to the website will also be lost" => please donate!
www.philanthropy.cam.ac.uk/give-to-camb...
"As it stands, by the end of July, 2025, there will be no future updates to FlyBase, and in the worst case scenario access to the website will also be lost" => please donate!
www.philanthropy.cam.ac.uk/give-to-camb...
Drosophila Genetic Database
The Drosophila Genetic Database, FlyBase, is on the brink of collapse due to the sudden termination of the FlyBase NIH grant, which includes salaries for 5 literature curators based at the University ...
www.philanthropy.cam.ac.uk
June 3, 2025 at 4:15 PM
#drosophila @flybase.bsky.social request emergency funding:
"As it stands, by the end of July, 2025, there will be no future updates to FlyBase, and in the worst case scenario access to the website will also be lost" => please donate!
www.philanthropy.cam.ac.uk/give-to-camb...
"As it stands, by the end of July, 2025, there will be no future updates to FlyBase, and in the worst case scenario access to the website will also be lost" => please donate!
www.philanthropy.cam.ac.uk/give-to-camb...
Reposted by Joachim Fuchs

ok stats experts!
if we have measures in a timecourse, how would you capture whether different groups show a different pattern?
i guess the simple/obvious thing is t test on a given timepoint but this throws away all the info from multiple timepoints...
any link/tutorial you like? (pls rski)
if we have measures in a timecourse, how would you capture whether different groups show a different pattern?
i guess the simple/obvious thing is t test on a given timepoint but this throws away all the info from multiple timepoints...
any link/tutorial you like? (pls rski)
June 2, 2025 at 4:49 PM
ok stats experts!
if we have measures in a timecourse, how would you capture whether different groups show a different pattern?
i guess the simple/obvious thing is t test on a given timepoint but this throws away all the info from multiple timepoints...
any link/tutorial you like? (pls rski)
if we have measures in a timecourse, how would you capture whether different groups show a different pattern?
i guess the simple/obvious thing is t test on a given timepoint but this throws away all the info from multiple timepoints...
any link/tutorial you like? (pls rski)
Reposted by Joachim Fuchs

@maheandria.bsky.social and I challenge the notion of a static and deterministic definition of a (neural) cell type and argue for its replacement by a multi parametric probabilistic definition in this perspective
sciencedirect.com/science/arti...
sciencedirect.com/science/arti...

Toward a probabilistic definition of neural cell types
A classical view of cell type relies on a definite set of stable properties that are critical for brain functions. Single-cell technologies led to an …
sciencedirect.com
May 6, 2025 at 12:49 PM
@maheandria.bsky.social and I challenge the notion of a static and deterministic definition of a (neural) cell type and argue for its replacement by a multi parametric probabilistic definition in this perspective
sciencedirect.com/science/arti...
sciencedirect.com/science/arti...
Reposted by Joachim Fuchs

Introducing warpfield, an open source Python library for GPU-accelerated non-rigid 3D registration. Warps and aligns gigavoxel volumes within seconds (not hours). For 3D microscopy, region-to-region and cell-to-cell matching.
A collaboration with @mh123.bsky.social 🚀
github.com/danionella/w...
A collaboration with @mh123.bsky.social 🚀
github.com/danionella/w...
May 12, 2025 at 5:25 AM
Introducing warpfield, an open source Python library for GPU-accelerated non-rigid 3D registration. Warps and aligns gigavoxel volumes within seconds (not hours). For 3D microscopy, region-to-region and cell-to-cell matching.
A collaboration with @mh123.bsky.social 🚀
github.com/danionella/w...
A collaboration with @mh123.bsky.social 🚀
github.com/danionella/w...
Reposted by Joachim Fuchs
Hot off the press:
The excellent Maheva Andriatsilavo and colleagues show how a temporal sequence of stochastic molecular mechanisms allow the emergence of stereotyped individualised neuronal circuits. Just published in Nature Neuroscience:
rdcu.be/ek010
The excellent Maheva Andriatsilavo and colleagues show how a temporal sequence of stochastic molecular mechanisms allow the emergence of stereotyped individualised neuronal circuits. Just published in Nature Neuroscience:
rdcu.be/ek010
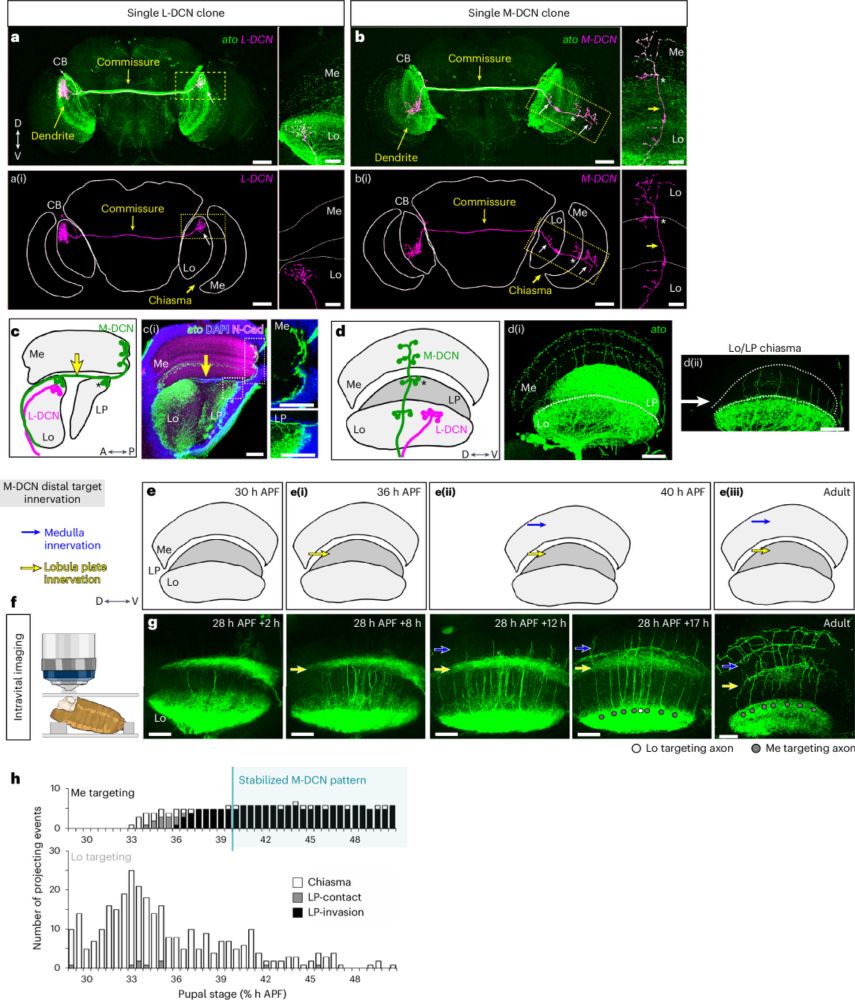
Sequential and independent probabilistic events regulate differential axon targeting during development in Drosophila melanogaster
Nature Neuroscience - The developmental origin of behavioral individuality is unclear. The authors show that a temporal sequence of genetically encoded stochastic mechanisms explains variation in...
rdcu.be
May 7, 2025 at 11:26 AM
Hot off the press:
The excellent Maheva Andriatsilavo and colleagues show how a temporal sequence of stochastic molecular mechanisms allow the emergence of stereotyped individualised neuronal circuits. Just published in Nature Neuroscience:
rdcu.be/ek010
The excellent Maheva Andriatsilavo and colleagues show how a temporal sequence of stochastic molecular mechanisms allow the emergence of stereotyped individualised neuronal circuits. Just published in Nature Neuroscience:
rdcu.be/ek010
Reposted by Joachim Fuchs

An idea for a workshop that you can run (or take yourself!) to teach "R for cell biologists". 🧪
quantixed.org/2025/01/20/g...
quantixed.org/2025/01/20/g...
Get Better: R for cell biologists – quantixed
quantixed.org
January 20, 2025 at 2:49 PM
An idea for a workshop that you can run (or take yourself!) to teach "R for cell biologists". 🧪
quantixed.org/2025/01/20/g...
quantixed.org/2025/01/20/g...