


Jess Graves
@jessgraves.bsky.social
🧮 Statistics & data science
💊 Clinical trials & R&D & Epidemiology
💻 R enthusiast
👩💻 Stats @ loyal.com
https://jesslgraves.github.io
💊 Clinical trials & R&D & Epidemiology
💻 R enthusiast
👩💻 Stats @ loyal.com
https://jesslgraves.github.io
Pinned
Jess Graves
@jessgraves.bsky.social
· Jul 16
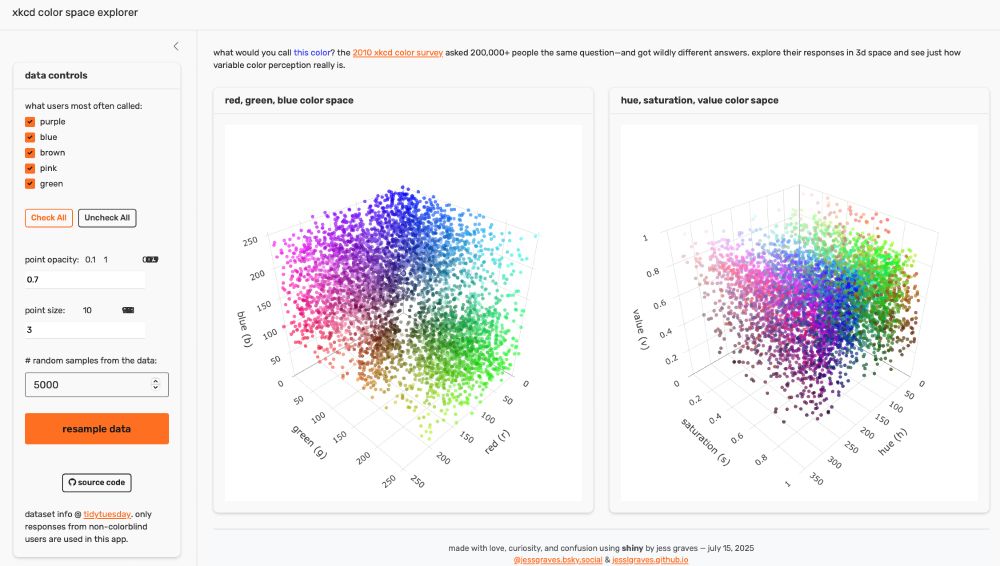
Better late than never — here’s my #TidyTuesday submission from last week's data!
I built a #shiny app with #plotly to explore the @xkcd.com color survey results in both 🌈 RGB and HSV space🌈.
🖥️ App: jessgraves.shinyapps.io/xkcd-color-s...
🌐 Personal site: jesslgraves.github.io/apps/2025-07...
I built a #shiny app with #plotly to explore the @xkcd.com color survey results in both 🌈 RGB and HSV space🌈.
🖥️ App: jessgraves.shinyapps.io/xkcd-color-s...
🌐 Personal site: jesslgraves.github.io/apps/2025-07...
Reposted by Jess Graves


September 18, 2025 at 9:33 PM
Reposted by Jess Graves

You're very welcome @vincentab.bsky.social
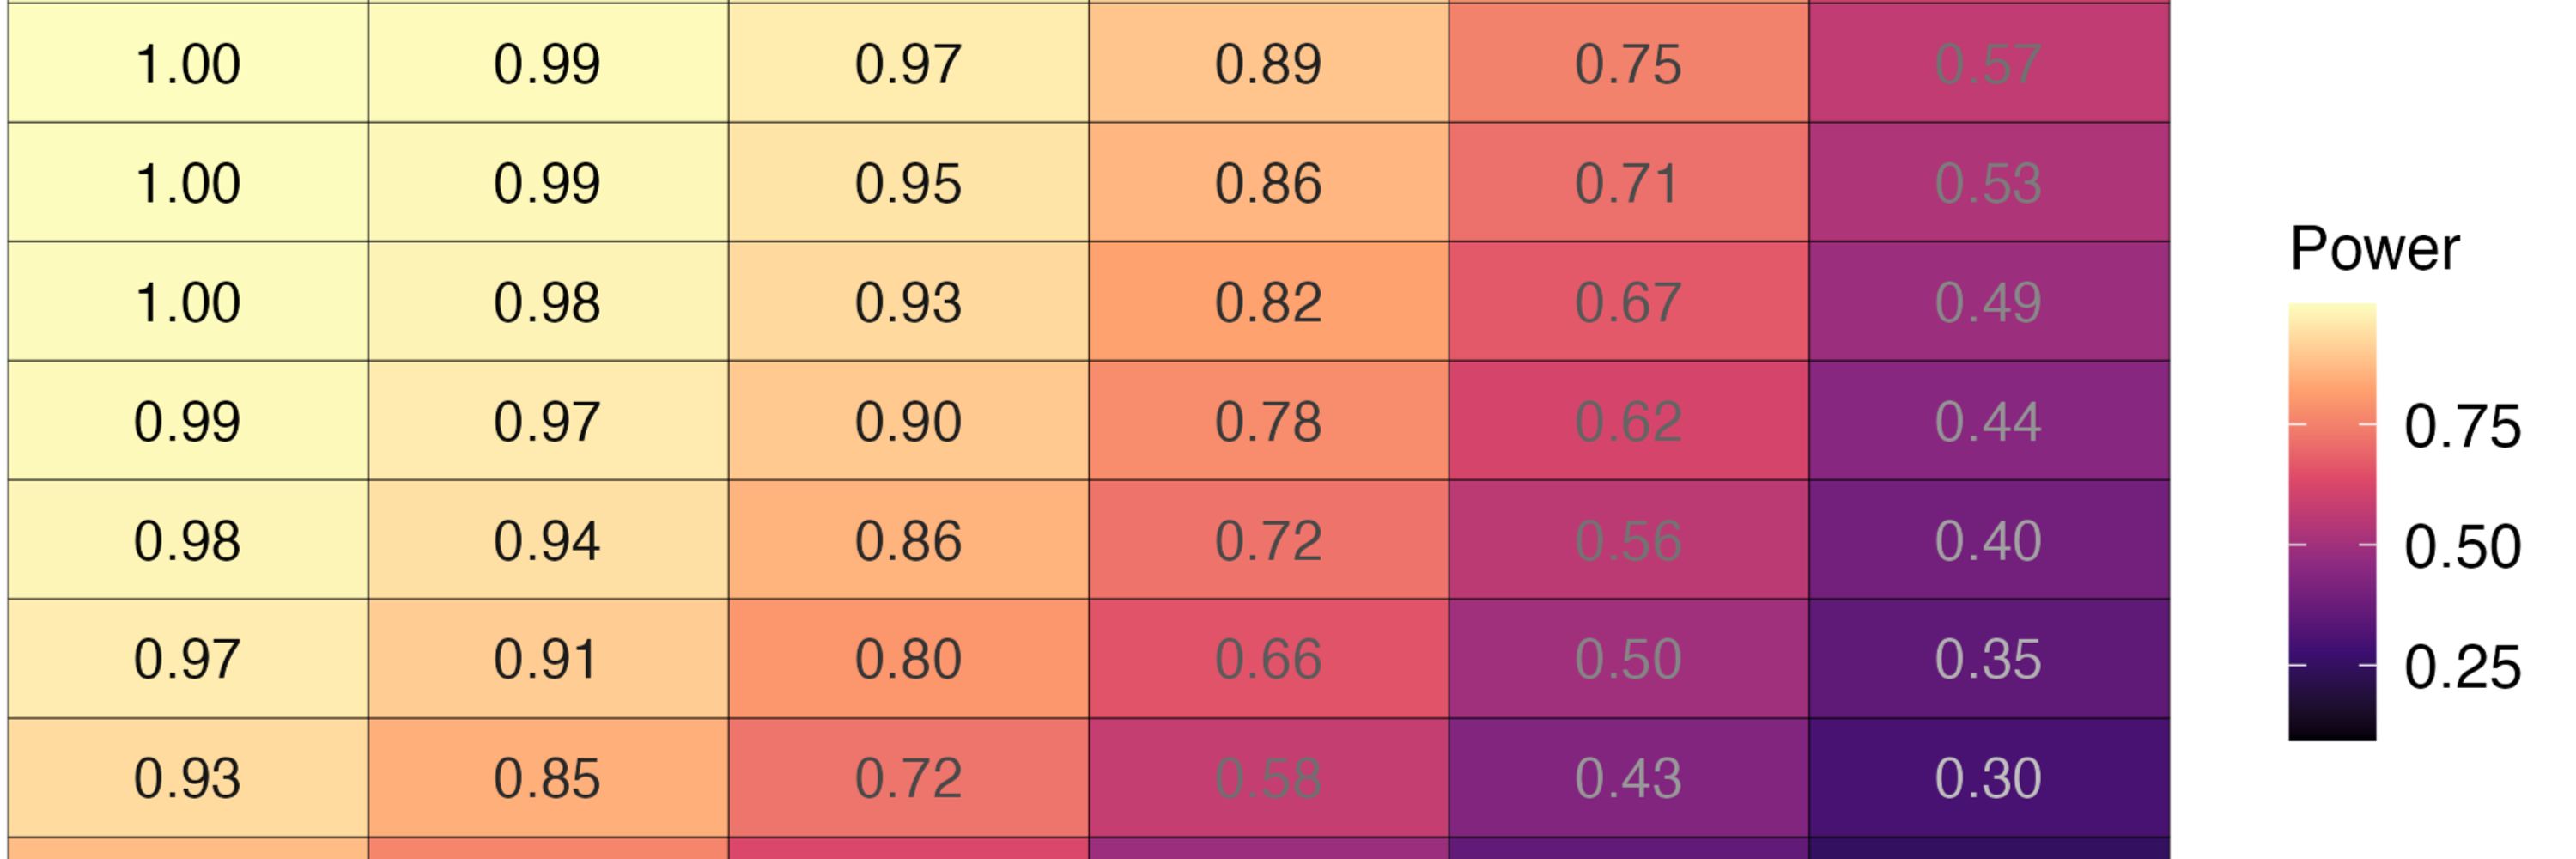
P.S. Check out our preprint on an alternative to staring at coefficients: j-rohrer.github.io/marginal-psy...
P.S. Check out our preprint on an alternative to staring at coefficients: j-rohrer.github.io/marginal-psy...

September 17, 2025 at 1:32 PM
You're very welcome @vincentab.bsky.social
P.S. Check out our preprint on an alternative to staring at coefficients: j-rohrer.github.io/marginal-psy...
P.S. Check out our preprint on an alternative to staring at coefficients: j-rohrer.github.io/marginal-psy...
Reposted by Jess Graves

Whoa—my book is up for pre-order!
𝐌𝐨𝐝𝐞𝐥 𝐭𝐨 𝐌𝐞𝐚𝐧𝐢𝐧𝐠: 𝐇𝐨𝐰 𝐭𝐨 𝐈𝐧𝐭𝐞𝐫𝐩𝐫𝐞𝐭 𝐒𝐭𝐚𝐭 & 𝐌𝐋 𝐌𝐨𝐝𝐞𝐥𝐬 𝐢𝐧 #Rstats 𝐚𝐧𝐝 #PyData
The book presents an ultra-simple and powerful workflow to make sense of ± any model you fit
The web version will stay free forever and my proceeds go to charity.
tinyurl.com/4fk56fc8
𝐌𝐨𝐝𝐞𝐥 𝐭𝐨 𝐌𝐞𝐚𝐧𝐢𝐧𝐠: 𝐇𝐨𝐰 𝐭𝐨 𝐈𝐧𝐭𝐞𝐫𝐩𝐫𝐞𝐭 𝐒𝐭𝐚𝐭 & 𝐌𝐋 𝐌𝐨𝐝𝐞𝐥𝐬 𝐢𝐧 #Rstats 𝐚𝐧𝐝 #PyData
The book presents an ultra-simple and powerful workflow to make sense of ± any model you fit
The web version will stay free forever and my proceeds go to charity.
tinyurl.com/4fk56fc8

September 17, 2025 at 7:49 PM
Whoa—my book is up for pre-order!
𝐌𝐨𝐝𝐞𝐥 𝐭𝐨 𝐌𝐞𝐚𝐧𝐢𝐧𝐠: 𝐇𝐨𝐰 𝐭𝐨 𝐈𝐧𝐭𝐞𝐫𝐩𝐫𝐞𝐭 𝐒𝐭𝐚𝐭 & 𝐌𝐋 𝐌𝐨𝐝𝐞𝐥𝐬 𝐢𝐧 #Rstats 𝐚𝐧𝐝 #PyData
The book presents an ultra-simple and powerful workflow to make sense of ± any model you fit
The web version will stay free forever and my proceeds go to charity.
tinyurl.com/4fk56fc8
𝐌𝐨𝐝𝐞𝐥 𝐭𝐨 𝐌𝐞𝐚𝐧𝐢𝐧𝐠: 𝐇𝐨𝐰 𝐭𝐨 𝐈𝐧𝐭𝐞𝐫𝐩𝐫𝐞𝐭 𝐒𝐭𝐚𝐭 & 𝐌𝐋 𝐌𝐨𝐝𝐞𝐥𝐬 𝐢𝐧 #Rstats 𝐚𝐧𝐝 #PyData
The book presents an ultra-simple and powerful workflow to make sense of ± any model you fit
The web version will stay free forever and my proceeds go to charity.
tinyurl.com/4fk56fc8
Reposted by Jess Graves

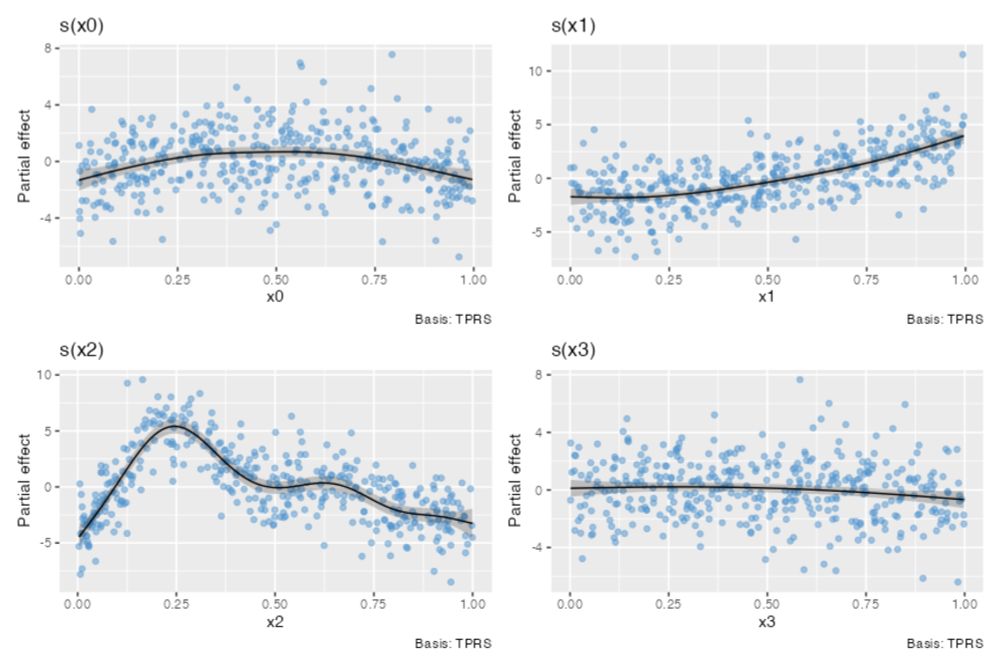
At the risk of stretching the imagination beyond the limits of human endurance, the reader is asked to pretend that the author is interested in splines #rstats

Splines, B-splines, P-splines, and a disapproving kitten – Notes from a data witch
No, I do not care about splines. But I am trying to learn about GAMLSS regression, and yes, it is to this dark place that this topic has taken me
blog.djnavarro.net
September 8, 2025 at 1:41 AM
At the risk of stretching the imagination beyond the limits of human endurance, the reader is asked to pretend that the author is interested in splines #rstats

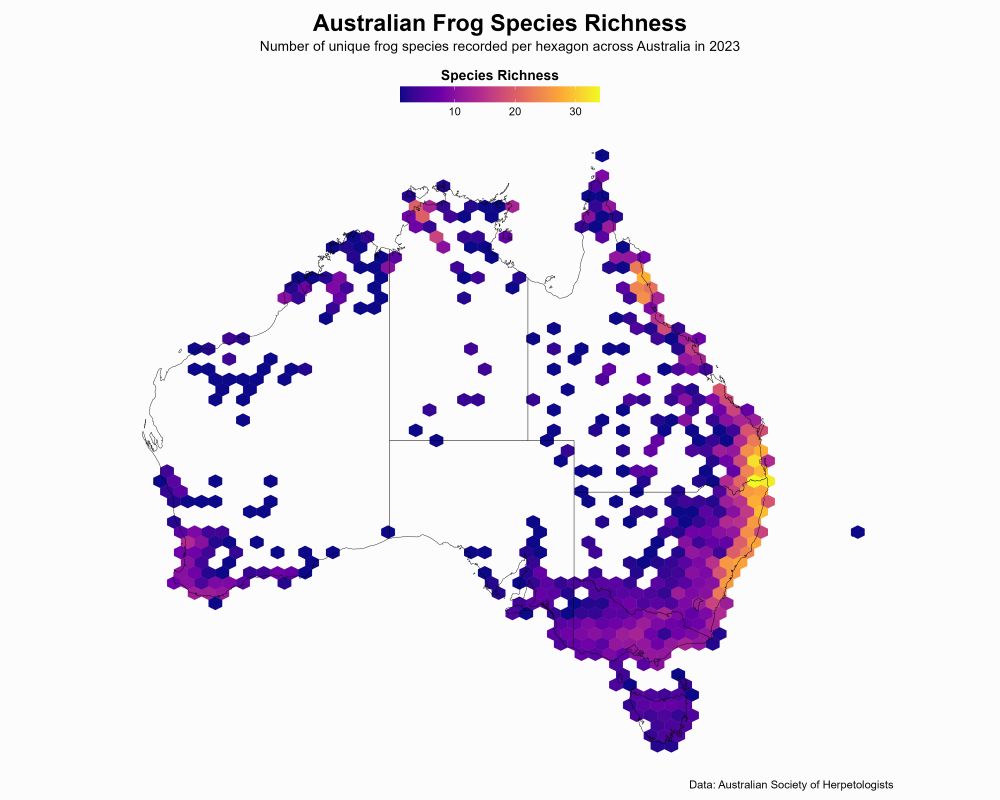
🐸🐸🐸

Skipped ahead to next week's (2025-09-02) #tidytuesday because I love frogs.
#r4ds
#datavisualization
#r4ds
#datavisualization
August 29, 2025 at 12:46 AM
🐸🐸🐸
Reposted by Jess Graves
Ever stared at a table of regression coefficients & wondered what you're doing with your life?
Very excited to share this gentle introduction to another way of making sense of statistical models (w @vincentab.bsky.social)
Preprint: doi.org/10.31234/osf...
Website: j-rohrer.github.io/marginal-psy...
Very excited to share this gentle introduction to another way of making sense of statistical models (w @vincentab.bsky.social)
Preprint: doi.org/10.31234/osf...
Website: j-rohrer.github.io/marginal-psy...


August 25, 2025 at 11:49 AM
Ever stared at a table of regression coefficients & wondered what you're doing with your life?
Very excited to share this gentle introduction to another way of making sense of statistical models (w @vincentab.bsky.social)
Preprint: doi.org/10.31234/osf...
Website: j-rohrer.github.io/marginal-psy...
Very excited to share this gentle introduction to another way of making sense of statistical models (w @vincentab.bsky.social)
Preprint: doi.org/10.31234/osf...
Website: j-rohrer.github.io/marginal-psy...
Lil’ Muncher (official name lol) update:
1) LM abandoned his post at 50% consumption but
2) Found a friend, LM2
3) And many more 😵💫
Consumption rates have become exponential and sadly all (visible) Munch Bunchers had to be evicted.
1) LM abandoned his post at 50% consumption but
2) Found a friend, LM2
3) And many more 😵💫
Consumption rates have become exponential and sadly all (visible) Munch Bunchers had to be evicted.


August 20, 2025 at 1:54 PM
Lil’ Muncher (official name lol) update:
1) LM abandoned his post at 50% consumption but
2) Found a friend, LM2
3) And many more 😵💫
Consumption rates have become exponential and sadly all (visible) Munch Bunchers had to be evicted.
1) LM abandoned his post at 50% consumption but
2) Found a friend, LM2
3) And many more 😵💫
Consumption rates have become exponential and sadly all (visible) Munch Bunchers had to be evicted.
Little muncher < 24 hrs later:
1) still on the same lead (! I was surprised by this!)
2) leaf consumption at 50%
1) still on the same lead (! I was surprised by this!)
2) leaf consumption at 50%

August 19, 2025 at 12:58 PM
Little muncher < 24 hrs later:
1) still on the same lead (! I was surprised by this!)
2) leaf consumption at 50%
1) still on the same lead (! I was surprised by this!)
2) leaf consumption at 50%
I’m supposed to hate this little cutie, because it will eat up my tomato plant but…. Come onnnnn look at it 🥹🥹🥹🥹

August 18, 2025 at 7:48 PM
I’m supposed to hate this little cutie, because it will eat up my tomato plant but…. Come onnnnn look at it 🥹🥹🥹🥹
Reposted by Jess Graves

🚀 gratia 0.11.0 is out!
Now has a paper in JOSS — please cite 📄 doi.org/10.21105/jos...
Experimental parallel processing ⚡
New assemble() for building plots 🎨
Better support for complex families + new diagnostics 🧪
Lots of bug fixes + polish ✨
👉 gavinsimpson.github.io/gratia/
#Rstats
Now has a paper in JOSS — please cite 📄 doi.org/10.21105/jos...
Experimental parallel processing ⚡
New assemble() for building plots 🎨
Better support for complex families + new diagnostics 🧪
Lots of bug fixes + polish ✨
👉 gavinsimpson.github.io/gratia/
#Rstats
An R package for working with generalized additive models
Graceful 'ggplot'-based graphics and utility functions for working with generalized additive models (GAMs) fitted using the 'mgcv' package.
gavinsimpson.github.io
August 18, 2025 at 6:32 PM
🚀 gratia 0.11.0 is out!
Now has a paper in JOSS — please cite 📄 doi.org/10.21105/jos...
Experimental parallel processing ⚡
New assemble() for building plots 🎨
Better support for complex families + new diagnostics 🧪
Lots of bug fixes + polish ✨
👉 gavinsimpson.github.io/gratia/
#Rstats
Now has a paper in JOSS — please cite 📄 doi.org/10.21105/jos...
Experimental parallel processing ⚡
New assemble() for building plots 🎨
Better support for complex families + new diagnostics 🧪
Lots of bug fixes + polish ✨
👉 gavinsimpson.github.io/gratia/
#Rstats
Yes!
All these questions and tests, just to obfuscate the unity of the general linear model of which most are special cases.

Want to run a statistical test but unsure where to start? This blog post from @BitesizeBio is a great place to start!
bitesizebio.com/1929...
#ResourceWednesday #statistics
bitesizebio.com/1929...
#ResourceWednesday #statistics
August 14, 2025 at 12:13 AM
Yes!
Reposted by Jess Graves

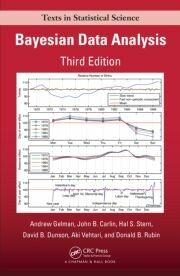
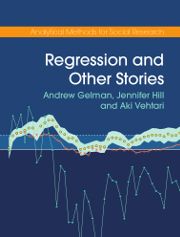
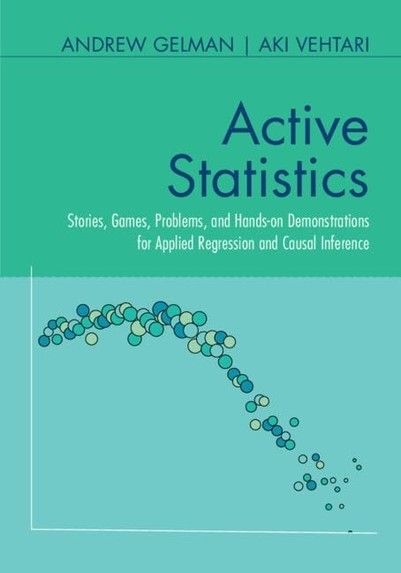
Reminder that all three books I've co-authored are freely available online for non-commercial use (and the fourth will be, too)
All three books I've co-authored are freely available online for non-commercial use:
- #Bayesian Data Analysis, 3rd ed (aka BDA3) at stat.columbia.edu/~gelman/book/
- #Regression and Other Stories at avehtari.github.io/ROS-Examples/
- Active Statistics at avehtari.github.io/ActiveStatis...
- #Bayesian Data Analysis, 3rd ed (aka BDA3) at stat.columbia.edu/~gelman/book/
- #Regression and Other Stories at avehtari.github.io/ROS-Examples/
- Active Statistics at avehtari.github.io/ActiveStatis...
August 11, 2025 at 5:44 PM
Reminder that all three books I've co-authored are freely available online for non-commercial use (and the fourth will be, too)
Reposted by Jess Graves

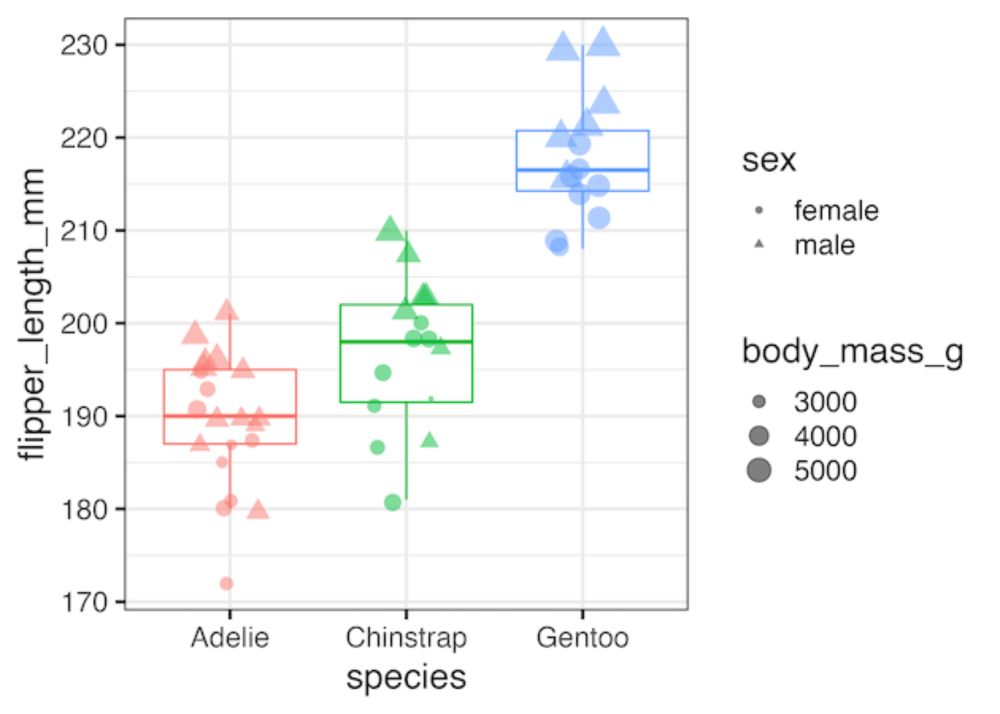
#rstats So chuffed! I printed the first PDF copy of my book to see what it might look like in print! It will be printed in full color!
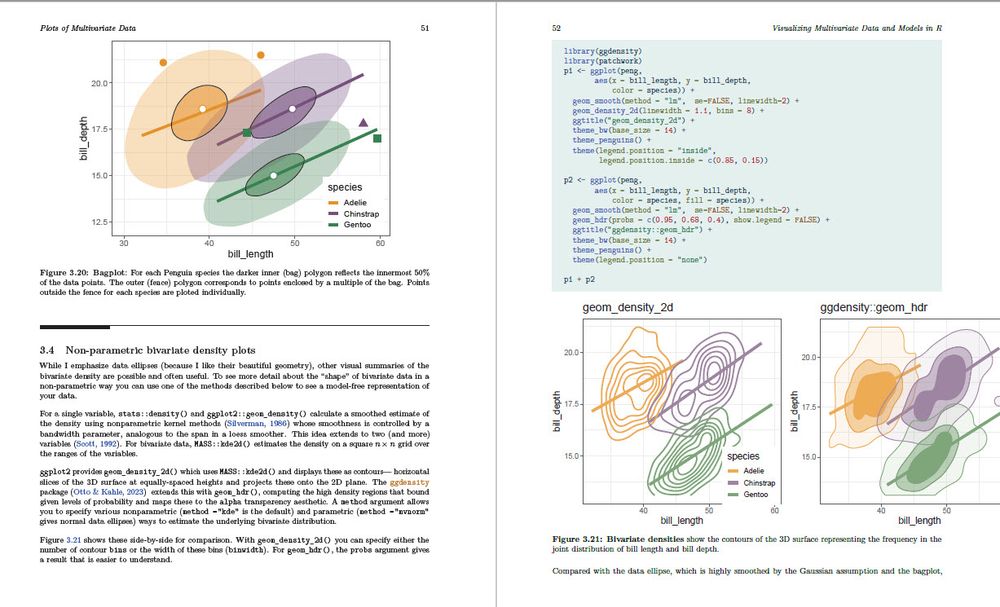
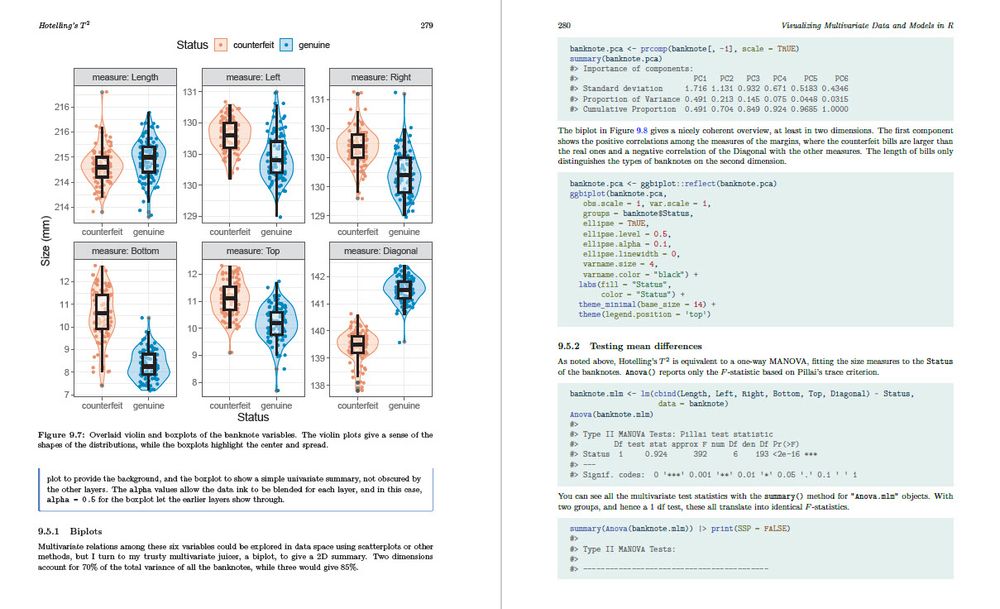
Visualizing Multivariate Data and Models in R
On the whole, looks good, but lots of tweaking to do.
It weighs in at ~440 pgs., so perhaps some cutting needed.
Visualizing Multivariate Data and Models in R
On the whole, looks good, but lots of tweaking to do.
It weighs in at ~440 pgs., so perhaps some cutting needed.

August 9, 2025 at 5:04 PM
#rstats So chuffed! I printed the first PDF copy of my book to see what it might look like in print! It will be printed in full color!
Visualizing Multivariate Data and Models in R
On the whole, looks good, but lots of tweaking to do.
It weighs in at ~440 pgs., so perhaps some cutting needed.
Visualizing Multivariate Data and Models in R
On the whole, looks good, but lots of tweaking to do.
It weighs in at ~440 pgs., so perhaps some cutting needed.
Reposted by Jess Graves

This plot has more than one *You had one job* kind of energy. ✨️
The prominent one, is using the same y-axis scale for both Median Home Price & Real Weekly Wages.
Anyway, gently dropping my attempt to visualize the y-axis scaling mismatch: darakhshannehal.quarto.pub/scrollytelli... :)
#dataviz
The prominent one, is using the same y-axis scale for both Median Home Price & Real Weekly Wages.
Anyway, gently dropping my attempt to visualize the y-axis scaling mismatch: darakhshannehal.quarto.pub/scrollytelli... :)
#dataviz

August 8, 2025 at 9:19 AM
This plot has more than one *You had one job* kind of energy. ✨️
The prominent one, is using the same y-axis scale for both Median Home Price & Real Weekly Wages.
Anyway, gently dropping my attempt to visualize the y-axis scaling mismatch: darakhshannehal.quarto.pub/scrollytelli... :)
#dataviz
The prominent one, is using the same y-axis scale for both Median Home Price & Real Weekly Wages.
Anyway, gently dropping my attempt to visualize the y-axis scaling mismatch: darakhshannehal.quarto.pub/scrollytelli... :)
#dataviz
Reposted by Jess Graves

This take is so damn HOT

Every Silicon Valley innovation in the consumer space has been "what if this software was my mom" which explains why ChatGPT's primary use is as a therapist, relationship substitute for lonely boys, and "personal operating system" to organize their life
August 8, 2025 at 2:48 AM
This take is so damn HOT
Reposted by Jess Graves

I don't remember the last time I was this emotionally invested
April 15, 2025 at 3:46 AM
I don't remember the last time I was this emotionally invested
Reposted by Jess Graves


Time for one of my favorites:

August 8, 2025 at 12:41 AM
Time for one of my favorites:
One my favorite resources!!
I am working on a review of how paired t tests are a unique case of mixed models.
I am working on a review of how paired t tests are a unique case of mixed models.

How many years after undergrad stats did you discover that common statistical tests are linear models? lindeloev.github.io/tests-as-lin...

August 7, 2025 at 5:11 PM
One my favorite resources!!
I am working on a review of how paired t tests are a unique case of mixed models.
I am working on a review of how paired t tests are a unique case of mixed models.
Reposted by Jess Graves

AI filmmaking is peeing. It’s pooping. It’s throwing up. It’s a new kind of liquid coming out. It’s hated by the establishment. It’s what goes in the toilet. It’s wet. It’s what’s in the bathroom.

August 6, 2025 at 1:48 AM
AI filmmaking is peeing. It’s pooping. It’s throwing up. It’s a new kind of liquid coming out. It’s hated by the establishment. It’s what goes in the toilet. It’s wet. It’s what’s in the bathroom.
Reposted by Jess Graves

“Do we like Damien? We like Damien, don’t we? It’s all for him, we do it all for him. We just want him to look at us. We treat him well, sometimes he’s not very nice to us, but it is for him, it’s really all for Damien.”

August 5, 2025 at 3:14 PM
“Do we like Damien? We like Damien, don’t we? It’s all for him, we do it all for him. We just want him to look at us. We treat him well, sometimes he’s not very nice to us, but it is for him, it’s really all for Damien.”
Reposted by Jess Graves

To say that "the data show these vaccines fail" in regards to the mRNA plaform is unforgivable.
For those of you that don't remember - this is the data from a SINGLE dose. In December 2020. So good I cried in grateful tears.
For those of you that don't remember - this is the data from a SINGLE dose. In December 2020. So good I cried in grateful tears.

August 5, 2025 at 10:19 PM
To say that "the data show these vaccines fail" in regards to the mRNA plaform is unforgivable.
For those of you that don't remember - this is the data from a SINGLE dose. In December 2020. So good I cried in grateful tears.
For those of you that don't remember - this is the data from a SINGLE dose. In December 2020. So good I cried in grateful tears.