


Darakhshan Nehal
@darakhshann.bsky.social
Health Data Science | 📊 DataViz | 📖✨️ | 🐾
Looking for health data analytics or data science position.
LinkedIn: www.linkedin.com/in/darakhshan-nehal-b38747154/
GitHub: https://github.com/darakhshannehal
Looking for health data analytics or data science position.
LinkedIn: www.linkedin.com/in/darakhshan-nehal-b38747154/
GitHub: https://github.com/darakhshannehal
Pinned

#TidyTuesday (2025-09-30) | Crane Observations at Lake Hornborgasjön, Sweden (1994–2024)
This week, I focused on the sharp, sustained spike in September counts starting around 2012, a potential sign of shifting migration patterns.
Code: github.com/darakhshanne...
📊 #RStats #DataViz #ggplot2
This week, I focused on the sharp, sustained spike in September counts starting around 2012, a potential sign of shifting migration patterns.
Code: github.com/darakhshanne...
📊 #RStats #DataViz #ggplot2
Reposted by Darakhshan Nehal

In 2024, 46.9% of net electricity generated in the EU came from renewable energy sources (Eurostat). In the first half of 2025, renewable energy has outpaced coal as the primary source of electricity globally, indicating a shift in our reliance on fossil fuels (NPR). 🌞
#30DayMapChallenge Minimal
#30DayMapChallenge Minimal

November 11, 2025 at 7:53 AM
In 2024, 46.9% of net electricity generated in the EU came from renewable energy sources (Eurostat). In the first half of 2025, renewable energy has outpaced coal as the primary source of electricity globally, indicating a shift in our reliance on fossil fuels (NPR). 🌞
#30DayMapChallenge Minimal
#30DayMapChallenge Minimal
Reposted by Darakhshan Nehal

Very important news everyone


November 11, 2025 at 1:38 AM
Very important news everyone
Reposted by Darakhshan Nehal

he’s the king for a reason
November 10, 2025 at 4:24 PM
he’s the king for a reason
Reposted by Darakhshan Nehal


Reposted by Darakhshan Nehal

I'm participating in an "Open Science Exploratory Roundtable" in the Max Planck Society later this week, so bumping my grumpy thoughts about open science again. I'm as curious as everyone else to see what a club of competitive narcissists who succeeded under the status quo (the MPG) can manage!
How can we reform science? I have some ideas. But I am not sure you’ll like them, because they don’t promise much. elevanth.org/blog/2025/07...

Which Kind of Science Reform
What hope is there for science reform, if we can't agree on what to reform? Right now, principles are more important than practices.
elevanth.org
November 10, 2025 at 8:38 AM
I'm participating in an "Open Science Exploratory Roundtable" in the Max Planck Society later this week, so bumping my grumpy thoughts about open science again. I'm as curious as everyone else to see what a club of competitive narcissists who succeeded under the status quo (the MPG) can manage!
Reposted by Darakhshan Nehal
Imagine if global health meetings were actually hosted in places where the real problems and real solutions are?

Welcome to snowy Toronto for Trop Med 2025 - the irony is not lost on me!

November 10, 2025 at 5:48 PM
Imagine if global health meetings were actually hosted in places where the real problems and real solutions are?
Reposted by Darakhshan Nehal

One of my favourite charts (my only contribution was the annotation)

Now this is how you detect whether an election was stolen. Humans choose rounder numbers.
by @TheEconomist
by @TheEconomist

November 6, 2025 at 3:37 PM
One of my favourite charts (my only contribution was the annotation)
This disparity is the central theme in the book, Everything Is Tuberculosis. TB remains prevalent even though efficient treatment exist.
In Global South, this inaccessibility can be summed up in John Green’s words: “the cure is where the disease is not, and the disease is where the cure is not".
In Global South, this inaccessibility can be summed up in John Green’s words: “the cure is where the disease is not, and the disease is where the cure is not".
This week's #TidyTuesday data is from the WHO and looks at rates of TB cases and deaths around the world 📊
I used the {ggh4x} package to get this custom facet layout with large chart for global data, and then small multiples for each WHO region 🗺️
#DataViz #ggplot2 #RStats
I used the {ggh4x} package to get this custom facet layout with large chart for global data, and then small multiples for each WHO region 🗺️
#DataViz #ggplot2 #RStats

November 10, 2025 at 7:38 PM
This disparity is the central theme in the book, Everything Is Tuberculosis. TB remains prevalent even though efficient treatment exist.
In Global South, this inaccessibility can be summed up in John Green’s words: “the cure is where the disease is not, and the disease is where the cure is not".
In Global South, this inaccessibility can be summed up in John Green’s words: “the cure is where the disease is not, and the disease is where the cure is not".
Agree about cowplot for precise customization. From the Q&A: 💯 I don’t think an LLM could recreate those in the first few sane attempts.
This actually makes me want to try recreating them, thank you, adding to the list.
And yes, as we can all see in 2025, history does repeat itself.
This actually makes me want to try recreating them, thank you, adding to the list.
And yes, as we can all see in 2025, history does repeat itself.

My Posit::conf talk is now live on YouTube! 🎥
👉 youtu.be/RxwU1cZ5FiA?...
Exploring reproducible design in R & bringing history to life through data.
Grateful to the @posit.co team! 💜
#positconf25 #RStats #DataScience
👉 youtu.be/RxwU1cZ5FiA?...
Exploring reproducible design in R & bringing history to life through data.
Grateful to the @posit.co team! 💜
#positconf25 #RStats #DataScience

History repeats itself: What the Du Bois Challenge taught me about reproducing design (Simi Ndaba)
YouTube video by Posit PBC
youtu.be
November 10, 2025 at 5:28 PM
Agree about cowplot for precise customization. From the Q&A: 💯 I don’t think an LLM could recreate those in the first few sane attempts.
This actually makes me want to try recreating them, thank you, adding to the list.
And yes, as we can all see in 2025, history does repeat itself.
This actually makes me want to try recreating them, thank you, adding to the list.
And yes, as we can all see in 2025, history does repeat itself.
Reposted by Darakhshan Nehal


November 10, 2025 at 3:18 AM
Reposted by Darakhshan Nehal

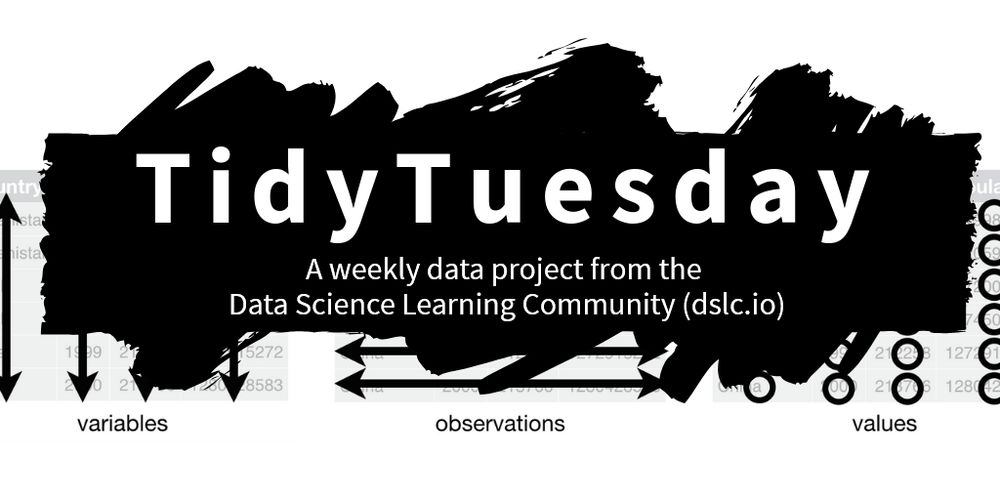
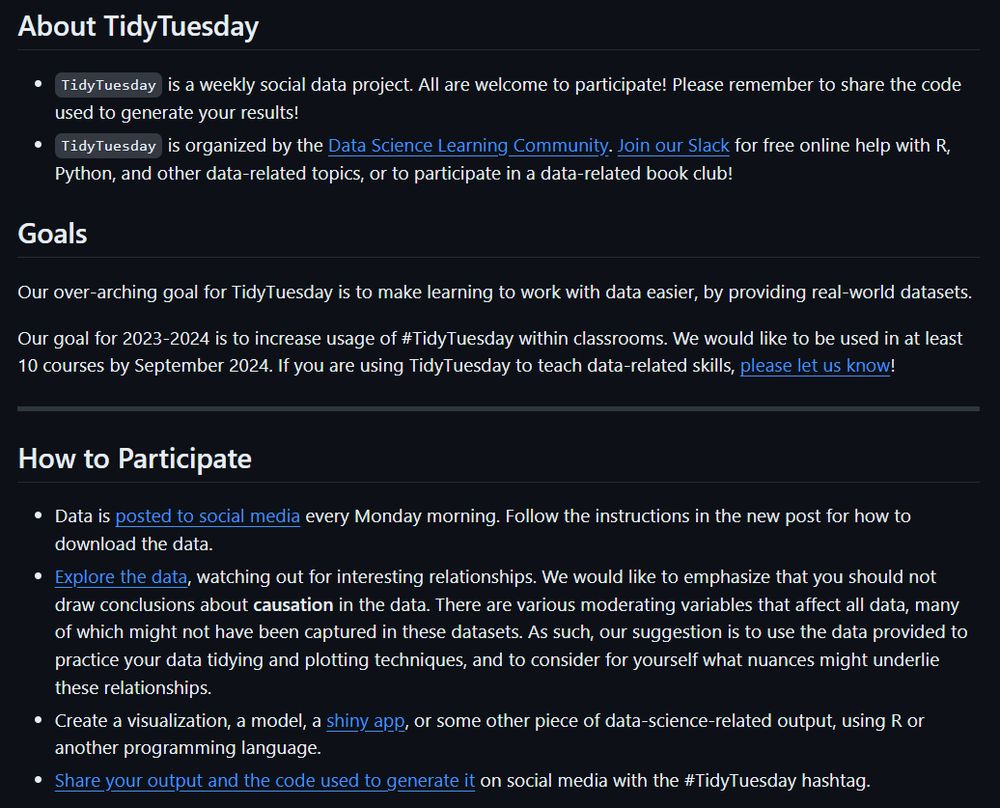
@dslc.io welcomes you to week 45 of #TidyTuesday! We're exploring WHO TB Burden Data: Incidence, Mortality, and Population!
📁 https://tidytues.day/2025/2025-11-11
📰 https://samabbott.co.uk/getTBinR/index.html
#RStats #PyData #JuliaLang #DataViz #tidyverse #r4ds
📁 https://tidytues.day/2025/2025-11-11
📰 https://samabbott.co.uk/getTBinR/index.html
#RStats #PyData #JuliaLang #DataViz #tidyverse #r4ds

November 10, 2025 at 1:48 PM
@dslc.io welcomes you to week 45 of #TidyTuesday! We're exploring WHO TB Burden Data: Incidence, Mortality, and Population!
📁 https://tidytues.day/2025/2025-11-11
📰 https://samabbott.co.uk/getTBinR/index.html
#RStats #PyData #JuliaLang #DataViz #tidyverse #r4ds
📁 https://tidytues.day/2025/2025-11-11
📰 https://samabbott.co.uk/getTBinR/index.html
#RStats #PyData #JuliaLang #DataViz #tidyverse #r4ds
Reposted by Darakhshan Nehal
#rstats: Is there any ggplot2 extension (or trick with ggfx / grid) that can render lines with a hand-drawn or brush-stroke effect? I’m trying to get something that looks more organic than a standard geom_line().
November 10, 2025 at 10:53 AM
#rstats: Is there any ggplot2 extension (or trick with ggfx / grid) that can render lines with a hand-drawn or brush-stroke effect? I’m trying to get something that looks more organic than a standard geom_line().
Reposted by Darakhshan Nehal

📣 ‼️ This week we’re hosting Dr Heather Turner! 📣 ‼️
She’ll share insights from R Dev Days, collaborative efforts contributing to #Rstats, documentation, translations & more, including great work from the R-Ladies community!
🔗 Sign up: buff.ly/F2qikpO
📆 12 Nov, 5.30-7.30pm
📍 Monash City Campus
She’ll share insights from R Dev Days, collaborative efforts contributing to #Rstats, documentation, translations & more, including great work from the R-Ladies community!
🔗 Sign up: buff.ly/F2qikpO
📆 12 Nov, 5.30-7.30pm
📍 Monash City Campus

R-Ladies at R Dev Days with Dr Heather Turner, Wed, Nov 12, 2025, 5:30 PM | Meetup
Rladies Melbourne will be hosting Dr Heather Turner who is a leading R developer and statistician with over two decades of experience. **R-Ladies at R Dev Days** Under my
buff.ly
November 10, 2025 at 6:00 AM
📣 ‼️ This week we’re hosting Dr Heather Turner! 📣 ‼️
She’ll share insights from R Dev Days, collaborative efforts contributing to #Rstats, documentation, translations & more, including great work from the R-Ladies community!
🔗 Sign up: buff.ly/F2qikpO
📆 12 Nov, 5.30-7.30pm
📍 Monash City Campus
She’ll share insights from R Dev Days, collaborative efforts contributing to #Rstats, documentation, translations & more, including great work from the R-Ladies community!
🔗 Sign up: buff.ly/F2qikpO
📆 12 Nov, 5.30-7.30pm
📍 Monash City Campus
Reposted by Darakhshan Nehal

The Cologne “Grüngürtel” (Green Belts) emerged from former fortress areas. Mayor Konrad Adenauer recognized the importance of a natural air filter for the people in the city. The Inner Green Belt and the Outer Green Belt were built between 1922 and 1924.
#30DayMapChallenge | Day 05 - Earth #rstats
#30DayMapChallenge | Day 05 - Earth #rstats

November 9, 2025 at 8:08 PM
The Cologne “Grüngürtel” (Green Belts) emerged from former fortress areas. Mayor Konrad Adenauer recognized the importance of a natural air filter for the people in the city. The Inner Green Belt and the Outer Green Belt were built between 1922 and 1924.
#30DayMapChallenge | Day 05 - Earth #rstats
#30DayMapChallenge | Day 05 - Earth #rstats
Reposted by Darakhshan Nehal

My talk from posit::conf earlier this fall on getting unstuck with #Python is now available to watch!
- Ten years ago, I attempted to learn Python and it went EXTRMELY badly 😩
- I am really happy that so much tooling in this area has improved SO much since then 😌
youtu.be/pMVYl9fx1EE
- Ten years ago, I attempted to learn Python and it went EXTRMELY badly 😩
- I am really happy that so much tooling in this area has improved SO much since then 😌
youtu.be/pMVYl9fx1EE

How I got unstuck with Python (Julia Silge, Posit) | posit::conf(2025)
YouTube video by Posit PBC
youtu.be
November 8, 2025 at 11:59 PM
My talk from posit::conf earlier this fall on getting unstuck with #Python is now available to watch!
- Ten years ago, I attempted to learn Python and it went EXTRMELY badly 😩
- I am really happy that so much tooling in this area has improved SO much since then 😌
youtu.be/pMVYl9fx1EE
- Ten years ago, I attempted to learn Python and it went EXTRMELY badly 😩
- I am really happy that so much tooling in this area has improved SO much since then 😌
youtu.be/pMVYl9fx1EE
Reposted by Darakhshan Nehal

Reposted by Darakhshan Nehal

Thanks for all the hard work you do (for free!) for the data community ❤️🥺
November 9, 2025 at 6:28 AM
Thanks for all the hard work you do (for free!) for the data community ❤️🥺
Reposted by Darakhshan Nehal

NOOOOOOOOOO DON'T START EXPLORING DATA IN A JUPYTER NOTEBOOK!

November 9, 2025 at 10:59 AM
NOOOOOOOOOO DON'T START EXPLORING DATA IN A JUPYTER NOTEBOOK!
Reposted by Darakhshan Nehal

Día 8 – Urbano #30DayMapChallenge Urbes más importantes de América Central. Fuente: Open Street Maps. Herramienta: R usando los paquetes sf, ggplot2, osmdata, dplyr, showtext y ggtext


November 8, 2025 at 8:55 PM
Día 8 – Urbano #30DayMapChallenge Urbes más importantes de América Central. Fuente: Open Street Maps. Herramienta: R usando los paquetes sf, ggplot2, osmdata, dplyr, showtext y ggtext
Reposted by Darakhshan Nehal

Nothing like a nice long flight for catching up on #30DayMapChallenge 🤪.
Here's Day 8 — urban — right on time. A map of Paris buildings by age of construction. A real beauty if I do say so myself. 😍
Here's Day 8 — urban — right on time. A map of Paris buildings by age of construction. A real beauty if I do say so myself. 😍

November 9, 2025 at 12:53 AM
Nothing like a nice long flight for catching up on #30DayMapChallenge 🤪.
Here's Day 8 — urban — right on time. A map of Paris buildings by age of construction. A real beauty if I do say so myself. 😍
Here's Day 8 — urban — right on time. A map of Paris buildings by age of construction. A real beauty if I do say so myself. 😍
Reposted by Darakhshan Nehal

Can't write a for loop if you never learned how 😉


November 8, 2025 at 10:07 PM
Can't write a for loop if you never learned how 😉
Reposted by Darakhshan Nehal

POV of me: Learning the hard way how important indentation is in Python... and then discovering extensions exist to visualize control flow chunks. You know. After the fact. 🫠

November 9, 2025 at 5:09 AM
POV of me: Learning the hard way how important indentation is in Python... and then discovering extensions exist to visualize control flow chunks. You know. After the fact. 🫠
Reposted by Darakhshan Nehal
Science will never succeed until we recognize the humanity of all scientists and break the dehumanization cultures that crush too many people.
November 8, 2025 at 7:23 PM
Science will never succeed until we recognize the humanity of all scientists and break the dehumanization cultures that crush too many people.
Reposted by Darakhshan Nehal

I normally use camcorder for previewing plots as @libbyheeren.bsky.social suggested but it's not quite working with the latest version of ggplot2.
The ggview package does a similar thing: github.com/idmn/ggview
The ggview package does a similar thing: github.com/idmn/ggview

GitHub - idmn/ggview: Ggplot picture previewer
Ggplot picture previewer. Contribute to idmn/ggview development by creating an account on GitHub.
github.com
November 8, 2025 at 10:19 AM
I normally use camcorder for previewing plots as @libbyheeren.bsky.social suggested but it's not quite working with the latest version of ggplot2.
The ggview package does a similar thing: github.com/idmn/ggview
The ggview package does a similar thing: github.com/idmn/ggview
Reposted by Darakhshan Nehal

statistics in general is absolutely atrocious at naming things, we should simply not be allowed to do that
November 8, 2025 at 1:49 PM
statistics in general is absolutely atrocious at naming things, we should simply not be allowed to do that