


Cole 🐛
@colebaril.ca
📈 Data Analyst | #RStats Programmer 👨💻
🦋 MSc | Medical Entomology 🦟
💪 Gym | 🧁Baking | Gamer 🎮
🌈 he/him
📍YWG
🦋 MSc | Medical Entomology 🦟
💪 Gym | 🧁Baking | Gamer 🎮
🌈 he/him
📍YWG
Bit late on the last #tidytuesday of 2025 looking at Christmas novels. I created a word map using the top 100 non stop words and a word sentiment tree map using the nrc lexicon. Positivity, joy and trust appear in higher proportion than other text datasets I've looked at!
#RStats
#RStats


January 6, 2026 at 3:41 AM
Bit late on the last #tidytuesday of 2025 looking at Christmas novels. I created a word map using the top 100 non stop words and a word sentiment tree map using the nrc lexicon. Positivity, joy and trust appear in higher proportion than other text datasets I've looked at!
#RStats
#RStats
Did anyone else get absolutely destroyed by this year’s COVID/Flu vaccines?
October 28, 2025 at 7:34 PM
Did anyone else get absolutely destroyed by this year’s COVID/Flu vaccines?
I feel bad that I randomly stopped my series. I got sick and then life happened :(
October 22, 2025 at 11:12 PM
I feel bad that I randomly stopped my series. I got sick and then life happened :(
We need this asap

How about yeet() ?
October 22, 2025 at 10:33 PM
We need this asap
Reposted by Cole 🐛

My backpacking itinerary
October 21, 2025 at 10:33 AM
My backpacking itinerary
👽🛸 Spooktober: Data After Dark - October 8
Today is part one of a multi-part segment on a UFO sighting dataset.
For part 1, I created an interactive Shiny app to explore the data. Map points are clickable!
colewb.shinyapps.io/alien-atlas/
#DataViz #R #Shiny #ggplot2 #RStats #Alien #UFO
Today is part one of a multi-part segment on a UFO sighting dataset.
For part 1, I created an interactive Shiny app to explore the data. Map points are clickable!
colewb.shinyapps.io/alien-atlas/
#DataViz #R #Shiny #ggplot2 #RStats #Alien #UFO
👽 Alien Atlas: UFO Sightings Map
colewb.shinyapps.io
October 9, 2025 at 4:21 AM
🎃👻 Spooktober: Data After Dark - October 7
Today's plot shows inflation adjusted U.S. Halloween spending across 4 categories from 2005 to 2025 (2025 anticipated).
#Spooktober #DataViz #R #ggplot2 #RStats #Tidyverse #Retail #Halloween
Today's plot shows inflation adjusted U.S. Halloween spending across 4 categories from 2005 to 2025 (2025 anticipated).
#Spooktober #DataViz #R #ggplot2 #RStats #Tidyverse #Retail #Halloween

October 8, 2025 at 12:41 AM
🎃👻 Spooktober: Data After Dark - October 7
Today's plot shows inflation adjusted U.S. Halloween spending across 4 categories from 2005 to 2025 (2025 anticipated).
#Spooktober #DataViz #R #ggplot2 #RStats #Tidyverse #Retail #Halloween
Today's plot shows inflation adjusted U.S. Halloween spending across 4 categories from 2005 to 2025 (2025 anticipated).
#Spooktober #DataViz #R #ggplot2 #RStats #Tidyverse #Retail #Halloween
🎃👻 Spooktober: Data After Dark - October 6
Spirit Halloween stores seem to pop up almost everywhere out of nowhere. I wanted to see just how ubiquitous these temporary shops are across North America.
#Spooktober #DataViz #R #ggplot2 #RStats #Tidyverse #SpiritHalloween #Retail #Halloween
Spirit Halloween stores seem to pop up almost everywhere out of nowhere. I wanted to see just how ubiquitous these temporary shops are across North America.
#Spooktober #DataViz #R #ggplot2 #RStats #Tidyverse #SpiritHalloween #Retail #Halloween

October 6, 2025 at 10:10 PM
🎃👻 Spooktober: Data After Dark - October 6
Spirit Halloween stores seem to pop up almost everywhere out of nowhere. I wanted to see just how ubiquitous these temporary shops are across North America.
#Spooktober #DataViz #R #ggplot2 #RStats #Tidyverse #SpiritHalloween #Retail #Halloween
Spirit Halloween stores seem to pop up almost everywhere out of nowhere. I wanted to see just how ubiquitous these temporary shops are across North America.
#Spooktober #DataViz #R #ggplot2 #RStats #Tidyverse #SpiritHalloween #Retail #Halloween
🎃👻 Spooktober: Data After Dark - October 5
Want to know which Halloween candy is most popular? Look no further. This Halloween candy constellation plot shows which candy traits are the most popular together.
#Spooktober #DataViz #R #ggplot2 #RStats #Tidyverse #HalloweenCandy #Candy #TrickOrTreat
Want to know which Halloween candy is most popular? Look no further. This Halloween candy constellation plot shows which candy traits are the most popular together.
#Spooktober #DataViz #R #ggplot2 #RStats #Tidyverse #HalloweenCandy #Candy #TrickOrTreat

October 5, 2025 at 8:27 PM
🎃👻 Spooktober: Data After Dark - October 5
Want to know which Halloween candy is most popular? Look no further. This Halloween candy constellation plot shows which candy traits are the most popular together.
#Spooktober #DataViz #R #ggplot2 #RStats #Tidyverse #HalloweenCandy #Candy #TrickOrTreat
Want to know which Halloween candy is most popular? Look no further. This Halloween candy constellation plot shows which candy traits are the most popular together.
#Spooktober #DataViz #R #ggplot2 #RStats #Tidyverse #HalloweenCandy #Candy #TrickOrTreat
🎃👻 Spooktober: Data After Dark - October 4
Today, I looked into U.S. pumpkin production. Illinois dominates in the U.S. due to its ideal soil type and favourable conditions for pumpkin growing.
#Spooktober #DataViz #RStats #Tidyverse #Pumpkins #Pumpkin
Today, I looked into U.S. pumpkin production. Illinois dominates in the U.S. due to its ideal soil type and favourable conditions for pumpkin growing.
#Spooktober #DataViz #RStats #Tidyverse #Pumpkins #Pumpkin
October 4, 2025 at 5:56 PM
🎃👻 Spooktober: Data After Dark - October 4
Today, I looked into U.S. pumpkin production. Illinois dominates in the U.S. due to its ideal soil type and favourable conditions for pumpkin growing.
#Spooktober #DataViz #RStats #Tidyverse #Pumpkins #Pumpkin
Today, I looked into U.S. pumpkin production. Illinois dominates in the U.S. due to its ideal soil type and favourable conditions for pumpkin growing.
#Spooktober #DataViz #RStats #Tidyverse #Pumpkins #Pumpkin
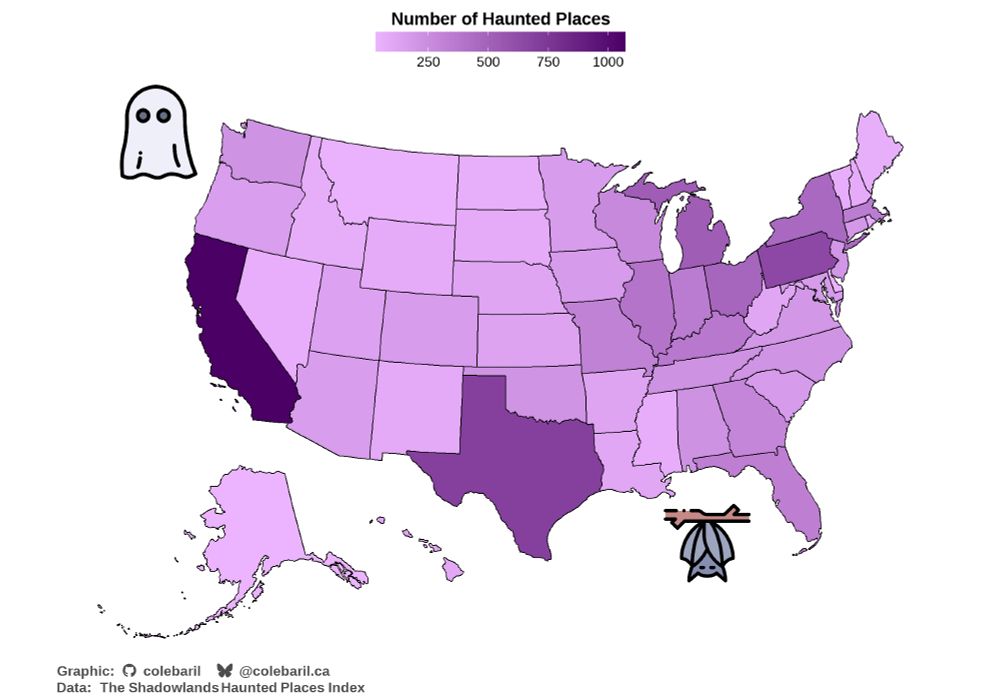
🎃👻 Spooktober: Data After Dark - October 3
Today, I looked at the number of haunted places in each U.S. state. CA and TX have the highest number of haunted places. Does this have something to do with population...?
#Spooktober #DataViz #RStats #Tidyverse #Hauntings #HauntedHouse
Today, I looked at the number of haunted places in each U.S. state. CA and TX have the highest number of haunted places. Does this have something to do with population...?
#Spooktober #DataViz #RStats #Tidyverse #Hauntings #HauntedHouse
October 3, 2025 at 4:58 AM
🎃👻 Spooktober: Data After Dark - October 3
Today, I looked at the number of haunted places in each U.S. state. CA and TX have the highest number of haunted places. Does this have something to do with population...?
#Spooktober #DataViz #RStats #Tidyverse #Hauntings #HauntedHouse
Today, I looked at the number of haunted places in each U.S. state. CA and TX have the highest number of haunted places. Does this have something to do with population...?
#Spooktober #DataViz #RStats #Tidyverse #Hauntings #HauntedHouse
Reposted by Cole 🐛
🎃👻 Spooktober: Data After Dark - October 1 🧵
Kicking off this spooky data series by looking at when horror movies are released.
Unsurprisingly, October dominates! From the 2000s onward, October became the clear peak for horror releases.
#Spooktober #DataViz #RStats #Tidyverse #HorrorMovies
Kicking off this spooky data series by looking at when horror movies are released.
Unsurprisingly, October dominates! From the 2000s onward, October became the clear peak for horror releases.
#Spooktober #DataViz #RStats #Tidyverse #HorrorMovies

October 1, 2025 at 4:34 AM
🎃👻 Spooktober: Data After Dark - October 1 🧵
Kicking off this spooky data series by looking at when horror movies are released.
Unsurprisingly, October dominates! From the 2000s onward, October became the clear peak for horror releases.
#Spooktober #DataViz #RStats #Tidyverse #HorrorMovies
Kicking off this spooky data series by looking at when horror movies are released.
Unsurprisingly, October dominates! From the 2000s onward, October became the clear peak for horror releases.
#Spooktober #DataViz #RStats #Tidyverse #HorrorMovies
🎃👻 Spooktober: Data After Dark - October 2
Continuing off yesterday's theme of horror movies, for today's graphic I made a word cloud from >32K horror movie titles using the tidytext and wordcloud2 packages.
#Spooktober #DataViz #RStats #Tidyverse #HorrorMovies
Continuing off yesterday's theme of horror movies, for today's graphic I made a word cloud from >32K horror movie titles using the tidytext and wordcloud2 packages.
#Spooktober #DataViz #RStats #Tidyverse #HorrorMovies

October 2, 2025 at 3:57 AM
🎃👻 Spooktober: Data After Dark - October 2
Continuing off yesterday's theme of horror movies, for today's graphic I made a word cloud from >32K horror movie titles using the tidytext and wordcloud2 packages.
#Spooktober #DataViz #RStats #Tidyverse #HorrorMovies
Continuing off yesterday's theme of horror movies, for today's graphic I made a word cloud from >32K horror movie titles using the tidytext and wordcloud2 packages.
#Spooktober #DataViz #RStats #Tidyverse #HorrorMovies
🎃👻 Spooktober: Data After Dark - October 1 🧵
Kicking off this spooky data series by looking at when horror movies are released.
Unsurprisingly, October dominates! From the 2000s onward, October became the clear peak for horror releases.
#Spooktober #DataViz #RStats #Tidyverse #HorrorMovies
Kicking off this spooky data series by looking at when horror movies are released.
Unsurprisingly, October dominates! From the 2000s onward, October became the clear peak for horror releases.
#Spooktober #DataViz #RStats #Tidyverse #HorrorMovies
October 1, 2025 at 4:34 AM
🎃👻 Spooktober: Data After Dark - October 1 🧵
Kicking off this spooky data series by looking at when horror movies are released.
Unsurprisingly, October dominates! From the 2000s onward, October became the clear peak for horror releases.
#Spooktober #DataViz #RStats #Tidyverse #HorrorMovies
Kicking off this spooky data series by looking at when horror movies are released.
Unsurprisingly, October dominates! From the 2000s onward, October became the clear peak for horror releases.
#Spooktober #DataViz #RStats #Tidyverse #HorrorMovies
Starting October 1! I have been a busy beaver curating spooky datasets!
#RStats #ggplot2 #DataViz #R #Tidyverse
#RStats #ggplot2 #DataViz #R #Tidyverse

September 26, 2025 at 4:02 AM
Starting October 1! I have been a busy beaver curating spooky datasets!
#RStats #ggplot2 #DataViz #R #Tidyverse
#RStats #ggplot2 #DataViz #R #Tidyverse
Reposted by Cole 🐛

Google: here's an AI summary!
Adobe: want an AI assistant?
Zoom: get more done with an AI companion!
Outlook: don't you want to turn on copilot??
Me: I trained for 10 years to think. I like thinking. Please just let me think.
Adobe: want an AI assistant?
Zoom: get more done with an AI companion!
Outlook: don't you want to turn on copilot??
Me: I trained for 10 years to think. I like thinking. Please just let me think.
September 24, 2025 at 6:26 PM
Google: here's an AI summary!
Adobe: want an AI assistant?
Zoom: get more done with an AI companion!
Outlook: don't you want to turn on copilot??
Me: I trained for 10 years to think. I like thinking. Please just let me think.
Adobe: want an AI assistant?
Zoom: get more done with an AI companion!
Outlook: don't you want to turn on copilot??
Me: I trained for 10 years to think. I like thinking. Please just let me think.
👻 Spooktober is around the corner! 🎃 This October, I’ll be posting a daily spooky-themed data viz created entirely in R/ggplot2. From horror movie heatmaps to haunted word clouds, expect a full month of creepy charts!
Stay tuned & watch this space… 🕸️
#RStats #ggplot2 #DataViz #R #Tidyverse
Stay tuned & watch this space… 🕸️
#RStats #ggplot2 #DataViz #R #Tidyverse
September 25, 2025 at 3:16 AM
👻 Spooktober is around the corner! 🎃 This October, I’ll be posting a daily spooky-themed data viz created entirely in R/ggplot2. From horror movie heatmaps to haunted word clouds, expect a full month of creepy charts!
Stay tuned & watch this space… 🕸️
#RStats #ggplot2 #DataViz #R #Tidyverse
Stay tuned & watch this space… 🕸️
#RStats #ggplot2 #DataViz #R #Tidyverse
Reposted by Cole 🐛

I am beyond excited to announce that ggplot2 4.0.0 has just landed on CRAN.
It's not every day we have a new major #ggplot2 release but it is a fitting 18 year birthday present for the package.
Get an overview of the release in this blog post and be on the lookout for more in-depth posts #rstats
It's not every day we have a new major #ggplot2 release but it is a fitting 18 year birthday present for the package.
Get an overview of the release in this blog post and be on the lookout for more in-depth posts #rstats

ggplot2 4.0.0
A new major version of ggplot2 has been released on CRAN. Find out what is new here.
www.tidyverse.org
September 11, 2025 at 11:20 AM
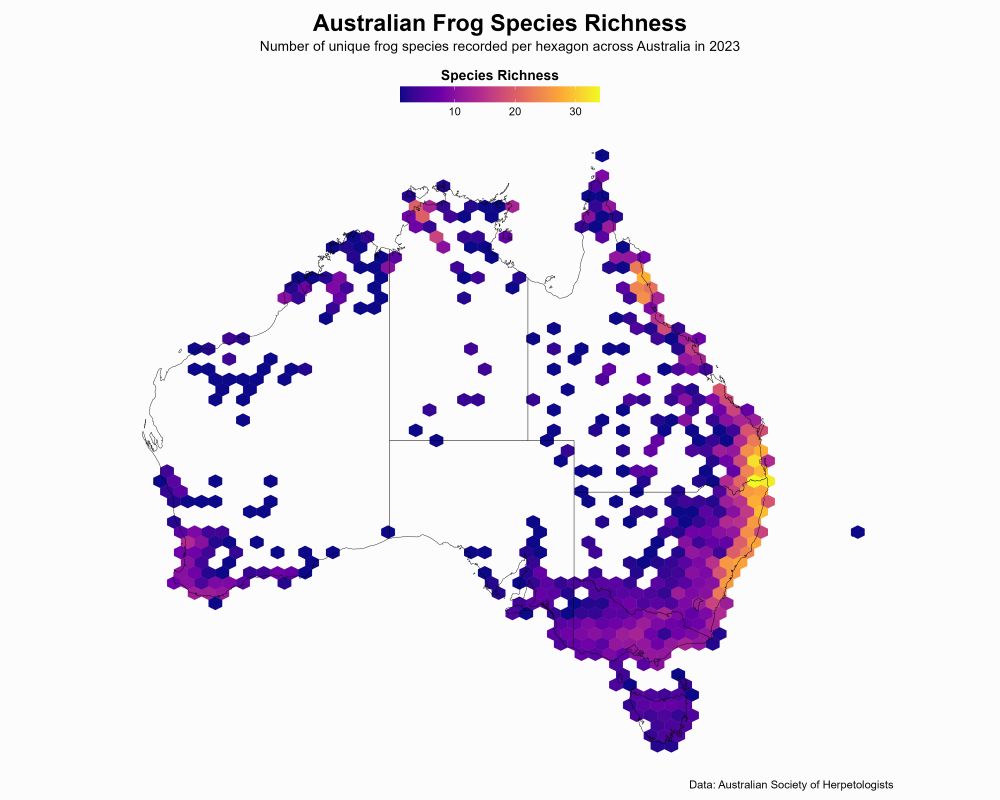
Skipped ahead to next week's (2025-09-02) #tidytuesday because I love frogs.
#r4ds
#datavisualization
#r4ds
#datavisualization
August 29, 2025 at 12:38 AM
Skipped ahead to next week's (2025-09-02) #tidytuesday because I love frogs.
#r4ds
#datavisualization
#r4ds
#datavisualization
I spotted an Aedes vexans mosquito in my bathroom waving her hind legs back and forth. They do this when threatened to evaluate their environment and air currents.
August 23, 2025 at 11:29 PM
I spotted an Aedes vexans mosquito in my bathroom waving her hind legs back and forth. They do this when threatened to evaluate their environment and air currents.
#TidyTuesday Week 32, 2025 - Extreme Weather Attribution Studies 📊
It's almost like there's a connection between extreme weather events and climate change...
It's almost like there's a connection between extreme weather events and climate change...

August 21, 2025 at 2:43 AM
#TidyTuesday Week 32, 2025 - Extreme Weather Attribution Studies 📊
It's almost like there's a connection between extreme weather events and climate change...
It's almost like there's a connection between extreme weather events and climate change...

July 27, 2025 at 11:19 PM
Reposted by Cole 🐛

Black swallowtail (Papilio polyxenes), north of Lake Pontchartrain, Louisiana. #biodiversity #mothweek
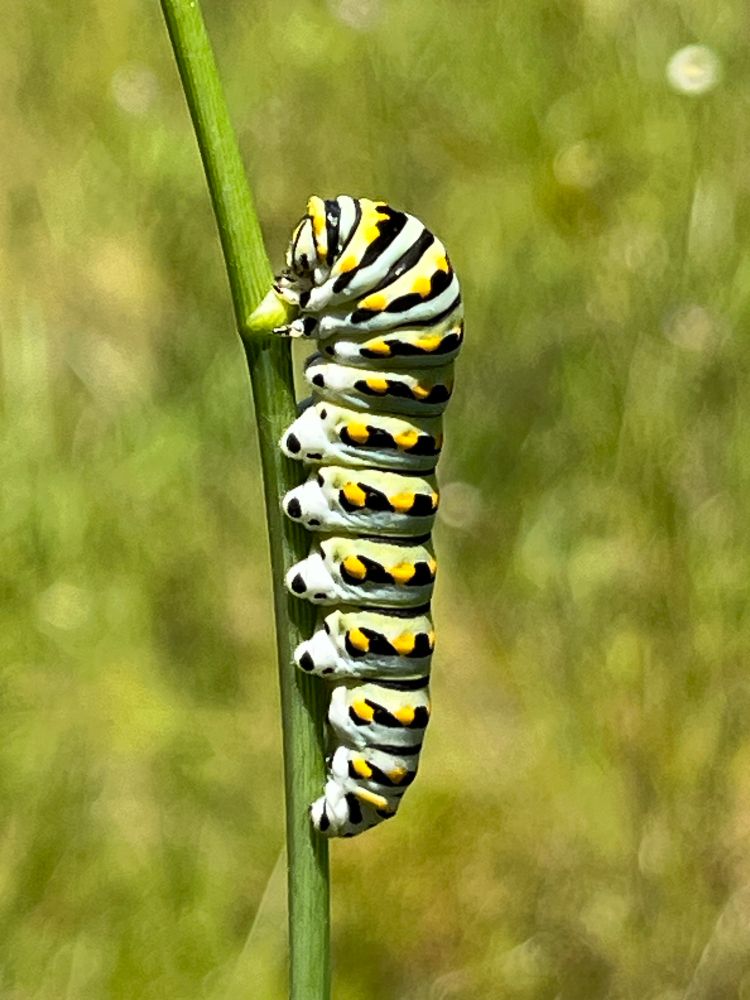
July 23, 2025 at 12:09 AM
Black swallowtail (Papilio polyxenes), north of Lake Pontchartrain, Louisiana. #biodiversity #mothweek