


Cole 🐛
@colebaril.ca
📈 Data Analyst | #RStats Programmer 👨💻
🦋 MSc | Medical Entomology 🦟
💪 Gym | 🧁Baking | Gamer 🎮
🌈 he/him
📍YWG
🦋 MSc | Medical Entomology 🦟
💪 Gym | 🧁Baking | Gamer 🎮
🌈 he/him
📍YWG
🎃👻 Spooktober: Data After Dark - October 7
Today's plot shows inflation adjusted U.S. Halloween spending across 4 categories from 2005 to 2025 (2025 anticipated).
#Spooktober #DataViz #R #ggplot2 #RStats #Tidyverse #Retail #Halloween
Today's plot shows inflation adjusted U.S. Halloween spending across 4 categories from 2005 to 2025 (2025 anticipated).
#Spooktober #DataViz #R #ggplot2 #RStats #Tidyverse #Retail #Halloween

October 8, 2025 at 12:41 AM
🎃👻 Spooktober: Data After Dark - October 7
Today's plot shows inflation adjusted U.S. Halloween spending across 4 categories from 2005 to 2025 (2025 anticipated).
#Spooktober #DataViz #R #ggplot2 #RStats #Tidyverse #Retail #Halloween
Today's plot shows inflation adjusted U.S. Halloween spending across 4 categories from 2005 to 2025 (2025 anticipated).
#Spooktober #DataViz #R #ggplot2 #RStats #Tidyverse #Retail #Halloween
🎃👻 Spooktober: Data After Dark - October 6
Spirit Halloween stores seem to pop up almost everywhere out of nowhere. I wanted to see just how ubiquitous these temporary shops are across North America.
#Spooktober #DataViz #R #ggplot2 #RStats #Tidyverse #SpiritHalloween #Retail #Halloween
Spirit Halloween stores seem to pop up almost everywhere out of nowhere. I wanted to see just how ubiquitous these temporary shops are across North America.
#Spooktober #DataViz #R #ggplot2 #RStats #Tidyverse #SpiritHalloween #Retail #Halloween

October 6, 2025 at 10:10 PM
🎃👻 Spooktober: Data After Dark - October 6
Spirit Halloween stores seem to pop up almost everywhere out of nowhere. I wanted to see just how ubiquitous these temporary shops are across North America.
#Spooktober #DataViz #R #ggplot2 #RStats #Tidyverse #SpiritHalloween #Retail #Halloween
Spirit Halloween stores seem to pop up almost everywhere out of nowhere. I wanted to see just how ubiquitous these temporary shops are across North America.
#Spooktober #DataViz #R #ggplot2 #RStats #Tidyverse #SpiritHalloween #Retail #Halloween
🎃👻 Spooktober: Data After Dark - October 5
Want to know which Halloween candy is most popular? Look no further. This Halloween candy constellation plot shows which candy traits are the most popular together.
#Spooktober #DataViz #R #ggplot2 #RStats #Tidyverse #HalloweenCandy #Candy #TrickOrTreat
Want to know which Halloween candy is most popular? Look no further. This Halloween candy constellation plot shows which candy traits are the most popular together.
#Spooktober #DataViz #R #ggplot2 #RStats #Tidyverse #HalloweenCandy #Candy #TrickOrTreat

October 5, 2025 at 8:27 PM
🎃👻 Spooktober: Data After Dark - October 5
Want to know which Halloween candy is most popular? Look no further. This Halloween candy constellation plot shows which candy traits are the most popular together.
#Spooktober #DataViz #R #ggplot2 #RStats #Tidyverse #HalloweenCandy #Candy #TrickOrTreat
Want to know which Halloween candy is most popular? Look no further. This Halloween candy constellation plot shows which candy traits are the most popular together.
#Spooktober #DataViz #R #ggplot2 #RStats #Tidyverse #HalloweenCandy #Candy #TrickOrTreat
I'm not entirely sure why several states (e.g., PNW, TX) only appear in around 2015 - it is unclear as to whether data collection only started for those states then, or they did not grow pumpkins to that point.

October 4, 2025 at 5:56 PM
I'm not entirely sure why several states (e.g., PNW, TX) only appear in around 2015 - it is unclear as to whether data collection only started for those states then, or they did not grow pumpkins to that point.
🎃👻 Spooktober: Data After Dark - October 4
Today, I looked into U.S. pumpkin production. Illinois dominates in the U.S. due to its ideal soil type and favourable conditions for pumpkin growing.
#Spooktober #DataViz #RStats #Tidyverse #Pumpkins #Pumpkin
Today, I looked into U.S. pumpkin production. Illinois dominates in the U.S. due to its ideal soil type and favourable conditions for pumpkin growing.
#Spooktober #DataViz #RStats #Tidyverse #Pumpkins #Pumpkin
October 4, 2025 at 5:56 PM
🎃👻 Spooktober: Data After Dark - October 4
Today, I looked into U.S. pumpkin production. Illinois dominates in the U.S. due to its ideal soil type and favourable conditions for pumpkin growing.
#Spooktober #DataViz #RStats #Tidyverse #Pumpkins #Pumpkin
Today, I looked into U.S. pumpkin production. Illinois dominates in the U.S. due to its ideal soil type and favourable conditions for pumpkin growing.
#Spooktober #DataViz #RStats #Tidyverse #Pumpkins #Pumpkin
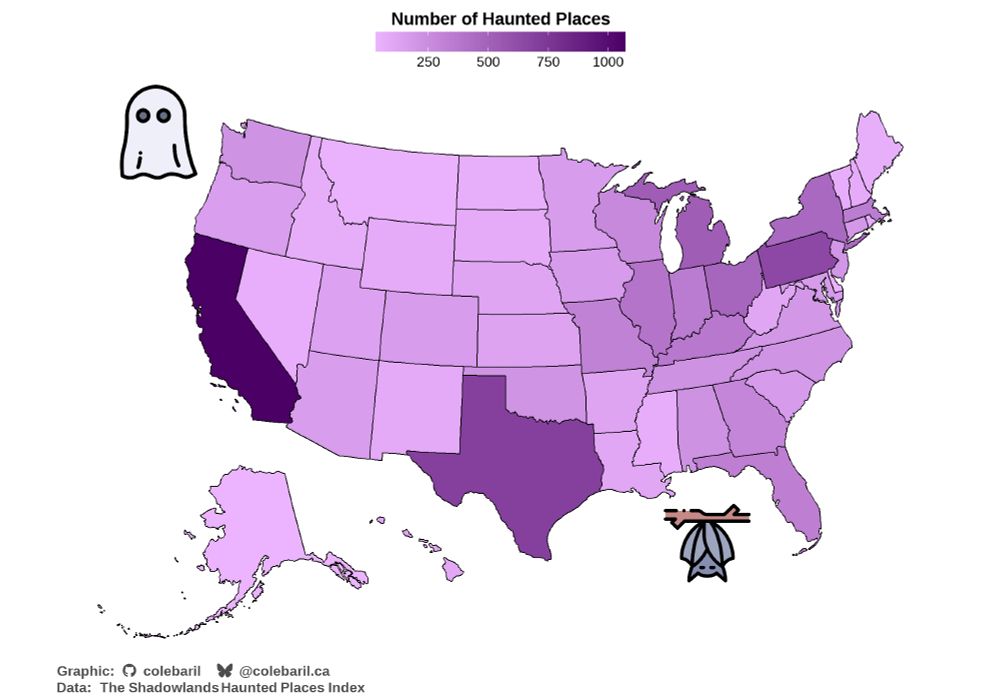
Interestingly, when I graphed the number of haunted places per capita, the graph completely reversed: there are more haunted places per capita in the least populous states.

October 3, 2025 at 4:58 AM
Interestingly, when I graphed the number of haunted places per capita, the graph completely reversed: there are more haunted places per capita in the least populous states.
Sure enough, there is a clear pattern. The more people in a state, the more haunted places. Perhaps this is due to more people to report haunted places, or more entities to do the haunting...

October 3, 2025 at 4:58 AM
Sure enough, there is a clear pattern. The more people in a state, the more haunted places. Perhaps this is due to more people to report haunted places, or more entities to do the haunting...
🎃👻 Spooktober: Data After Dark - October 3
Today, I looked at the number of haunted places in each U.S. state. CA and TX have the highest number of haunted places. Does this have something to do with population...?
#Spooktober #DataViz #RStats #Tidyverse #Hauntings #HauntedHouse
Today, I looked at the number of haunted places in each U.S. state. CA and TX have the highest number of haunted places. Does this have something to do with population...?
#Spooktober #DataViz #RStats #Tidyverse #Hauntings #HauntedHouse
October 3, 2025 at 4:58 AM
🎃👻 Spooktober: Data After Dark - October 3
Today, I looked at the number of haunted places in each U.S. state. CA and TX have the highest number of haunted places. Does this have something to do with population...?
#Spooktober #DataViz #RStats #Tidyverse #Hauntings #HauntedHouse
Today, I looked at the number of haunted places in each U.S. state. CA and TX have the highest number of haunted places. Does this have something to do with population...?
#Spooktober #DataViz #RStats #Tidyverse #Hauntings #HauntedHouse
🎃👻 Spooktober: Data After Dark - October 2
Continuing off yesterday's theme of horror movies, for today's graphic I made a word cloud from >32K horror movie titles using the tidytext and wordcloud2 packages.
#Spooktober #DataViz #RStats #Tidyverse #HorrorMovies
Continuing off yesterday's theme of horror movies, for today's graphic I made a word cloud from >32K horror movie titles using the tidytext and wordcloud2 packages.
#Spooktober #DataViz #RStats #Tidyverse #HorrorMovies

October 2, 2025 at 3:57 AM
🎃👻 Spooktober: Data After Dark - October 2
Continuing off yesterday's theme of horror movies, for today's graphic I made a word cloud from >32K horror movie titles using the tidytext and wordcloud2 packages.
#Spooktober #DataViz #RStats #Tidyverse #HorrorMovies
Continuing off yesterday's theme of horror movies, for today's graphic I made a word cloud from >32K horror movie titles using the tidytext and wordcloud2 packages.
#Spooktober #DataViz #RStats #Tidyverse #HorrorMovies
And the data confirms the rationale behind dump months. Horror releases in January indeed have the lowest popularity.

October 1, 2025 at 4:34 AM
And the data confirms the rationale behind dump months. Horror releases in January indeed have the lowest popularity.
🎃👻 Spooktober: Data After Dark - October 1 🧵
Kicking off this spooky data series by looking at when horror movies are released.
Unsurprisingly, October dominates! From the 2000s onward, October became the clear peak for horror releases.
#Spooktober #DataViz #RStats #Tidyverse #HorrorMovies
Kicking off this spooky data series by looking at when horror movies are released.
Unsurprisingly, October dominates! From the 2000s onward, October became the clear peak for horror releases.
#Spooktober #DataViz #RStats #Tidyverse #HorrorMovies

October 1, 2025 at 4:34 AM
🎃👻 Spooktober: Data After Dark - October 1 🧵
Kicking off this spooky data series by looking at when horror movies are released.
Unsurprisingly, October dominates! From the 2000s onward, October became the clear peak for horror releases.
#Spooktober #DataViz #RStats #Tidyverse #HorrorMovies
Kicking off this spooky data series by looking at when horror movies are released.
Unsurprisingly, October dominates! From the 2000s onward, October became the clear peak for horror releases.
#Spooktober #DataViz #RStats #Tidyverse #HorrorMovies
Starting October 1! I have been a busy beaver curating spooky datasets!
#RStats #ggplot2 #DataViz #R #Tidyverse
#RStats #ggplot2 #DataViz #R #Tidyverse

September 26, 2025 at 4:02 AM
Starting October 1! I have been a busy beaver curating spooky datasets!
#RStats #ggplot2 #DataViz #R #Tidyverse
#RStats #ggplot2 #DataViz #R #Tidyverse
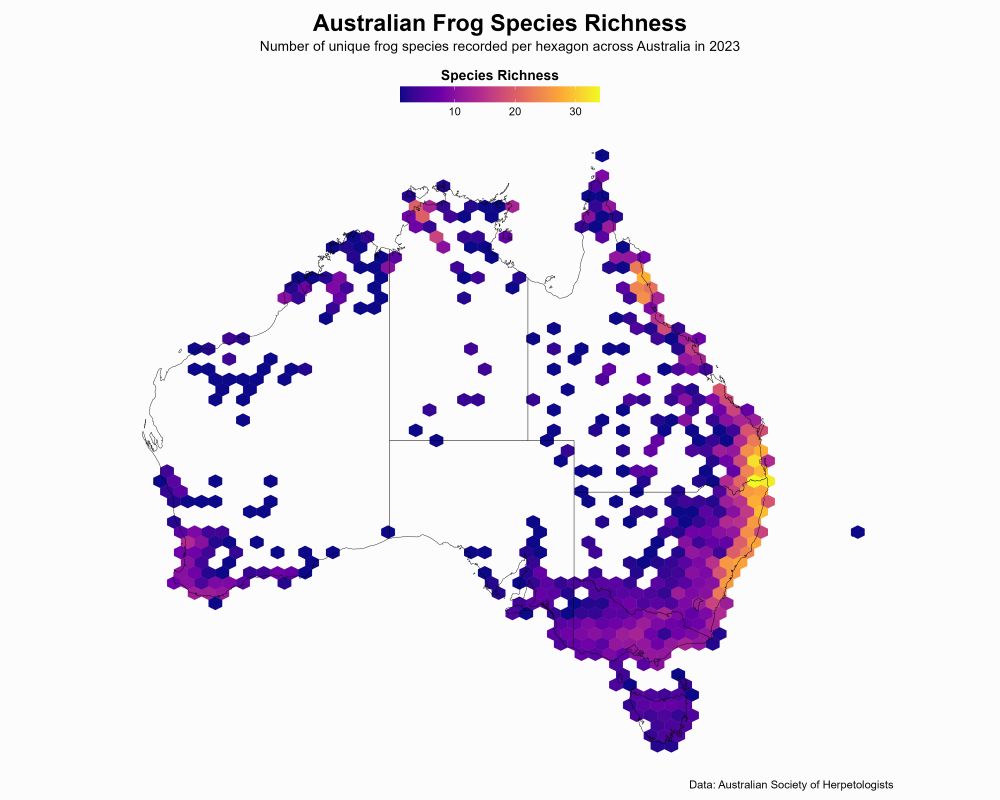
Skipped ahead to next week's (2025-09-02) #tidytuesday because I love frogs.
#r4ds
#datavisualization
#r4ds
#datavisualization
August 29, 2025 at 12:38 AM
Skipped ahead to next week's (2025-09-02) #tidytuesday because I love frogs.
#r4ds
#datavisualization
#r4ds
#datavisualization
ID’d based on telling B shape of scaling on each abdominal tergite combined with leg scales.

August 23, 2025 at 11:31 PM
ID’d based on telling B shape of scaling on each abdominal tergite combined with leg scales.
I spotted an Aedes vexans mosquito in my bathroom waving her hind legs back and forth. They do this when threatened to evaluate their environment and air currents.
August 23, 2025 at 11:29 PM
I spotted an Aedes vexans mosquito in my bathroom waving her hind legs back and forth. They do this when threatened to evaluate their environment and air currents.
#TidyTuesday Week 32, 2025 - Extreme Weather Attribution Studies 📊
It's almost like there's a connection between extreme weather events and climate change...
It's almost like there's a connection between extreme weather events and climate change...

August 21, 2025 at 2:43 AM
#TidyTuesday Week 32, 2025 - Extreme Weather Attribution Studies 📊
It's almost like there's a connection between extreme weather events and climate change...
It's almost like there's a connection between extreme weather events and climate change...

July 27, 2025 at 11:19 PM


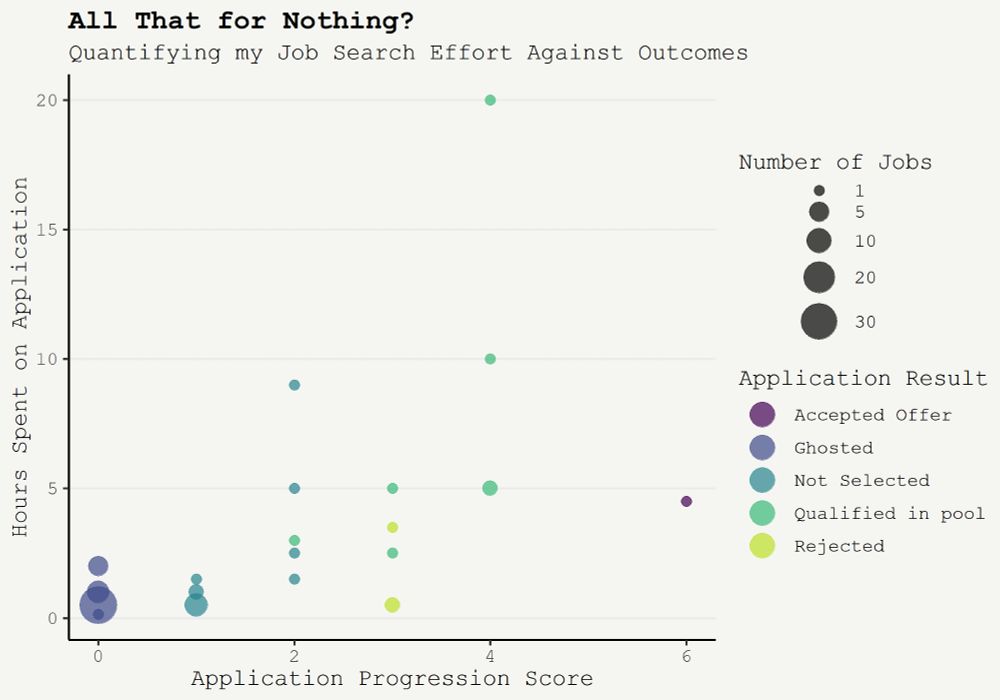
Preparing an article analyzing some data from my recent job search. The x axis is a custom application progression metric measuring how far I made it. Sometimes, a lot of effort in an application and process leads nowhere. Other times, low effort processes can be relatively fruitful.
July 8, 2025 at 4:38 AM
Preparing an article analyzing some data from my recent job search. The x axis is a custom application progression metric measuring how far I made it. Sometimes, a lot of effort in an application and process leads nowhere. Other times, low effort processes can be relatively fruitful.
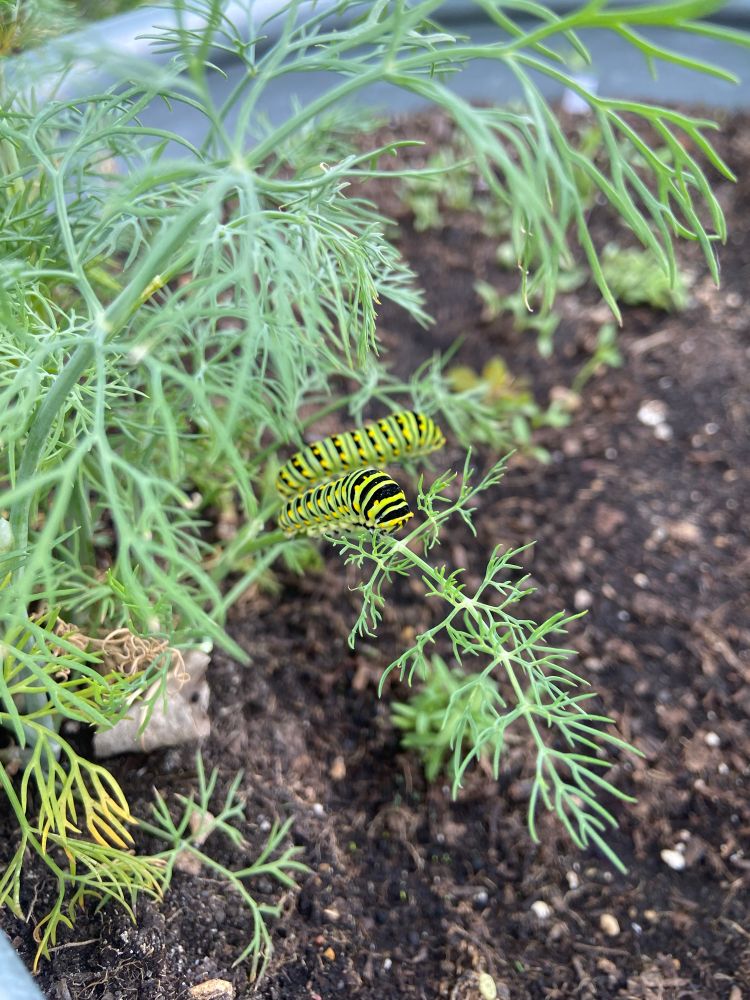
Some black swallowtail late instar caterpillars resting on dill.
June 18, 2025 at 12:50 AM
Some black swallowtail late instar caterpillars resting on dill.

June 14, 2025 at 10:55 PM