


T. from Data Rocks
@datarocksnz.bsky.social
Dataviz | Information Design
The person behind The Dataviz Bookshelf, The Data Design Manifesto & The Design Matters newsletter series.
I don't use autocorrect. I own all of my typos.
https://www.datarocks.co.nz
The person behind The Dataviz Bookshelf, The Data Design Manifesto & The Design Matters newsletter series.
I don't use autocorrect. I own all of my typos.
https://www.datarocks.co.nz
Reposted by T. from Data Rocks

Genuary Day 3: Fibonacci forever
🎨 Figuring out how to programmatically create Fibonacci tiles
#genuary #genuary2026 #genuary3
🎨 Figuring out how to programmatically create Fibonacci tiles
#genuary #genuary2026 #genuary3

January 4, 2026 at 9:20 PM
Genuary Day 3: Fibonacci forever
🎨 Figuring out how to programmatically create Fibonacci tiles
#genuary #genuary2026 #genuary3
🎨 Figuring out how to programmatically create Fibonacci tiles
#genuary #genuary2026 #genuary3
"What do you mean you're 'back to work' today??"
Inquires the Chief Purring Officer.
Inquires the Chief Purring Officer.

January 4, 2026 at 8:10 PM
"What do you mean you're 'back to work' today??"
Inquires the Chief Purring Officer.
Inquires the Chief Purring Officer.
Reposted by T. from Data Rocks
It seems it is once again time for everyone to familiarize themselves with this anti-imperialist classic.

January 3, 2026 at 11:02 PM
It seems it is once again time for everyone to familiarize themselves with this anti-imperialist classic.
Reposted by T. from Data Rocks


Reposted by T. from Data Rocks

I considered writing a long carefully constructed argument laying out the harms and limitations of AI, but instead I wrote about being a hater. Only humans can be haters.
I Am An AI Hater
I am an AI hater. This is considered rude, but I do not care, because I am a hater.
anthonymoser.github.io
August 27, 2025 at 5:04 PM
I considered writing a long carefully constructed argument laying out the harms and limitations of AI, but instead I wrote about being a hater. Only humans can be haters.
Indeed!
Agreed. Excellent.

December 30, 2025 at 5:51 PM
Indeed!
Reposted by T. from Data Rocks

🎉 We’ve received 245 responses to the 2025 State of the Data Viz Industry Survey so far! Take the survey if you create #dataviz in any capacity (hobby, work, school, art), and help us spread the word: www.surveyhero.com/c/soti2025-b...

December 29, 2025 at 2:13 PM
🎉 We’ve received 245 responses to the 2025 State of the Data Viz Industry Survey so far! Take the survey if you create #dataviz in any capacity (hobby, work, school, art), and help us spread the word: www.surveyhero.com/c/soti2025-b...
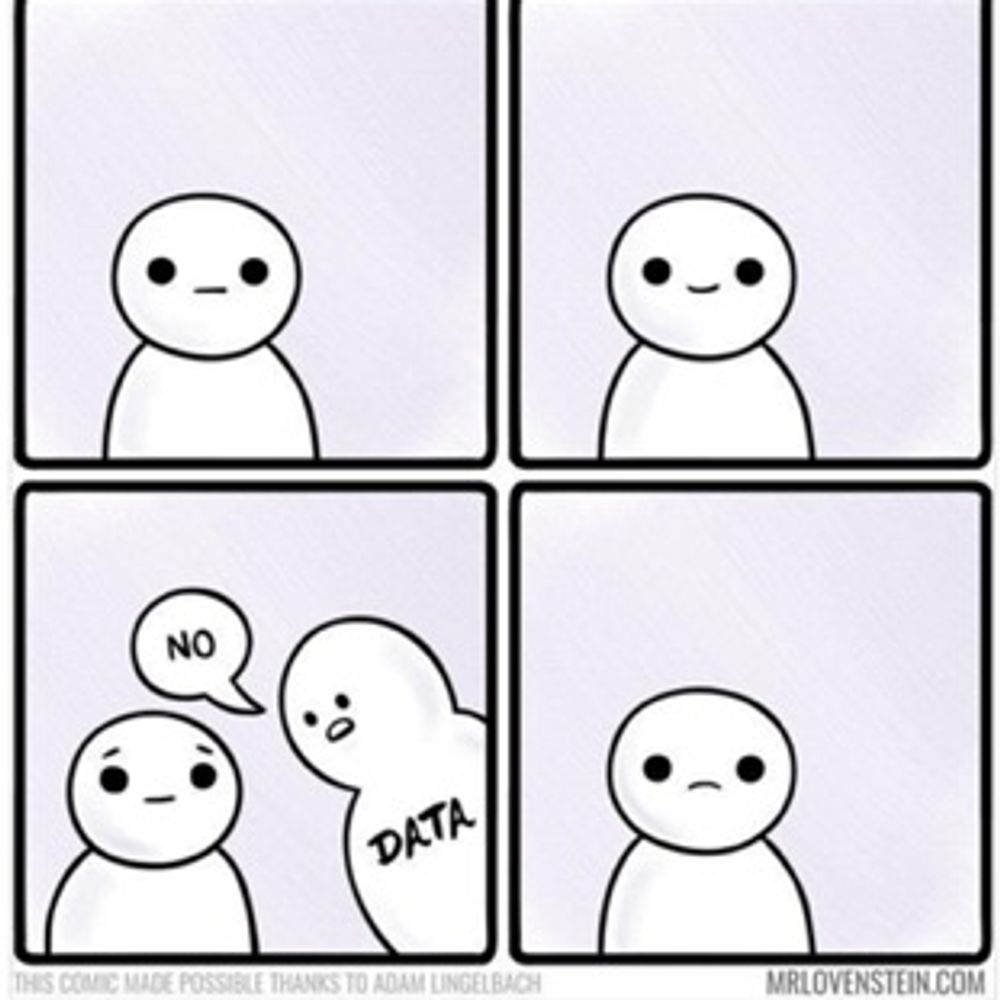
#dataviz folks will also appreciate this one.


December 27, 2025 at 6:59 AM
#dataviz folks will also appreciate this one.
Majestic Xmas floof

December 23, 2025 at 8:15 PM
Majestic Xmas floof
Reposted by T. from Data Rocks

I'm having fun digging into this visualization of attendees of 1994-2014 Tutor/Mentor Conferences that I hosted in #Chicago. I show a few at tutormentor.blogspot.com/2025/12/take... #datavis #dataviz
Thanks to IVMOOC students at Indiana University for creating this.
Thanks to IVMOOC students at Indiana University for creating this.

December 20, 2025 at 3:17 PM
I'm having fun digging into this visualization of attendees of 1994-2014 Tutor/Mentor Conferences that I hosted in #Chicago. I show a few at tutormentor.blogspot.com/2025/12/take... #datavis #dataviz
Thanks to IVMOOC students at Indiana University for creating this.
Thanks to IVMOOC students at Indiana University for creating this.
Reposted by T. from Data Rocks

The archives of the journal Visible Language, which has published interesting articles on #dataviz 📊 in addition to typography, calligraphy, spelling reform, and many other interesting things, are available for free online: journals.uc.edu/index.php/vl...
Archives
| Visible Language
journals.uc.edu
December 20, 2025 at 3:53 AM
The archives of the journal Visible Language, which has published interesting articles on #dataviz 📊 in addition to typography, calligraphy, spelling reform, and many other interesting things, are available for free online: journals.uc.edu/index.php/vl...
Tables are #dataviz too!
HOW COOL IS THIS TABLE?!
The table on the left shows my results for the first three tournaments I've played in Learned League. The green highlights are lightly-rendered bars.
I drew the bars in the table on the right in case you don't see them on the left.
Great way to augment a table.
The table on the left shows my results for the first three tournaments I've played in Learned League. The green highlights are lightly-rendered bars.
I drew the bars in the table on the right in case you don't see them on the left.
Great way to augment a table.

December 19, 2025 at 6:04 PM
Tables are #dataviz too!
This will be GREAT!
I'm really looking forward to chatting with @visualisingdata.com alongside @ansgarw.bsky.social all about the #30DayMapChallenge!
#RStats #DataViz
#RStats #DataViz

Then S6E6 will be a #30DayMapChallenge special with two fantastic guests, @nrennie.bsky.social and @ansgarw.bsky.social, joining me to explore some of their amazing map submissions for this brilliant and unique challenge, which was held during November.
visualisingdata.com/podcast/
visualisingdata.com/podcast/
December 19, 2025 at 12:09 AM
This will be GREAT!
Reposted by T. from Data Rocks

What an amazing way to visualize early human migration. Lovely map by @HarvardCGA. A great colour scheme and an appropriate map projection! Source: buff.ly/3lbxonJ

November 30, 2025 at 10:49 PM
What an amazing way to visualize early human migration. Lovely map by @HarvardCGA. A great colour scheme and an appropriate map projection! Source: buff.ly/3lbxonJ
Reposted by T. from Data Rocks

Rediscovered @unamandita.bsky.social ‘s delightful 2016 article “Everyone’s a Little Bit ‘Shapist’”—featuring a project by Nicky Case—while prepping for a math graphics talk. So good. Great to have an excuse to read it again. www.scientificamerican.com/blog/sa-visu... 📊 #sciart 🧪

Everyone's a Little Bit "Shapist"
On happy little squares, thought experiments and visualizing social systems
www.scientificamerican.com
December 14, 2025 at 7:19 PM
Rediscovered @unamandita.bsky.social ‘s delightful 2016 article “Everyone’s a Little Bit ‘Shapist’”—featuring a project by Nicky Case—while prepping for a math graphics talk. So good. Great to have an excuse to read it again. www.scientificamerican.com/blog/sa-visu... 📊 #sciart 🧪
Reposted by T. from Data Rocks

This week, we celebrate the launch of our new website with a special edition of the Data Vis Dispatch! 🥳
See where you may have come across Datawrapper visualizations before, and have a peek at our brand new website while you're at it. 📊 👀 ✨
www.datawrapper.de/blog/data-vi...
See where you may have come across Datawrapper visualizations before, and have a peek at our brand new website while you're at it. 📊 👀 ✨
www.datawrapper.de/blog/data-vi...


December 16, 2025 at 10:24 PM
This week, we celebrate the launch of our new website with a special edition of the Data Vis Dispatch! 🥳
See where you may have come across Datawrapper visualizations before, and have a peek at our brand new website while you're at it. 📊 👀 ✨
www.datawrapper.de/blog/data-vi...
See where you may have come across Datawrapper visualizations before, and have a peek at our brand new website while you're at it. 📊 👀 ✨
www.datawrapper.de/blog/data-vi...
Reposted by T. from Data Rocks

Folks, here's a link to my newsletter where I express my exasperation with LinkedIn.
Maybe we can get a critical mass of data viz people to agree to put in real effort to make BlueSky social work.
mailchi.mp/b0a153ba5843...
Maybe we can get a critical mass of data viz people to agree to put in real effort to make BlueSky social work.
mailchi.mp/b0a153ba5843...
I'm exasperated with LinkedIn. How about you?
mailchi.mp
December 17, 2025 at 5:18 PM
Folks, here's a link to my newsletter where I express my exasperation with LinkedIn.
Maybe we can get a critical mass of data viz people to agree to put in real effort to make BlueSky social work.
mailchi.mp/b0a153ba5843...
Maybe we can get a critical mass of data viz people to agree to put in real effort to make BlueSky social work.
mailchi.mp/b0a153ba5843...
#dataviz folks,
Let's bring Steve to Bluesky permanently to have fun with us here!
Shoot with your best tips to make the best of Bluesky!
My first one: @chezvoila.com starter pack!
Let's bring Steve to Bluesky permanently to have fun with us here!
Shoot with your best tips to make the best of Bluesky!
My first one: @chezvoila.com starter pack!
Folks, here's a link to my newsletter where I express my exasperation with LinkedIn.
Maybe we can get a critical mass of data viz people to agree to put in real effort to make BlueSky social work.
mailchi.mp/b0a153ba5843...
Maybe we can get a critical mass of data viz people to agree to put in real effort to make BlueSky social work.
mailchi.mp/b0a153ba5843...
I'm exasperated with LinkedIn. How about you?
mailchi.mp
December 17, 2025 at 5:27 PM
#dataviz folks,
Let's bring Steve to Bluesky permanently to have fun with us here!
Shoot with your best tips to make the best of Bluesky!
My first one: @chezvoila.com starter pack!
Let's bring Steve to Bluesky permanently to have fun with us here!
Shoot with your best tips to make the best of Bluesky!
My first one: @chezvoila.com starter pack!
For everyone looking for alternatives: as a very long time Firefox user, I'm now using Waterfox. Seems pretty solid from what I can tell so far.

Mozilla’s new CEO is doubling down on an AI future for Firefox

Mozilla’s new CEO is doubling down on an AI future for Firefox
Anthony Enzor-DeMeo is taking charge of one of the internet’s most important — and most complicated — companies.
buff.ly
December 16, 2025 at 10:19 PM
For everyone looking for alternatives: as a very long time Firefox user, I'm now using Waterfox. Seems pretty solid from what I can tell so far.
Reposted by T. from Data Rocks

Hey folks - if you've tried to sign up to be able to post on the #dataviz feed in the last couple of weeks and haven't seen your posts, sorry about that! I've been preoccupied with some family matters and wasn't checking the sign up sheet. I've gone through and added everyone. Welcome!
Welcome to the 📊 Data Viz feed! This feed is designed to encourage sharing work and all kinds of discussion related to the broad field of data viz.
To participate, you must:
- Include 📊, #dataviz, or #datavis in your post
- Be added to the account list. Sign up here: forms.gle/mcVVczaQCBJL...
To participate, you must:
- Include 📊, #dataviz, or #datavis in your post
- Be added to the account list. Sign up here: forms.gle/mcVVczaQCBJL...
December 12, 2025 at 5:10 PM
Hey folks - if you've tried to sign up to be able to post on the #dataviz feed in the last couple of weeks and haven't seen your posts, sorry about that! I've been preoccupied with some family matters and wasn't checking the sign up sheet. I've gone through and added everyone. Welcome!
Reposted by T. from Data Rocks

This Excel/PowerPoint plug-in is not available for Mac, so I can't use it, but it looks pretty good. 📊

Power-user for PowerPoint, Excel and Word l Advanced charts
Unlock powerful new chart types thanks to Power-user. The add-in will allow you create Waterfall, Mekko, Sankey, Tornado and more to give life to your data.
www.powerusersoftwares.com
December 12, 2025 at 5:14 PM
This Excel/PowerPoint plug-in is not available for Mac, so I can't use it, but it looks pretty good. 📊
Reposted by T. from Data Rocks
Here's a little round up of my 2025 year in #DataViz featuring
💜 Some of my favourite #RStats charts
💜 A look back at 5 years of #TidyTuesday
💜 Links to cool #QuartoPub and visualisation things I've seen this year
Link: nrennie.rbind.io/blog/year-in...
💜 Some of my favourite #RStats charts
💜 A look back at 5 years of #TidyTuesday
💜 Links to cool #QuartoPub and visualisation things I've seen this year
Link: nrennie.rbind.io/blog/year-in...

My year in data visualisation – Nicola Rennie
A round up of my projects this year, highlighting some of my favourite charts from 2025, and looking back on five years of TidyTuesday contributions.
nrennie.rbind.io
December 10, 2025 at 1:41 PM
Here's a little round up of my 2025 year in #DataViz featuring
💜 Some of my favourite #RStats charts
💜 A look back at 5 years of #TidyTuesday
💜 Links to cool #QuartoPub and visualisation things I've seen this year
Link: nrennie.rbind.io/blog/year-in...
💜 Some of my favourite #RStats charts
💜 A look back at 5 years of #TidyTuesday
💜 Links to cool #QuartoPub and visualisation things I've seen this year
Link: nrennie.rbind.io/blog/year-in...
Reposted by T. from Data Rocks
Come join me, @abmakulec.bsky.social, @acotgreave.bsky.social, and Jeffrey Shaffer as we explore some of the highlights (and lowlights) of data visualization in 2025.
Like the BBC News, our goal is to inform, educate, and entertain.
(But without any scandals).
buytickets.at/datarevelati...
Like the BBC News, our goal is to inform, educate, and entertain.
(But without any scandals).
buytickets.at/datarevelati...

December 4, 2025 at 6:25 PM
Come join me, @abmakulec.bsky.social, @acotgreave.bsky.social, and Jeffrey Shaffer as we explore some of the highlights (and lowlights) of data visualization in 2025.
Like the BBC News, our goal is to inform, educate, and entertain.
(But without any scandals).
buytickets.at/datarevelati...
Like the BBC News, our goal is to inform, educate, and entertain.
(But without any scandals).
buytickets.at/datarevelati...
Reposted by T. from Data Rocks
You can now get LIFETIME access to my *updated* Visualizing Survey Data Using Tableau On-Demand course.
Learn more at bigpic.me/course
#surveydata
Learn more at bigpic.me/course
#surveydata
December 4, 2025 at 6:31 PM
You can now get LIFETIME access to my *updated* Visualizing Survey Data Using Tableau On-Demand course.
Learn more at bigpic.me/course
#surveydata
Learn more at bigpic.me/course
#surveydata
Good stuff

Some closing thoughts for my students this semester on LLMs and learning #rstats datavizf25.classes.andrewheiss.com/news/2025-12...


December 10, 2025 at 12:05 AM
Good stuff