


Another map of Scotland for the #30DayMapChallenge, this time with each "cell" contains a circle representing the elevation 🗻
#RStats #ggplot2 #DataViz
#RStats #ggplot2 #DataViz

November 16, 2025 at 11:11 AM
Another map of Scotland for the #30DayMapChallenge, this time with each "cell" contains a circle representing the elevation 🗻
#RStats #ggplot2 #DataViz
#RStats #ggplot2 #DataViz

Warm up this morning was actually hard. Had to walk half of it. But intervals went pretty well.
To be honest, not unhappy that tomorrow is rest day.
To be honest, not unhappy that tomorrow is rest day.


November 16, 2025 at 2:31 PM
Warm up this morning was actually hard. Had to walk half of it. But intervals went pretty well.
To be honest, not unhappy that tomorrow is rest day.
To be honest, not unhappy that tomorrow is rest day.

Sea level is rising, Florida coastal cities are very low elevation; some are already experiencing increased water pressure and sewer systems:
The Water Will Come...
(Jeff Goodell, 2017)
www.goodreads.com/book/show/34...
www.miaminewtimes.com/news/map-for...
The Water Will Come...
(Jeff Goodell, 2017)
www.goodreads.com/book/show/34...
www.miaminewtimes.com/news/map-for...

Will Miami Be a New Atlantis? Map Shows 2050 South Florida Sea Level Rise, Flood Risks
South Florida's future looks soggy as rising sea levels threaten Vizcaya, Belle Meade, and FIU Biscayne Bay by 2050.
www.miaminewtimes.com
November 15, 2025 at 1:26 AM
Sea level is rising, Florida coastal cities are very low elevation; some are already experiencing increased water pressure and sewer systems:
The Water Will Come...
(Jeff Goodell, 2017)
www.goodreads.com/book/show/34...
www.miaminewtimes.com/news/map-for...
The Water Will Come...
(Jeff Goodell, 2017)
www.goodreads.com/book/show/34...
www.miaminewtimes.com/news/map-for...

Day 16 - Cell
Nearest Hill in Rhode Island
The Ocean State is pretty flat, at least to someone who has lived in Appalachia for most of his life. The highest point is 244 ft. I sampled the elevation from a DEM & I mapped the nearest "hill" for anyone looking for a potential view.
#30DayMapChallenge
Nearest Hill in Rhode Island
The Ocean State is pretty flat, at least to someone who has lived in Appalachia for most of his life. The highest point is 244 ft. I sampled the elevation from a DEM & I mapped the nearest "hill" for anyone looking for a potential view.
#30DayMapChallenge

November 16, 2025 at 4:30 PM
Day 16 - Cell
Nearest Hill in Rhode Island
The Ocean State is pretty flat, at least to someone who has lived in Appalachia for most of his life. The highest point is 244 ft. I sampled the elevation from a DEM & I mapped the nearest "hill" for anyone looking for a potential view.
#30DayMapChallenge
Nearest Hill in Rhode Island
The Ocean State is pretty flat, at least to someone who has lived in Appalachia for most of his life. The highest point is 244 ft. I sampled the elevation from a DEM & I mapped the nearest "hill" for anyone looking for a potential view.
#30DayMapChallenge

✈️ Flying into NZ for #FOSS4G @foss4g.org - couldn't help but nerd out on all the beautiful tidal flats that surround Auckland.
Here's a quick #DEAIntertidal tidal flat elevation map of Auckland’s Manukau Harbour, generated using #opensource code + satellite data loaded via #OpenDataCube and #STAC!
Here's a quick #DEAIntertidal tidal flat elevation map of Auckland’s Manukau Harbour, generated using #opensource code + satellite data loaded via #OpenDataCube and #STAC!


November 16, 2025 at 11:45 PM
✈️ Flying into NZ for #FOSS4G @foss4g.org - couldn't help but nerd out on all the beautiful tidal flats that surround Auckland.
Here's a quick #DEAIntertidal tidal flat elevation map of Auckland’s Manukau Harbour, generated using #opensource code + satellite data loaded via #OpenDataCube and #STAC!
Here's a quick #DEAIntertidal tidal flat elevation map of Auckland’s Manukau Harbour, generated using #opensource code + satellite data loaded via #OpenDataCube and #STAC!

#30DayMapChallenge
Day 12: Map from 2125
What if all of Greenland's ice melted?
For today I played around with Greenland’s terrain elevation data beneath the ice sheet.
Note: This visualization doesn’t account for post-glacial rebound or sea-level rise.
Data from nsidc.org/data/idbmg4/...
Day 12: Map from 2125
What if all of Greenland's ice melted?
For today I played around with Greenland’s terrain elevation data beneath the ice sheet.
Note: This visualization doesn’t account for post-glacial rebound or sea-level rise.
Data from nsidc.org/data/idbmg4/...

November 12, 2025 at 2:03 PM
#30DayMapChallenge
Day 12: Map from 2125
What if all of Greenland's ice melted?
For today I played around with Greenland’s terrain elevation data beneath the ice sheet.
Note: This visualization doesn’t account for post-glacial rebound or sea-level rise.
Data from nsidc.org/data/idbmg4/...
Day 12: Map from 2125
What if all of Greenland's ice melted?
For today I played around with Greenland’s terrain elevation data beneath the ice sheet.
Note: This visualization doesn’t account for post-glacial rebound or sea-level rise.
Data from nsidc.org/data/idbmg4/...
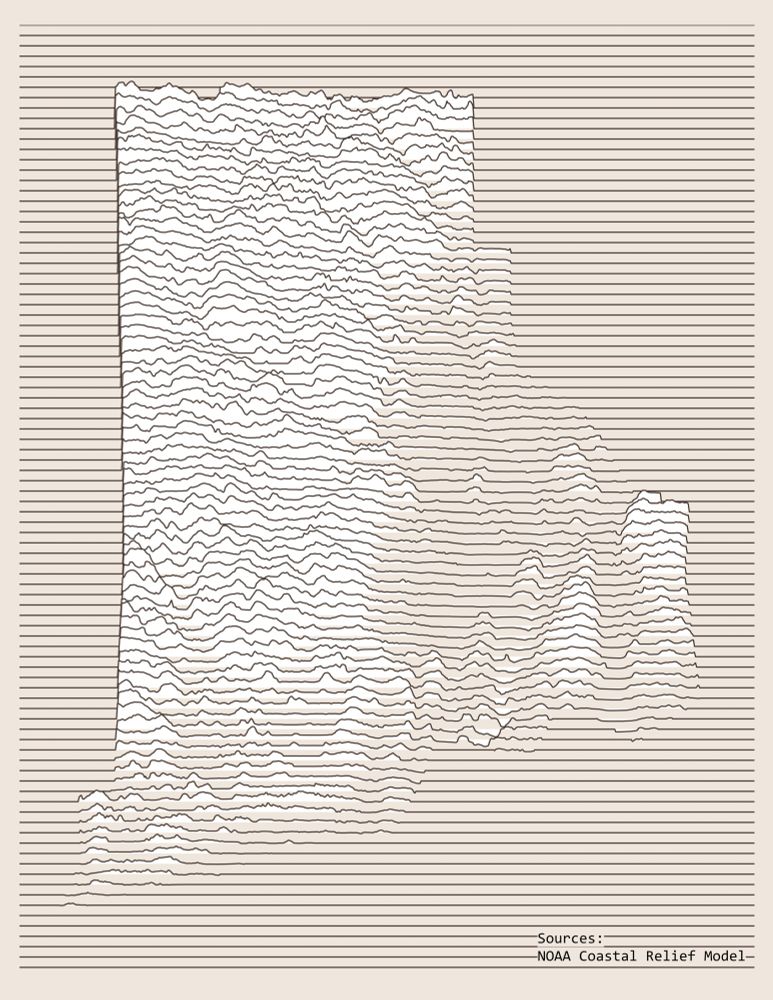
Day 11 - Minimal
Rhode Island Elevation Joy Plot Map
I made a Joy Plot map years ago in ArcPro, but I am using QGIS these days, so I figured this would be a great time to learn a new workflow. I will be posting the workflow on Day 23 - Process.
#30DayMapChallenge
Rhode Island Elevation Joy Plot Map
I made a Joy Plot map years ago in ArcPro, but I am using QGIS these days, so I figured this would be a great time to learn a new workflow. I will be posting the workflow on Day 23 - Process.
#30DayMapChallenge
November 11, 2025 at 3:09 PM
Day 11 - Minimal
Rhode Island Elevation Joy Plot Map
I made a Joy Plot map years ago in ArcPro, but I am using QGIS these days, so I figured this would be a great time to learn a new workflow. I will be posting the workflow on Day 23 - Process.
#30DayMapChallenge
Rhode Island Elevation Joy Plot Map
I made a Joy Plot map years ago in ArcPro, but I am using QGIS these days, so I figured this would be a great time to learn a new workflow. I will be posting the workflow on Day 23 - Process.
#30DayMapChallenge
Another version with Block Island. #30DayMapChallenge

November 11, 2025 at 3:09 PM
Another version with Block Island. #30DayMapChallenge

NEW The Fens of eastern England have been occupied since the Neolithic, but are threatened by environmental change. The Fenscapes project synthesises the region's rich archaeoenvironmental data to support both heritage and environmental preservation.
🆓 doi.org/10.15184/aqy...
🏺 #Archaeology
🆓 doi.org/10.15184/aqy...
🏺 #Archaeology

November 12, 2025 at 10:35 AM
NEW The Fens of eastern England have been occupied since the Neolithic, but are threatened by environmental change. The Fenscapes project synthesises the region's rich archaeoenvironmental data to support both heritage and environmental preservation.
🆓 doi.org/10.15184/aqy...
🏺 #Archaeology
🆓 doi.org/10.15184/aqy...
🏺 #Archaeology

Map Reading Task 328
A straightforward task this week:
Match each contour shape to its corresponding elevation profile.
If I like your answer it doesn't necessarily mean that you are correct!
Video answer for Patreon subscribers this evening.
A straightforward task this week:
Match each contour shape to its corresponding elevation profile.
If I like your answer it doesn't necessarily mean that you are correct!
Video answer for Patreon subscribers this evening.


November 13, 2025 at 7:43 AM
Map Reading Task 328
A straightforward task this week:
Match each contour shape to its corresponding elevation profile.
If I like your answer it doesn't necessarily mean that you are correct!
Video answer for Patreon subscribers this evening.
A straightforward task this week:
Match each contour shape to its corresponding elevation profile.
If I like your answer it doesn't necessarily mean that you are correct!
Video answer for Patreon subscribers this evening.

@cityofoakland.bsky.social has announced a full closure (including bike traffic) for repairs on Tunnel Road tomorrow (Saturday Nov 15) from 7am to 5pm, as well as multiple weekdays through the rest of November. Check out the closure extent & suggested detour here:
felt.com/map/Oakland-...
felt.com/map/Oakland-...

November 14, 2025 at 9:07 PM
@cityofoakland.bsky.social has announced a full closure (including bike traffic) for repairs on Tunnel Road tomorrow (Saturday Nov 15) from 7am to 5pm, as well as multiple weekdays through the rest of November. Check out the closure extent & suggested detour here:
felt.com/map/Oakland-...
felt.com/map/Oakland-...
NEW During the last Ice Age, the inhospitable highlands of modern Spain were thought to be uninhabitable, abandoned for the coasts. New research finds evidence for Upper Palaeolithic occupation in the harsh Iberian Meseta, questioning this idea.
🆓 doi.org/10.15184/aqy...
🏺 #Archaeology
🆓 doi.org/10.15184/aqy...
🏺 #Archaeology

November 11, 2025 at 8:15 AM
NEW During the last Ice Age, the inhospitable highlands of modern Spain were thought to be uninhabitable, abandoned for the coasts. New research finds evidence for Upper Palaeolithic occupation in the harsh Iberian Meseta, questioning this idea.
🆓 doi.org/10.15184/aqy...
🏺 #Archaeology
🆓 doi.org/10.15184/aqy...
🏺 #Archaeology

#5KADay 522 #running 6.5k yesterday, with 6k captured as continuous 6’21” pace. Shoes are getting slicker so missing the replacement window for using current 👟on rain days & will have to use the bad gts glycerins. Super stressed with sick 🐶 & late shoe arrival/replacement #runchat #runsky


November 12, 2025 at 4:18 PM
#5KADay 521 #running Monday was 10.1k in ~ 1:07:11, 73F, with a long water break at ~ 51 mins. Goals were, continuous 10k & 70 mins running but too darn hot & burning arm. The body glide doesn’t stay put so new burn abrasion under arm. Knees stiff after break but warmed up again. #Runchat #Runsky


November 11, 2025 at 3:38 PM

Hihi, thanks for the artshare!
I'm Vihala, and I like to think of myself as mostly a TTRPG artist! But if I'm being so for real I draw whatever bullshit crops in my head, which is usually my OCs
I'm Vihala, and I like to think of myself as mostly a TTRPG artist! But if I'm being so for real I draw whatever bullshit crops in my head, which is usually my OCs


November 17, 2025 at 5:49 PM
Hihi, thanks for the artshare!
I'm Vihala, and I like to think of myself as mostly a TTRPG artist! But if I'm being so for real I draw whatever bullshit crops in my head, which is usually my OCs
I'm Vihala, and I like to think of myself as mostly a TTRPG artist! But if I'm being so for real I draw whatever bullshit crops in my head, which is usually my OCs

3D Tanaka contour map of Scotland with #rayshader for Day 6 of the #30DayMapChallenge - Dimensions.
Code: github.com/rajodm/30Day...
Thanks @milos-makes-maps.bsky.social for the helpful tutorial!
#dataviz #rstats #ggplot2
Code: github.com/rajodm/30Day...
Thanks @milos-makes-maps.bsky.social for the helpful tutorial!
#dataviz #rstats #ggplot2

November 7, 2025 at 10:40 AM
3D Tanaka contour map of Scotland with #rayshader for Day 6 of the #30DayMapChallenge - Dimensions.
Code: github.com/rajodm/30Day...
Thanks @milos-makes-maps.bsky.social for the helpful tutorial!
#dataviz #rstats #ggplot2
Code: github.com/rajodm/30Day...
Thanks @milos-makes-maps.bsky.social for the helpful tutorial!
#dataviz #rstats #ggplot2

Day 6 of the #30DayMapChallenge makes things 3D! I took my elevation map from yesterday and made it so with the {rayshader} package.
#DataViz #RStats #ggplot2
#DataViz #RStats #ggplot2

November 7, 2025 at 1:08 AM
Day 6 of the #30DayMapChallenge makes things 3D! I took my elevation map from yesterday and made it so with the {rayshader} package.
#DataViz #RStats #ggplot2
#DataViz #RStats #ggplot2
Also getting off lucky - Middlesborough. In reality maxing out at 25m elevation. On this map getting transported deep into the North York Moors.
November 8, 2025 at 11:58 PM
Also getting off lucky - Middlesborough. In reality maxing out at 25m elevation. On this map getting transported deep into the North York Moors.

This elevation map of Nepal reveals the absurd range from the lowest point (59m) to the highest point (8848m). Source: buff.ly/NU3L634

November 5, 2025 at 6:04 PM
This elevation map of Nepal reveals the absurd range from the lowest point (59m) to the highest point (8848m). Source: buff.ly/NU3L634

#30DayMapChallenge Day 6: Dimensions Today’s map is a #3d view of Algiers using #qgis. Elevation = evapotranspiration! I used a #fao #wapor L1 AETI image from 2008 as the elevation model, draped with Google Satellite imagery. Vegetated/agricultural zones rise […]
[Original post on fosstodon.org]
[Original post on fosstodon.org]
November 6, 2025 at 6:16 PM
#30DayMapChallenge Day 6: Dimensions Today’s map is a #3d view of Algiers using #qgis. Elevation = evapotranspiration! I used a #fao #wapor L1 AETI image from 2008 as the elevation model, draped with Google Satellite imagery. Vegetated/agricultural zones rise […]
[Original post on fosstodon.org]
[Original post on fosstodon.org]

Lighthouse Marathon ✅
- 14 miles on brutal coast paths,
- 8 miles on road / trail,
- 4 ish miles on dunes.
Over 1,000m of elevation gain.
Slipped down a bank on mile 5. Stacked it coming into St Ives on mile 13.
Perfect weather and fantastic scenery
- 14 miles on brutal coast paths,
- 8 miles on road / trail,
- 4 ish miles on dunes.
Over 1,000m of elevation gain.
Slipped down a bank on mile 5. Stacked it coming into St Ives on mile 13.
Perfect weather and fantastic scenery


November 9, 2025 at 8:43 AM
Lighthouse Marathon ✅
- 14 miles on brutal coast paths,
- 8 miles on road / trail,
- 4 ish miles on dunes.
Over 1,000m of elevation gain.
Slipped down a bank on mile 5. Stacked it coming into St Ives on mile 13.
Perfect weather and fantastic scenery
- 14 miles on brutal coast paths,
- 8 miles on road / trail,
- 4 ish miles on dunes.
Over 1,000m of elevation gain.
Slipped down a bank on mile 5. Stacked it coming into St Ives on mile 13.
Perfect weather and fantastic scenery

#30DayMapChallenge | Day 5 - Earth
For today's challenge, I transformed a 1963 map from Venezuela's former Ministry of Public Works by incorporating the corresponding elevation and terrain data.
Tools: QGIS and Blender
For today's challenge, I transformed a 1963 map from Venezuela's former Ministry of Public Works by incorporating the corresponding elevation and terrain data.
Tools: QGIS and Blender


November 6, 2025 at 1:31 AM
#30DayMapChallenge | Day 5 - Earth
For today's challenge, I transformed a 1963 map from Venezuela's former Ministry of Public Works by incorporating the corresponding elevation and terrain data.
Tools: QGIS and Blender
For today's challenge, I transformed a 1963 map from Venezuela's former Ministry of Public Works by incorporating the corresponding elevation and terrain data.
Tools: QGIS and Blender

#30DayMapChallenge 🗺️ Day 5️⃣: Earth
Here’s a minimal isometric relief map of Santorini. I haven’t been to #Greece 🇬🇷 but I definitely want to see Athens, and either Santorini or Mykonos. Maybe I hope that by creating this map I can manifest that trip? 😁
Digital elevation model data is from NASADEM.
Here’s a minimal isometric relief map of Santorini. I haven’t been to #Greece 🇬🇷 but I definitely want to see Athens, and either Santorini or Mykonos. Maybe I hope that by creating this map I can manifest that trip? 😁
Digital elevation model data is from NASADEM.

November 6, 2025 at 9:07 AM
#30DayMapChallenge 🗺️ Day 5️⃣: Earth
Here’s a minimal isometric relief map of Santorini. I haven’t been to #Greece 🇬🇷 but I definitely want to see Athens, and either Santorini or Mykonos. Maybe I hope that by creating this map I can manifest that trip? 😁
Digital elevation model data is from NASADEM.
Here’s a minimal isometric relief map of Santorini. I haven’t been to #Greece 🇬🇷 but I definitely want to see Athens, and either Santorini or Mykonos. Maybe I hope that by creating this map I can manifest that trip? 😁
Digital elevation model data is from NASADEM.

#30daymapchallenge | Day 6 Dimensions | Unrealized Heights
Still tinkering with this one, but here’s unbuilt volume for large buildings within 1 mile of the Capitol, where the Capitol View Preservation Ordinance restricts buildings from exceeding the elevation of the base of the Capitol’s columns.
Still tinkering with this one, but here’s unbuilt volume for large buildings within 1 mile of the Capitol, where the Capitol View Preservation Ordinance restricts buildings from exceeding the elevation of the base of the Capitol’s columns.

November 6, 2025 at 1:46 PM
#30daymapchallenge | Day 6 Dimensions | Unrealized Heights
Still tinkering with this one, but here’s unbuilt volume for large buildings within 1 mile of the Capitol, where the Capitol View Preservation Ordinance restricts buildings from exceeding the elevation of the base of the Capitol’s columns.
Still tinkering with this one, but here’s unbuilt volume for large buildings within 1 mile of the Capitol, where the Capitol View Preservation Ordinance restricts buildings from exceeding the elevation of the base of the Capitol’s columns.

#30DayMapChallenge Day 6: Dimensions Today’s map is a #3D view of Algiers using #QGIS. Elevation = evapotranspiration! I used a #FAO #WaPOR L1 AETI image from 2008 as the elevation model, draped with Google Satellite imagery. Vegetated/agricultural zones rise above urban areas. #GIS #RemoteSensing


November 6, 2025 at 6:17 PM
#30DayMapChallenge Day 6: Dimensions Today’s map is a #3D view of Algiers using #QGIS. Elevation = evapotranspiration! I used a #FAO #WaPOR L1 AETI image from 2008 as the elevation model, draped with Google Satellite imagery. Vegetated/agricultural zones rise above urban areas. #GIS #RemoteSensing