


Hans van der Kwast
@qwast-gis.com
Associate Prof. #ihedelft | Physical Geographer | Owner of QWAST-GIS | #OpenSource advocacy | board member @qgis.nl | #gisocw | #OSGeo Charter Member | #QGIS
Pinned
Hans van der Kwast
@qwast-gis.com
· Jan 29

🎉 I've reached a milestone! My YouTube channel hit 30,000 subscribers! Thanks to all for your support! Can't wait to bring you more great content on #OpenSource #GIS. Stay tuned! #QGIS #Python #PCRaster
www.youtube.com/c/hansvander...
www.youtube.com/c/hansvander...
🎉 New year, new #GIS skills!
⌨️ Learn scripting in #QGIS with my free course at @gisopencourseware.bsky.social: no complex setup, just start from QGIS.
Topics:
#GDAL #CLI
#Python basics
#PyQGIS with the Notebook plugin ✨
👉 courses.gisopencourseware.org/course/view....
⌨️ Learn scripting in #QGIS with my free course at @gisopencourseware.bsky.social: no complex setup, just start from QGIS.
Topics:
#GDAL #CLI
#Python basics
#PyQGIS with the Notebook plugin ✨
👉 courses.gisopencourseware.org/course/view....

January 7, 2026 at 4:26 PM
🎉 New year, new #GIS skills!
⌨️ Learn scripting in #QGIS with my free course at @gisopencourseware.bsky.social: no complex setup, just start from QGIS.
Topics:
#GDAL #CLI
#Python basics
#PyQGIS with the Notebook plugin ✨
👉 courses.gisopencourseware.org/course/view....
⌨️ Learn scripting in #QGIS with my free course at @gisopencourseware.bsky.social: no complex setup, just start from QGIS.
Topics:
#GDAL #CLI
#Python basics
#PyQGIS with the Notebook plugin ✨
👉 courses.gisopencourseware.org/course/view....
Reposted by Hans van der Kwast

NASA Earthdata QGIS Plugin v0.2.0 has been released!
It now supports highlighting selected footprints and clearing search results without resetting other settings.
Use the plugin update checker to update the plugin to the latest verion with a simple click.
It now supports highlighting selected footprints and clearing search results without resetting other settings.
Use the plugin update checker to update the plugin to the latest verion with a simple click.

January 7, 2026 at 4:01 PM
NASA Earthdata QGIS Plugin v0.2.0 has been released!
It now supports highlighting selected footprints and clearing search results without resetting other settings.
Use the plugin update checker to update the plugin to the latest verion with a simple click.
It now supports highlighting selected footprints and clearing search results without resetting other settings.
Use the plugin update checker to update the plugin to the latest verion with a simple click.
Reposted by Hans van der Kwast
Compare Layers Visually in QGIS — New Leafmap Plugin Demo!
Whether you're working with raster or vector data, this tool brings interactive transparency controls and a layer swipe feature right into your QGIS environment.
Whether you're working with raster or vector data, this tool brings interactive transparency controls and a layer swipe feature right into your QGIS environment.
December 30, 2025 at 2:24 PM
Compare Layers Visually in QGIS — New Leafmap Plugin Demo!
Whether you're working with raster or vector data, this tool brings interactive transparency controls and a layer swipe feature right into your QGIS environment.
Whether you're working with raster or vector data, this tool brings interactive transparency controls and a layer swipe feature right into your QGIS environment.
In 2025 I issued 146 official #QGIS certificates via #IHEDelft & #QWAST 🎉
Each adds €20 to QGIS ➡️ €2,920 raised!
Explore trusted learning paths:
🔸 QGIS Certifying orgs: certification.qgis.org/en/
🔸 IHE Delft: www.un-ihe.org/education
🔸 QWAST: www.qwast-gis.com/courses/
#GIS #LifeLongLearning
Each adds €20 to QGIS ➡️ €2,920 raised!
Explore trusted learning paths:
🔸 QGIS Certifying orgs: certification.qgis.org/en/
🔸 IHE Delft: www.un-ihe.org/education
🔸 QWAST: www.qwast-gis.com/courses/
#GIS #LifeLongLearning

December 30, 2025 at 9:16 AM
In 2025 I issued 146 official #QGIS certificates via #IHEDelft & #QWAST 🎉
Each adds €20 to QGIS ➡️ €2,920 raised!
Explore trusted learning paths:
🔸 QGIS Certifying orgs: certification.qgis.org/en/
🔸 IHE Delft: www.un-ihe.org/education
🔸 QWAST: www.qwast-gis.com/courses/
#GIS #LifeLongLearning
Each adds €20 to QGIS ➡️ €2,920 raised!
Explore trusted learning paths:
🔸 QGIS Certifying orgs: certification.qgis.org/en/
🔸 IHE Delft: www.un-ihe.org/education
🔸 QWAST: www.qwast-gis.com/courses/
#GIS #LifeLongLearning
Reposted by Hans van der Kwast
The QGIS Notebook Plugin v0.2.0 is now available! 🎉
New features:
🌟 Light theme for a fresh look
✂️ Clear outputs for selected cells
➕ Insert code snippets directly into your notebooks
New features:
🌟 Light theme for a fresh look
✂️ Clear outputs for selected cells
➕ Insert code snippets directly into your notebooks

December 29, 2025 at 3:17 PM
The QGIS Notebook Plugin v0.2.0 is now available! 🎉
New features:
🌟 Light theme for a fresh look
✂️ Clear outputs for selected cells
➕ Insert code snippets directly into your notebooks
New features:
🌟 Light theme for a fresh look
✂️ Clear outputs for selected cells
➕ Insert code snippets directly into your notebooks
Reposted by Hans van der Kwast
🚀 Run Jupyter Notebooks Directly Inside QGIS! | QGIS Notebook Plugin Tutorial
Want to combine the power of QGIS with the flexibility of Jupyter Notebooks? In this step-by-step tutorial, you'll learn how to install and use the QGIS Notebook Plugin to run Jupyter Notebooks inside the QGIS interface.
Want to combine the power of QGIS with the flexibility of Jupyter Notebooks? In this step-by-step tutorial, you'll learn how to install and use the QGIS Notebook Plugin to run Jupyter Notebooks inside the QGIS interface.

December 26, 2025 at 3:39 PM
🚀 Run Jupyter Notebooks Directly Inside QGIS! | QGIS Notebook Plugin Tutorial
Want to combine the power of QGIS with the flexibility of Jupyter Notebooks? In this step-by-step tutorial, you'll learn how to install and use the QGIS Notebook Plugin to run Jupyter Notebooks inside the QGIS interface.
Want to combine the power of QGIS with the flexibility of Jupyter Notebooks? In this step-by-step tutorial, you'll learn how to install and use the QGIS Notebook Plugin to run Jupyter Notebooks inside the QGIS interface.
Reposted by Hans van der Kwast

Wij wensen iedereen fijne feestdagen en een nieuw jaar vol creativiteit en samenwerking!🎄✨️
🥂Op 18 januari organiseren we de jaarlijkse nieuwjaarsborrel i.s.m. #OSGeoNL & #OpenStreetMapNL. Je bent vanaf 14 uur welkom in De Kargadoor, Utrecht. 🔗Aanmelden: pretix.eu/foss4gnl/nie...
🥂Op 18 januari organiseren we de jaarlijkse nieuwjaarsborrel i.s.m. #OSGeoNL & #OpenStreetMapNL. Je bent vanaf 14 uur welkom in De Kargadoor, Utrecht. 🔗Aanmelden: pretix.eu/foss4gnl/nie...

December 23, 2025 at 11:02 AM
Wij wensen iedereen fijne feestdagen en een nieuw jaar vol creativiteit en samenwerking!🎄✨️
🥂Op 18 januari organiseren we de jaarlijkse nieuwjaarsborrel i.s.m. #OSGeoNL & #OpenStreetMapNL. Je bent vanaf 14 uur welkom in De Kargadoor, Utrecht. 🔗Aanmelden: pretix.eu/foss4gnl/nie...
🥂Op 18 januari organiseren we de jaarlijkse nieuwjaarsborrel i.s.m. #OSGeoNL & #OpenStreetMapNL. Je bent vanaf 14 uur welkom in De Kargadoor, Utrecht. 🔗Aanmelden: pretix.eu/foss4gnl/nie...
Reposted by Hans van der Kwast
Net voor de kerstvakantie gaf #QGISNL een inspirerende workshop op het #GoeseLyceum! 👩💻
Samen met @dirkvoets.bsky.social werkten leerlingen van het #Technasium met #QGIS en maakten een opdracht over #klimaatverandering. Technator Hans Braakman verwacht QGIS vaker in te zetten. 🚀
#GISOnderiwijs
Samen met @dirkvoets.bsky.social werkten leerlingen van het #Technasium met #QGIS en maakten een opdracht over #klimaatverandering. Technator Hans Braakman verwacht QGIS vaker in te zetten. 🚀
#GISOnderiwijs


December 23, 2025 at 9:47 AM
Net voor de kerstvakantie gaf #QGISNL een inspirerende workshop op het #GoeseLyceum! 👩💻
Samen met @dirkvoets.bsky.social werkten leerlingen van het #Technasium met #QGIS en maakten een opdracht over #klimaatverandering. Technator Hans Braakman verwacht QGIS vaker in te zetten. 🚀
#GISOnderiwijs
Samen met @dirkvoets.bsky.social werkten leerlingen van het #Technasium met #QGIS en maakten een opdracht over #klimaatverandering. Technator Hans Braakman verwacht QGIS vaker in te zetten. 🚀
#GISOnderiwijs
🎥 Just released a new video exploring the #QGIS #GeoAI plugin, a powerful way to bring #AI into everyday mapping workflows. Watch here: youtu.be/PMEZaW71YSA
Thanks to @giswqs.bsky.social for his brilliant work and clear documentation!
Thanks to @giswqs.bsky.social for his brilliant work and clear documentation!

Review of the QGIS GeoAI plugin
YouTube video by Hans van der Kwast
youtu.be
December 21, 2025 at 4:41 PM
🎥 Just released a new video exploring the #QGIS #GeoAI plugin, a powerful way to bring #AI into everyday mapping workflows. Watch here: youtu.be/PMEZaW71YSA
Thanks to @giswqs.bsky.social for his brilliant work and clear documentation!
Thanks to @giswqs.bsky.social for his brilliant work and clear documentation!


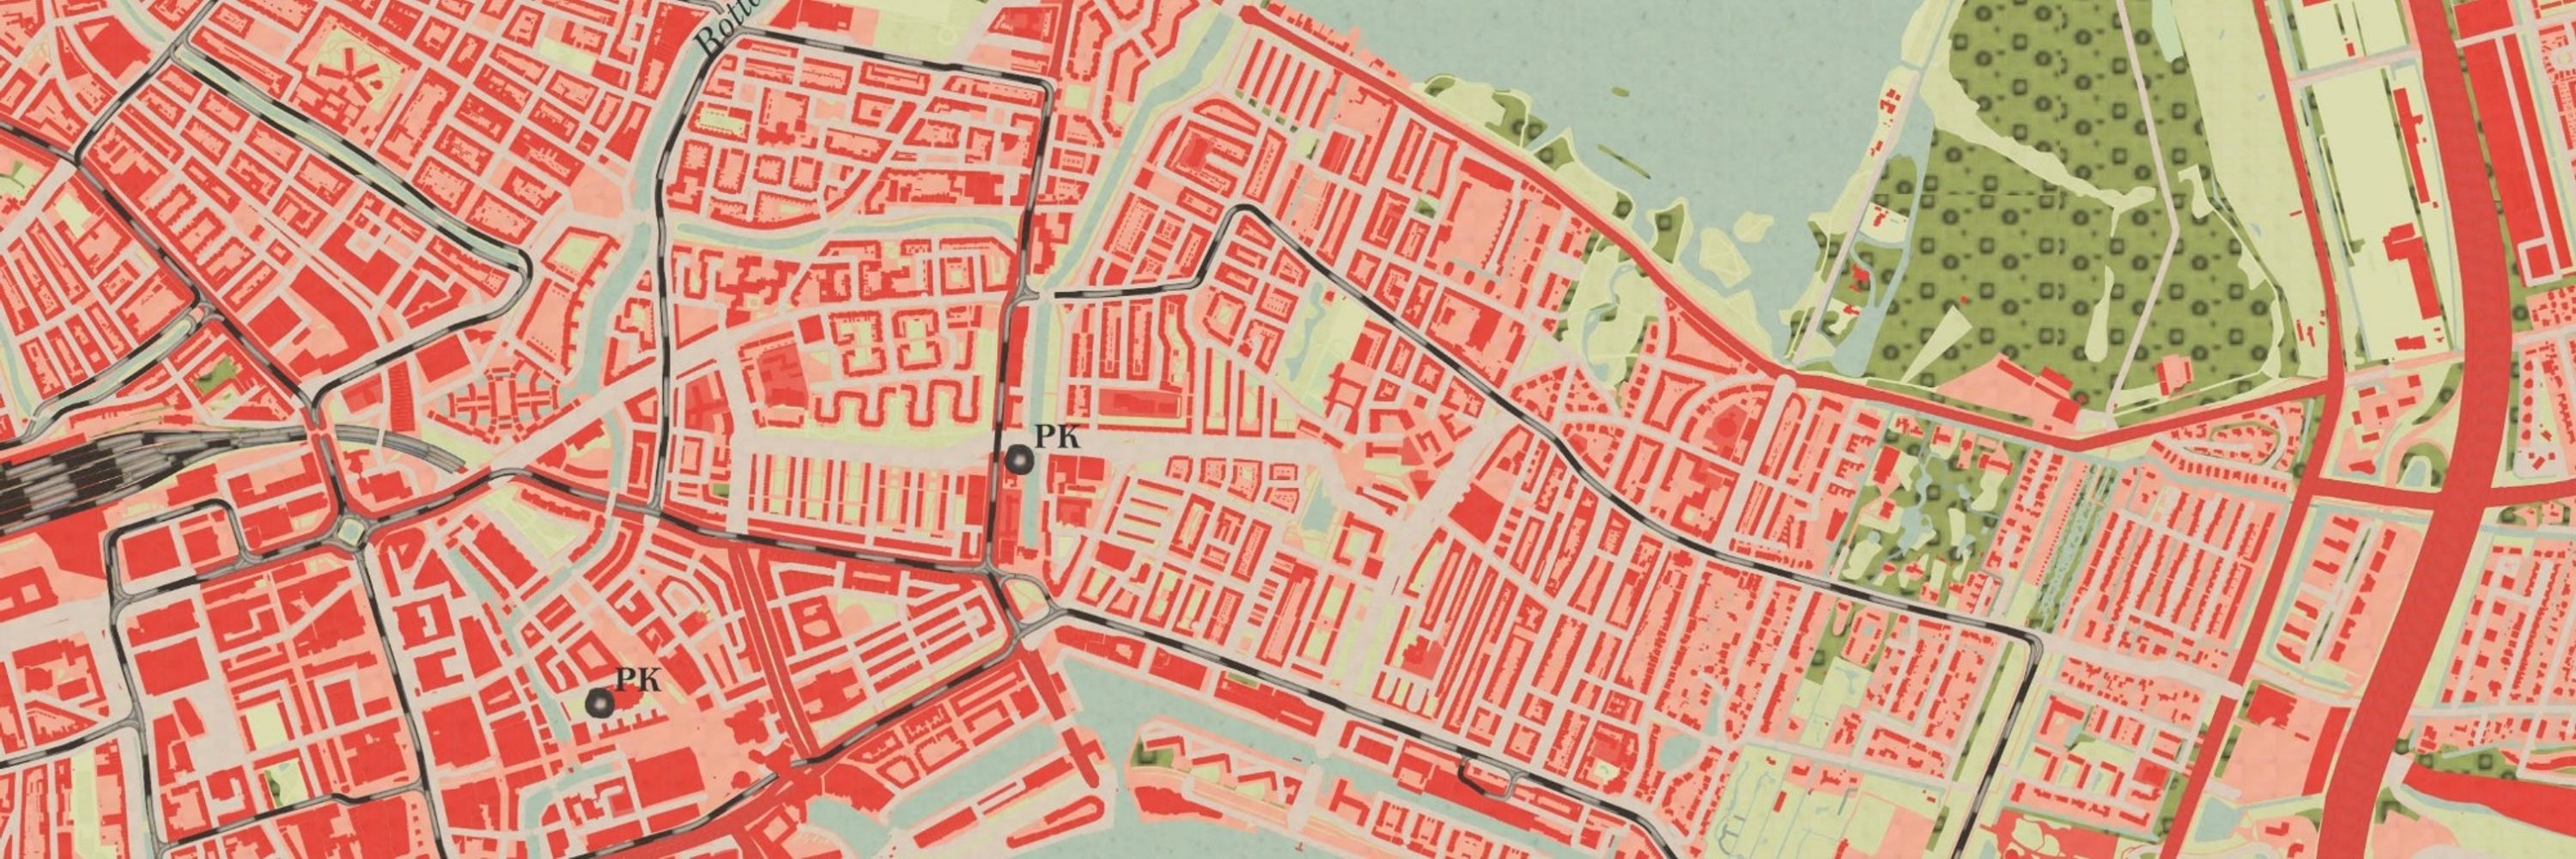
The new Base Map of Green & Paved Surfaces for the Netherlands shows, at 25 cm resolution, how every raindrop meets its environment. From tree canopy to pavement. It's available in the Climate Impact Atlas. #Friedenau #CAS
👉Read my blog for more info: www.qwast-gis.com/l/how-green-...
👉Read my blog for more info: www.qwast-gis.com/l/how-green-...

How Green is the Netherlands? A New Map Reveals the Details :: QWAST-GIS
The Netherlands is striving to become greener, but where do you start if you don't know exactly how much greenery is already in place? A newly updated Base Map of Green and Paved Surfaces in the Clima...
www.qwast-gis.com
December 18, 2025 at 6:45 AM
The new Base Map of Green & Paved Surfaces for the Netherlands shows, at 25 cm resolution, how every raindrop meets its environment. From tree canopy to pavement. It's available in the Climate Impact Atlas. #Friedenau #CAS
👉Read my blog for more info: www.qwast-gis.com/l/how-green-...
👉Read my blog for more info: www.qwast-gis.com/l/how-green-...
I was interviewed about a great new #opendata #gis layer on imperviousness in the Netherlands developed by #Friedenau Society for #KlimaatEffectAtlas. Read here: klimaatadaptatienederland.nl/actueel/actu...

December 15, 2025 at 10:23 AM
I was interviewed about a great new #opendata #gis layer on imperviousness in the Netherlands developed by #Friedenau Society for #KlimaatEffectAtlas. Read here: klimaatadaptatienederland.nl/actueel/actu...
This year's #30DayMapChallenge was a bit challenging due to my activities in November: 9 concerts, teaching, trips to Algeria and Morocco... Read the new blog on the #QWAST website on how I made each map. www.qwast-gis.com/l/30daymapch...

December 8, 2025 at 8:49 AM
This year's #30DayMapChallenge was a bit challenging due to my activities in November: 9 concerts, teaching, trips to Algeria and Morocco... Read the new blog on the #QWAST website on how I made each map. www.qwast-gis.com/l/30daymapch...
#30DayMapChallenge Day 30 – Makeover
Traveling today to Marrakech 🇲🇦 for a water trade mission, so I kept it simple. I revisited my Day 2 map and turned the Schie, Coolsingel & Goudsesingel back into water bodies 💧.
Stronger blue infrastructure = better climate adaptation.
Traveling today to Marrakech 🇲🇦 for a water trade mission, so I kept it simple. I revisited my Day 2 map and turned the Schie, Coolsingel & Goudsesingel back into water bodies 💧.
Stronger blue infrastructure = better climate adaptation.

November 30, 2025 at 5:04 AM
#30DayMapChallenge Day 30 – Makeover
Traveling today to Marrakech 🇲🇦 for a water trade mission, so I kept it simple. I revisited my Day 2 map and turned the Schie, Coolsingel & Goudsesingel back into water bodies 💧.
Stronger blue infrastructure = better climate adaptation.
Traveling today to Marrakech 🇲🇦 for a water trade mission, so I kept it simple. I revisited my Day 2 map and turned the Schie, Coolsingel & Goudsesingel back into water bodies 💧.
Stronger blue infrastructure = better climate adaptation.
#30DayMapChallenge Day 29: Raster
#LiDAR DSMs often leave nodata voids at water bodies, breaking shadow modeling. For Rotterdam, I used the 0.5 m AHN4 DSM and filled gaps with my #QGIS script from the Resources Hub 👉 hub.qgis.org/scripts/4 (install via QGIS Hub plugin).
🎦 youtu.be/79yFgVLvuZM
#LiDAR DSMs often leave nodata voids at water bodies, breaking shadow modeling. For Rotterdam, I used the 0.5 m AHN4 DSM and filled gaps with my #QGIS script from the Resources Hub 👉 hub.qgis.org/scripts/4 (install via QGIS Hub plugin).
🎦 youtu.be/79yFgVLvuZM

November 29, 2025 at 8:51 AM
#30DayMapChallenge Day 29: Raster
#LiDAR DSMs often leave nodata voids at water bodies, breaking shadow modeling. For Rotterdam, I used the 0.5 m AHN4 DSM and filled gaps with my #QGIS script from the Resources Hub 👉 hub.qgis.org/scripts/4 (install via QGIS Hub plugin).
🎦 youtu.be/79yFgVLvuZM
#LiDAR DSMs often leave nodata voids at water bodies, breaking shadow modeling. For Rotterdam, I used the 0.5 m AHN4 DSM and filled gaps with my #QGIS script from the Resources Hub 👉 hub.qgis.org/scripts/4 (install via QGIS Hub plugin).
🎦 youtu.be/79yFgVLvuZM
#30DayMapChallenge Day 28: Black
On this Black Friday, I found today’s theme in the depths of the Black Sea.
Using the @opentopography.org DEM Downloader, I grabbed the Global Bathymetry SRTM15+ V2.1 dataset, calculated 100 m contours, and applied the Tanaka method with a style from the #QGIS Hub.
On this Black Friday, I found today’s theme in the depths of the Black Sea.
Using the @opentopography.org DEM Downloader, I grabbed the Global Bathymetry SRTM15+ V2.1 dataset, calculated 100 m contours, and applied the Tanaka method with a style from the #QGIS Hub.

November 28, 2025 at 4:45 PM
#30DayMapChallenge Day 28: Black
On this Black Friday, I found today’s theme in the depths of the Black Sea.
Using the @opentopography.org DEM Downloader, I grabbed the Global Bathymetry SRTM15+ V2.1 dataset, calculated 100 m contours, and applied the Tanaka method with a style from the #QGIS Hub.
On this Black Friday, I found today’s theme in the depths of the Black Sea.
Using the @opentopography.org DEM Downloader, I grabbed the Global Bathymetry SRTM15+ V2.1 dataset, calculated 100 m contours, and applied the Tanaka method with a style from the #QGIS Hub.
#30DayMapChallenge Day 27: Boundaries
Mapped the world’s transboundary aquifers (IGRAC 2025). These underground reserves cross borders, showing water connecting us beyond geopolitics.
💧 Shared responsibility, shared future.
#GIS #QGIS #WaterDiplomacy
Mapped the world’s transboundary aquifers (IGRAC 2025). These underground reserves cross borders, showing water connecting us beyond geopolitics.
💧 Shared responsibility, shared future.
#GIS #QGIS #WaterDiplomacy

November 27, 2025 at 9:14 PM
#30DayMapChallenge Day 27: Boundaries
Mapped the world’s transboundary aquifers (IGRAC 2025). These underground reserves cross borders, showing water connecting us beyond geopolitics.
💧 Shared responsibility, shared future.
#GIS #QGIS #WaterDiplomacy
Mapped the world’s transboundary aquifers (IGRAC 2025). These underground reserves cross borders, showing water connecting us beyond geopolitics.
💧 Shared responsibility, shared future.
#GIS #QGIS #WaterDiplomacy
#30DayMapChallenge Day 26: Transport 🚇
Still in Algeria, so I kept it simple: vector tiles via @maptiler.bsky.social + #OpenStreetMap in #QGIS to show public transport in Algiers.
The Algiers Metro is Africa’s 2nd metro after Cairo, opened in 2011.
Still in Algeria, so I kept it simple: vector tiles via @maptiler.bsky.social + #OpenStreetMap in #QGIS to show public transport in Algiers.
The Algiers Metro is Africa’s 2nd metro after Cairo, opened in 2011.

November 26, 2025 at 12:29 PM
#30DayMapChallenge Day 26: Transport 🚇
Still in Algeria, so I kept it simple: vector tiles via @maptiler.bsky.social + #OpenStreetMap in #QGIS to show public transport in Algiers.
The Algiers Metro is Africa’s 2nd metro after Cairo, opened in 2011.
Still in Algeria, so I kept it simple: vector tiles via @maptiler.bsky.social + #OpenStreetMap in #QGIS to show public transport in Algiers.
The Algiers Metro is Africa’s 2nd metro after Cairo, opened in 2011.
#30DayMapChallenge Day 25: Hexagons
Busy with a water seminar organised by the Dutch embassy in Algiers, I had little time to map. So I turned to the HDX dataset of 400 m H3 hexagons and plotted the population density of the Netherlands in 2023.
#GIS #QGIS #Cartography #OpenData
Busy with a water seminar organised by the Dutch embassy in Algiers, I had little time to map. So I turned to the HDX dataset of 400 m H3 hexagons and plotted the population density of the Netherlands in 2023.
#GIS #QGIS #Cartography #OpenData

November 25, 2025 at 10:08 PM
#30DayMapChallenge Day 25: Hexagons
Busy with a water seminar organised by the Dutch embassy in Algiers, I had little time to map. So I turned to the HDX dataset of 400 m H3 hexagons and plotted the population density of the Netherlands in 2023.
#GIS #QGIS #Cartography #OpenData
Busy with a water seminar organised by the Dutch embassy in Algiers, I had little time to map. So I turned to the HDX dataset of 400 m H3 hexagons and plotted the population density of the Netherlands in 2023.
#GIS #QGIS #Cartography #OpenData
#30DayMapChallenge Day 24: Places and their names
I mapped toponyms linked to medieval cope contracts: agreements that allowed settlers to drain and farm peatlands.
Names ending in ‑cop, ‑koop, ‑kop all trace back to this hostory. The naming tradition even spread to northern Germany and Poland.
I mapped toponyms linked to medieval cope contracts: agreements that allowed settlers to drain and farm peatlands.
Names ending in ‑cop, ‑koop, ‑kop all trace back to this hostory. The naming tradition even spread to northern Germany and Poland.

November 24, 2025 at 3:56 PM
#30DayMapChallenge Day 24: Places and their names
I mapped toponyms linked to medieval cope contracts: agreements that allowed settlers to drain and farm peatlands.
Names ending in ‑cop, ‑koop, ‑kop all trace back to this hostory. The naming tradition even spread to northern Germany and Poland.
I mapped toponyms linked to medieval cope contracts: agreements that allowed settlers to drain and farm peatlands.
Names ending in ‑cop, ‑koop, ‑kop all trace back to this hostory. The naming tradition even spread to northern Germany and Poland.
#30DayMapChallenge, day 23: Process
Flow directions in the French Alpes with a 5 m RGEALTI DTM (IGN France). Using #QGIS’s new native Fill Sinks (Wang & Liu), I calculated flow directions, converted them to a mesh via #Crayfish, styled with arrows, and visualised in #3D.
🎥 youtu.be/ttLxQBe0HIo
Flow directions in the French Alpes with a 5 m RGEALTI DTM (IGN France). Using #QGIS’s new native Fill Sinks (Wang & Liu), I calculated flow directions, converted them to a mesh via #Crayfish, styled with arrows, and visualised in #3D.
🎥 youtu.be/ttLxQBe0HIo

Calculate Flow Direction with the Native QGIS Tool and Style with Arrows
YouTube video by Hans van der Kwast
youtu.be
November 23, 2025 at 9:34 PM
#30DayMapChallenge, day 23: Process
Flow directions in the French Alpes with a 5 m RGEALTI DTM (IGN France). Using #QGIS’s new native Fill Sinks (Wang & Liu), I calculated flow directions, converted them to a mesh via #Crayfish, styled with arrows, and visualised in #3D.
🎥 youtu.be/ttLxQBe0HIo
Flow directions in the French Alpes with a 5 m RGEALTI DTM (IGN France). Using #QGIS’s new native Fill Sinks (Wang & Liu), I calculated flow directions, converted them to a mesh via #Crayfish, styled with arrows, and visualised in #3D.
🎥 youtu.be/ttLxQBe0HIo
#30DayMapChallenge Day 22 – Data: #Natural Earth 🌍
⏳ With limited time I used my own tutorial to make a population map in #QGIS.
🔗 Tutorial: courses.gisopencourseware.org/mod/book/vie...
🎥 YouTube:
👉 Symbolizing points: youtu.be/0PEZ8dUNCJk
👉 Collapsed legend: youtu.be/hxzNOf3ppbQ
⏳ With limited time I used my own tutorial to make a population map in #QGIS.
🔗 Tutorial: courses.gisopencourseware.org/mod/book/vie...
🎥 YouTube:
👉 Symbolizing points: youtu.be/0PEZ8dUNCJk
👉 Collapsed legend: youtu.be/hxzNOf3ppbQ

November 22, 2025 at 11:34 AM
#30DayMapChallenge Day 22 – Data: #Natural Earth 🌍
⏳ With limited time I used my own tutorial to make a population map in #QGIS.
🔗 Tutorial: courses.gisopencourseware.org/mod/book/vie...
🎥 YouTube:
👉 Symbolizing points: youtu.be/0PEZ8dUNCJk
👉 Collapsed legend: youtu.be/hxzNOf3ppbQ
⏳ With limited time I used my own tutorial to make a population map in #QGIS.
🔗 Tutorial: courses.gisopencourseware.org/mod/book/vie...
🎥 YouTube:
👉 Symbolizing points: youtu.be/0PEZ8dUNCJk
👉 Collapsed legend: youtu.be/hxzNOf3ppbQ
#30DayMapChallenge Day 21: Icons 🗺️➡️🎶
My week in emojis.
Made in #QGIS with @maptiler.bsky.social backdrop
My week in emojis.
Made in #QGIS with @maptiler.bsky.social backdrop

November 21, 2025 at 2:57 PM
#30DayMapChallenge Day 21: Icons 🗺️➡️🎶
My week in emojis.
Made in #QGIS with @maptiler.bsky.social backdrop
My week in emojis.
Made in #QGIS with @maptiler.bsky.social backdrop
#30DayMapChallenge Day 20: Water 🌊
No time for complexity today, so I made Invearth. By simply flipping the hillshade to Southeast in #QGIS with the #Mapzen Global Terrain layer, the Himalayas became the deepest trench and oceans turned into habitable land.
No time for complexity today, so I made Invearth. By simply flipping the hillshade to Southeast in #QGIS with the #Mapzen Global Terrain layer, the Himalayas became the deepest trench and oceans turned into habitable land.

November 20, 2025 at 6:37 AM
#30DayMapChallenge Day 20: Water 🌊
No time for complexity today, so I made Invearth. By simply flipping the hillshade to Southeast in #QGIS with the #Mapzen Global Terrain layer, the Himalayas became the deepest trench and oceans turned into habitable land.
No time for complexity today, so I made Invearth. By simply flipping the hillshade to Southeast in #QGIS with the #Mapzen Global Terrain layer, the Himalayas became the deepest trench and oceans turned into habitable land.
#30DayMapChallenge Day 19: #Projections 🍊🌍
Ever tried peeling an orange and laying it flat? It cracks apart, just like the Earth when we project it onto a map.
World map out of orange peel, styled in a polar stereographic projection. Made in #QGIS with #NaturalEarth data.
Ever tried peeling an orange and laying it flat? It cracks apart, just like the Earth when we project it onto a map.
World map out of orange peel, styled in a polar stereographic projection. Made in #QGIS with #NaturalEarth data.

November 19, 2025 at 7:04 AM
#30DayMapChallenge Day 19: #Projections 🍊🌍
Ever tried peeling an orange and laying it flat? It cracks apart, just like the Earth when we project it onto a map.
World map out of orange peel, styled in a polar stereographic projection. Made in #QGIS with #NaturalEarth data.
Ever tried peeling an orange and laying it flat? It cracks apart, just like the Earth when we project it onto a map.
World map out of orange peel, styled in a polar stereographic projection. Made in #QGIS with #NaturalEarth data.