


Hans van der Kwast
@qwast-gis.com
Associate Prof. #ihedelft | Physical Geographer | Owner of QWAST-GIS | #OpenSource advocacy | board member @qgis.nl | #gisocw | #OSGeo Charter Member | #QGIS
#30DayMapChallenge Day 15: Fire 🔥 Mapped the density of fire stations in the Netherlands using #QGIS. #OpenData from #OpenStreetMap via QuickOSM plugin. Styled with #heatmap renderer. Fire service zones from @cbsstatistiek.bsky.social via #PDOK Services plugin.

November 15, 2025 at 9:19 AM
#30DayMapChallenge Day 15: Fire 🔥 Mapped the density of fire stations in the Netherlands using #QGIS. #OpenData from #OpenStreetMap via QuickOSM plugin. Styled with #heatmap renderer. Fire service zones from @cbsstatistiek.bsky.social via #PDOK Services plugin.
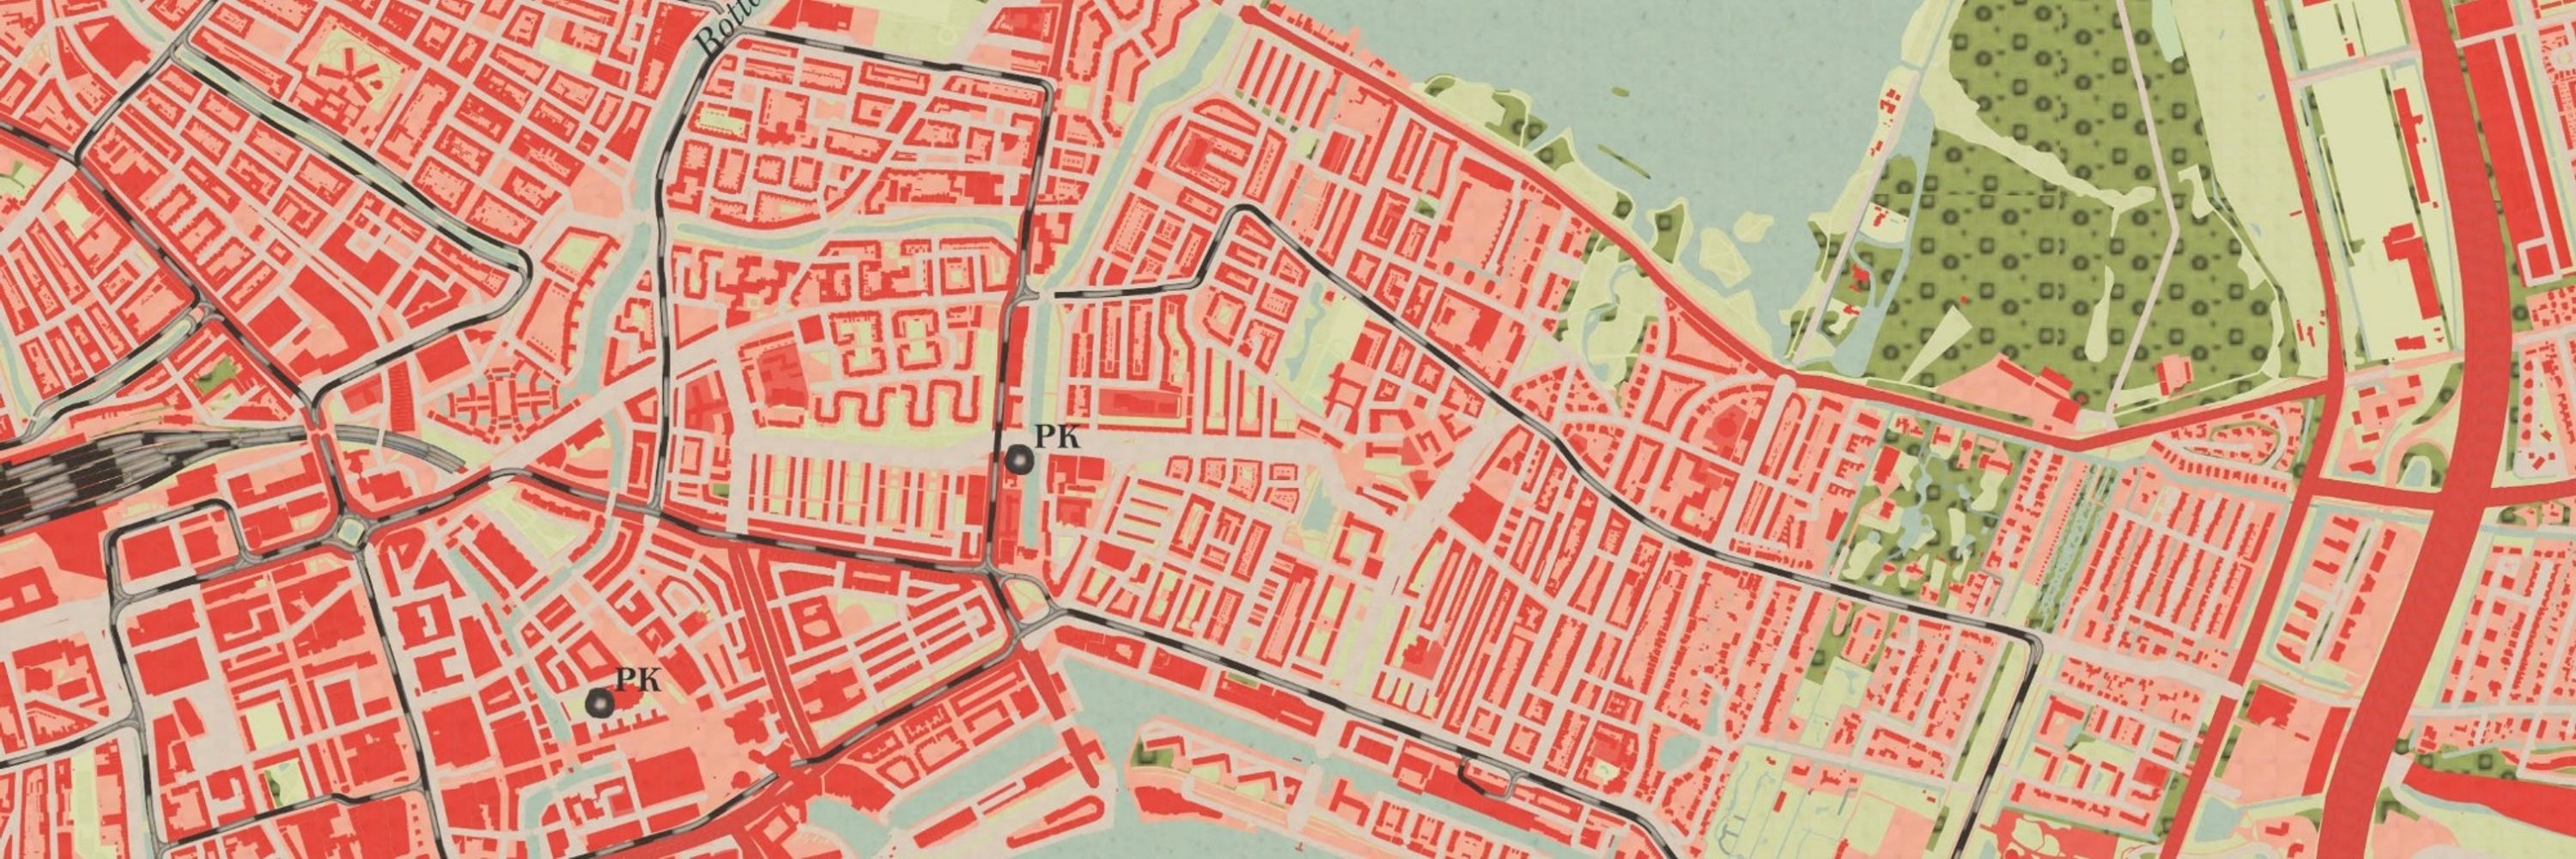
#30DayMapChallenge – Day 14: Data Challenge #OpenStreetMap
Although this year’s challenge doesn’t include a #VintageMap theme, I decided to bring a bit of history into today’s task.
Using #QGIS, I styled current OpenStreetMap data of #RhodeIsland in the aesthetic of 19th‑century maps.
Although this year’s challenge doesn’t include a #VintageMap theme, I decided to bring a bit of history into today’s task.
Using #QGIS, I styled current OpenStreetMap data of #RhodeIsland in the aesthetic of 19th‑century maps.

November 14, 2025 at 8:13 AM
#30DayMapChallenge – Day 14: Data Challenge #OpenStreetMap
Although this year’s challenge doesn’t include a #VintageMap theme, I decided to bring a bit of history into today’s task.
Using #QGIS, I styled current OpenStreetMap data of #RhodeIsland in the aesthetic of 19th‑century maps.
Although this year’s challenge doesn’t include a #VintageMap theme, I decided to bring a bit of history into today’s task.
Using #QGIS, I styled current OpenStreetMap data of #RhodeIsland in the aesthetic of 19th‑century maps.
#30DayMapChallenge – Day 13: 10 minute map
Map of the #Mara River Basin made in #QGIS with #HydroSHEDS #opendata and @maptiler.bsky.social #vectortiles.
🎥 Try it for your own catchment: youtu.be/hUgEYKz87gw
Map of the #Mara River Basin made in #QGIS with #HydroSHEDS #opendata and @maptiler.bsky.social #vectortiles.
🎥 Try it for your own catchment: youtu.be/hUgEYKz87gw

November 13, 2025 at 10:01 AM
#30DayMapChallenge – Day 13: 10 minute map
Map of the #Mara River Basin made in #QGIS with #HydroSHEDS #opendata and @maptiler.bsky.social #vectortiles.
🎥 Try it for your own catchment: youtu.be/hUgEYKz87gw
Map of the #Mara River Basin made in #QGIS with #HydroSHEDS #opendata and @maptiler.bsky.social #vectortiles.
🎥 Try it for your own catchment: youtu.be/hUgEYKz87gw
#30DayMapChallenge Day 12: Map from 2125
A worst‑case scenario of 2.5 m #SeaLevelRise reshapes the delta of the Netherlands. Made in #QGIS with SRTM90 via @opentopography.org, raster image styled polygons, @maptiler satellite raster tiles, and rendered in #3D using Qgis2threejs.
A worst‑case scenario of 2.5 m #SeaLevelRise reshapes the delta of the Netherlands. Made in #QGIS with SRTM90 via @opentopography.org, raster image styled polygons, @maptiler satellite raster tiles, and rendered in #3D using Qgis2threejs.

November 12, 2025 at 9:37 AM
#30DayMapChallenge Day 12: Map from 2125
A worst‑case scenario of 2.5 m #SeaLevelRise reshapes the delta of the Netherlands. Made in #QGIS with SRTM90 via @opentopography.org, raster image styled polygons, @maptiler satellite raster tiles, and rendered in #3D using Qgis2threejs.
A worst‑case scenario of 2.5 m #SeaLevelRise reshapes the delta of the Netherlands. Made in #QGIS with SRTM90 via @opentopography.org, raster image styled polygons, @maptiler satellite raster tiles, and rendered in #3D using Qgis2threejs.
#30DayMapChallenge Day 11: Minimal Map
#Rotterdam shown only by land & water, revealing how the port shifted from city center to the North Sea with Maasvlakte & Tweede Maasvlakte. Once the world’s largest port, now 3rd, still a global hub.
Made with #QGIS, @maptiler.bsky.social and CBS data.
#Rotterdam shown only by land & water, revealing how the port shifted from city center to the North Sea with Maasvlakte & Tweede Maasvlakte. Once the world’s largest port, now 3rd, still a global hub.
Made with #QGIS, @maptiler.bsky.social and CBS data.

November 11, 2025 at 10:49 AM
#30DayMapChallenge Day 11: Minimal Map
#Rotterdam shown only by land & water, revealing how the port shifted from city center to the North Sea with Maasvlakte & Tweede Maasvlakte. Once the world’s largest port, now 3rd, still a global hub.
Made with #QGIS, @maptiler.bsky.social and CBS data.
#Rotterdam shown only by land & water, revealing how the port shifted from city center to the North Sea with Maasvlakte & Tweede Maasvlakte. Once the world’s largest port, now 3rd, still a global hub.
Made with #QGIS, @maptiler.bsky.social and CBS data.
#30DayMapChallenge Day 10: Air
🌪️ Animated mesh layers of #hurricane tracks resembling Vincent van Gogh’s Starry Night.
#HurricaneMelissa #Jamaica.
Made with #QGIS. Data from #Copernicus #ECMWF
🌪️ Animated mesh layers of #hurricane tracks resembling Vincent van Gogh’s Starry Night.
#HurricaneMelissa #Jamaica.
Made with #QGIS. Data from #Copernicus #ECMWF
November 10, 2025 at 8:00 PM
#30DayMapChallenge Day 10: Air
🌪️ Animated mesh layers of #hurricane tracks resembling Vincent van Gogh’s Starry Night.
#HurricaneMelissa #Jamaica.
Made with #QGIS. Data from #Copernicus #ECMWF
🌪️ Animated mesh layers of #hurricane tracks resembling Vincent van Gogh’s Starry Night.
#HurricaneMelissa #Jamaica.
Made with #QGIS. Data from #Copernicus #ECMWF
#30DayMapChallenge – Day 9: Analog
🍂 European QGIS User Groups on a natural canvas of autumn leaves.
#GIS #Cartography
🍂 European QGIS User Groups on a natural canvas of autumn leaves.
#GIS #Cartography

November 9, 2025 at 9:40 PM
#30DayMapChallenge – Day 9: Analog
🍂 European QGIS User Groups on a natural canvas of autumn leaves.
#GIS #Cartography
🍂 European QGIS User Groups on a natural canvas of autumn leaves.
#GIS #Cartography
#30DayMapChallenge Day 8: Urban
On #WorldUrbanismDay, I highlight the most paved municipality in the Netherlands: Krimpen aan den IJssel (43.3%), with Kortland-Noord at nearly 53%.
This Imperviousness Map was made by Friedenau Society for Climate Adaptation Services, derived from AHN LiDAR + BGT.
On #WorldUrbanismDay, I highlight the most paved municipality in the Netherlands: Krimpen aan den IJssel (43.3%), with Kortland-Noord at nearly 53%.
This Imperviousness Map was made by Friedenau Society for Climate Adaptation Services, derived from AHN LiDAR + BGT.

November 8, 2025 at 2:39 PM
#30DayMapChallenge Day 8: Urban
On #WorldUrbanismDay, I highlight the most paved municipality in the Netherlands: Krimpen aan den IJssel (43.3%), with Kortland-Noord at nearly 53%.
This Imperviousness Map was made by Friedenau Society for Climate Adaptation Services, derived from AHN LiDAR + BGT.
On #WorldUrbanismDay, I highlight the most paved municipality in the Netherlands: Krimpen aan den IJssel (43.3%), with Kortland-Noord at nearly 53%.
This Imperviousness Map was made by Friedenau Society for Climate Adaptation Services, derived from AHN LiDAR + BGT.
#30DayMapChallenge Day 7: Accessibility 🌍✈️
I mapped visa-free travel:
🛫outbound (where citizens can go) and 🛬inbound (who countries let in).
It reveals global mobility inequality.
📊 Data: 2025 Passport Index
🛠️ Made with QGIS
#VisaFreeTravel #Deglobalisation #QGIS #GIS #DataViz
I mapped visa-free travel:
🛫outbound (where citizens can go) and 🛬inbound (who countries let in).
It reveals global mobility inequality.
📊 Data: 2025 Passport Index
🛠️ Made with QGIS
#VisaFreeTravel #Deglobalisation #QGIS #GIS #DataViz

November 7, 2025 at 4:35 PM
#30DayMapChallenge Day 7: Accessibility 🌍✈️
I mapped visa-free travel:
🛫outbound (where citizens can go) and 🛬inbound (who countries let in).
It reveals global mobility inequality.
📊 Data: 2025 Passport Index
🛠️ Made with QGIS
#VisaFreeTravel #Deglobalisation #QGIS #GIS #DataViz
I mapped visa-free travel:
🛫outbound (where citizens can go) and 🛬inbound (who countries let in).
It reveals global mobility inequality.
📊 Data: 2025 Passport Index
🛠️ Made with QGIS
#VisaFreeTravel #Deglobalisation #QGIS #GIS #DataViz
#30DayMapChallenge Day 6: Dimensions Today’s map is a #3D view of Algiers using #QGIS. Elevation = evapotranspiration! I used a #FAO #WaPOR L1 AETI image from 2008 as the elevation model, draped with Google Satellite imagery. Vegetated/agricultural zones rise above urban areas. #GIS #RemoteSensing


November 6, 2025 at 6:17 PM
#30DayMapChallenge Day 6: Dimensions Today’s map is a #3D view of Algiers using #QGIS. Elevation = evapotranspiration! I used a #FAO #WaPOR L1 AETI image from 2008 as the elevation model, draped with Google Satellite imagery. Vegetated/agricultural zones rise above urban areas. #GIS #RemoteSensing
#30DayMapChallenge Day 5: Earth🌍
#Groningen’s gas extraction and #Limburg’s mining caused seismic risks, which js now a political issue around damage & compensation. Made while teaching #QGIS & @merginmaps.bsky.social in Leek (Groningen) for #QWAST #Fervent & #Geo2Meet.
#Groningen’s gas extraction and #Limburg’s mining caused seismic risks, which js now a political issue around damage & compensation. Made while teaching #QGIS & @merginmaps.bsky.social in Leek (Groningen) for #QWAST #Fervent & #Geo2Meet.

November 5, 2025 at 3:35 PM
#30DayMapChallenge Day 5: Earth🌍
#Groningen’s gas extraction and #Limburg’s mining caused seismic risks, which js now a political issue around damage & compensation. Made while teaching #QGIS & @merginmaps.bsky.social in Leek (Groningen) for #QWAST #Fervent & #Geo2Meet.
#Groningen’s gas extraction and #Limburg’s mining caused seismic risks, which js now a political issue around damage & compensation. Made while teaching #QGIS & @merginmaps.bsky.social in Leek (Groningen) for #QWAST #Fervent & #Geo2Meet.
#30DayMapChallenge Day 4 – Data: My Data
🌍 Every year, a colleague asks me to map the geographic distribution of new MSc students in Water & Sustainable Development at #IHEDelft. A beautiful dataset that reflects our global classroom! #GIS #OpenData #WaterEducation
🌍 Every year, a colleague asks me to map the geographic distribution of new MSc students in Water & Sustainable Development at #IHEDelft. A beautiful dataset that reflects our global classroom! #GIS #OpenData #WaterEducation

November 4, 2025 at 6:10 PM
#30DayMapChallenge Day 4 – Data: My Data
🌍 Every year, a colleague asks me to map the geographic distribution of new MSc students in Water & Sustainable Development at #IHEDelft. A beautiful dataset that reflects our global classroom! #GIS #OpenData #WaterEducation
🌍 Every year, a colleague asks me to map the geographic distribution of new MSc students in Water & Sustainable Development at #IHEDelft. A beautiful dataset that reflects our global classroom! #GIS #OpenData #WaterEducation
#30DayMapChallenge Day 3: polygons
🌍 Busy day, but I made an animated map of CO₂ emissions per capita using data from @ourworldindata.org.
Tools: #QGIS #GIMP. Tutorial: courses.gisopencourseware.org/mod/book/vie... @gisopencourseware.bsky.social.
#GIS #OpenData
🌍 Busy day, but I made an animated map of CO₂ emissions per capita using data from @ourworldindata.org.
Tools: #QGIS #GIMP. Tutorial: courses.gisopencourseware.org/mod/book/vie... @gisopencourseware.bsky.social.
#GIS #OpenData

November 3, 2025 at 6:33 PM
#30DayMapChallenge Day 3: polygons
🌍 Busy day, but I made an animated map of CO₂ emissions per capita using data from @ourworldindata.org.
Tools: #QGIS #GIMP. Tutorial: courses.gisopencourseware.org/mod/book/vie... @gisopencourseware.bsky.social.
#GIS #OpenData
🌍 Busy day, but I made an animated map of CO₂ emissions per capita using data from @ourworldindata.org.
Tools: #QGIS #GIMP. Tutorial: courses.gisopencourseware.org/mod/book/vie... @gisopencourseware.bsky.social.
#GIS #OpenData
#30DayMapChallenge day 2: Lines 🗺️ Mapped Rotterdam’s watery past through street names with pre- and suffixes like singel, boezem, sloot, vaart, haven, and gedempte. These names trace water infrastructure. Some still flowing, others filled in.
Made with #qgis #openstreetmap and #maptiler
Made with #qgis #openstreetmap and #maptiler

November 2, 2025 at 8:20 AM
#30DayMapChallenge day 2: Lines 🗺️ Mapped Rotterdam’s watery past through street names with pre- and suffixes like singel, boezem, sloot, vaart, haven, and gedempte. These names trace water infrastructure. Some still flowing, others filled in.
Made with #qgis #openstreetmap and #maptiler
Made with #qgis #openstreetmap and #maptiler
#30DayMapChallenge 2025 Day 1: points
Inspired by my stay in Maastricht performing #CarminaBurana with #BrabantKoor & the Jussen Brothers.
#toponyms ending in -tricht, -drecht, -trecht, derived from Latin #trajectum, meaning river crossing.
Made with #QGIS #OpenStreetMap & @maptiler.bsky.social
Inspired by my stay in Maastricht performing #CarminaBurana with #BrabantKoor & the Jussen Brothers.
#toponyms ending in -tricht, -drecht, -trecht, derived from Latin #trajectum, meaning river crossing.
Made with #QGIS #OpenStreetMap & @maptiler.bsky.social

November 1, 2025 at 8:57 AM
#30DayMapChallenge 2025 Day 1: points
Inspired by my stay in Maastricht performing #CarminaBurana with #BrabantKoor & the Jussen Brothers.
#toponyms ending in -tricht, -drecht, -trecht, derived from Latin #trajectum, meaning river crossing.
Made with #QGIS #OpenStreetMap & @maptiler.bsky.social
Inspired by my stay in Maastricht performing #CarminaBurana with #BrabantKoor & the Jussen Brothers.
#toponyms ending in -tricht, -drecht, -trecht, derived from Latin #trajectum, meaning river crossing.
Made with #QGIS #OpenStreetMap & @maptiler.bsky.social
Taught #QGIS for Hydrological Applications at @tudresden.bsky.social Tharandt campus. Nice group of #ErasmusMundus #FloodRiskManagement students earned official QGIS certificates after successful completion. Open source GIS empowering future water pros! 💧 #QGIS #QGISHydro #Hydrology #GIS #IHEDelft

October 4, 2025 at 9:36 AM
Taught #QGIS for Hydrological Applications at @tudresden.bsky.social Tharandt campus. Nice group of #ErasmusMundus #FloodRiskManagement students earned official QGIS certificates after successful completion. Open source GIS empowering future water pros! 💧 #QGIS #QGISHydro #Hydrology #GIS #IHEDelft
Want to start a #QGIS User Group or grow one? Join us this Friday for a #QGISOpenDay session with PSC Chair Marco Bernasocchi & @timlinux.bsky.social! Learn how to launch, run, and connect your group globally 🌍
📅 26 Sept 2025
🕚 11H00 UTC
📺 Livestream and more info: github.com/qgis/QGIS/wi...
📅 26 Sept 2025
🕚 11H00 UTC
📺 Livestream and more info: github.com/qgis/QGIS/wi...

September 25, 2025 at 7:12 AM
Want to start a #QGIS User Group or grow one? Join us this Friday for a #QGISOpenDay session with PSC Chair Marco Bernasocchi & @timlinux.bsky.social! Learn how to launch, run, and connect your group globally 🌍
📅 26 Sept 2025
🕚 11H00 UTC
📺 Livestream and more info: github.com/qgis/QGIS/wi...
📅 26 Sept 2025
🕚 11H00 UTC
📺 Livestream and more info: github.com/qgis/QGIS/wi...
Taught #QGIS for groundwater applications to #ErasmusMundus #GroundwatCH MSc students last week at Instituto Superior Técnico in Lisbon. With inspiring guest lectures from @timlinux.bsky.social & alumna Namrata Karki. Students received the official QGIS certificate. #IHEDelft

September 8, 2025 at 5:31 PM
Taught #QGIS for groundwater applications to #ErasmusMundus #GroundwatCH MSc students last week at Instituto Superior Técnico in Lisbon. With inspiring guest lectures from @timlinux.bsky.social & alumna Namrata Karki. Students received the official QGIS certificate. #IHEDelft
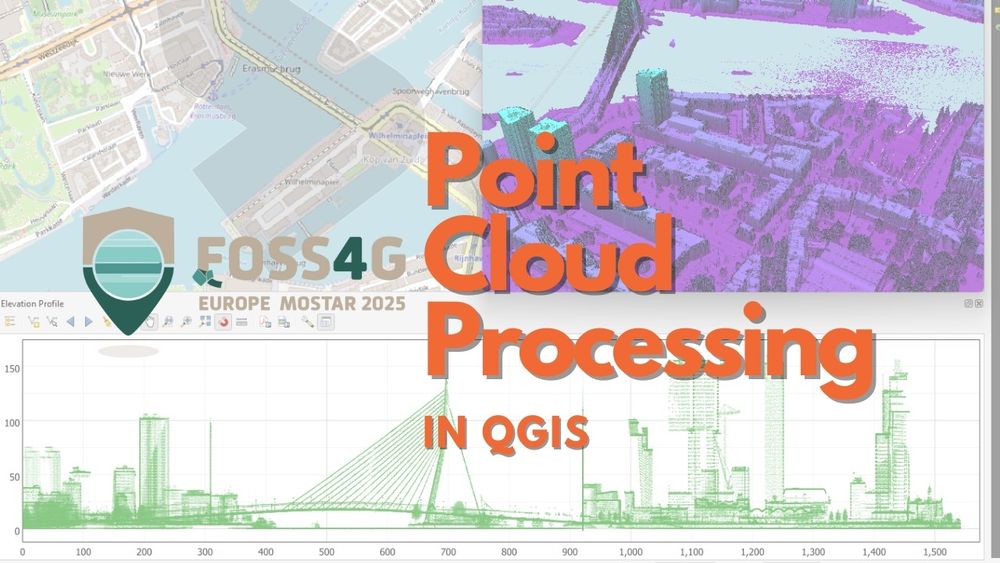
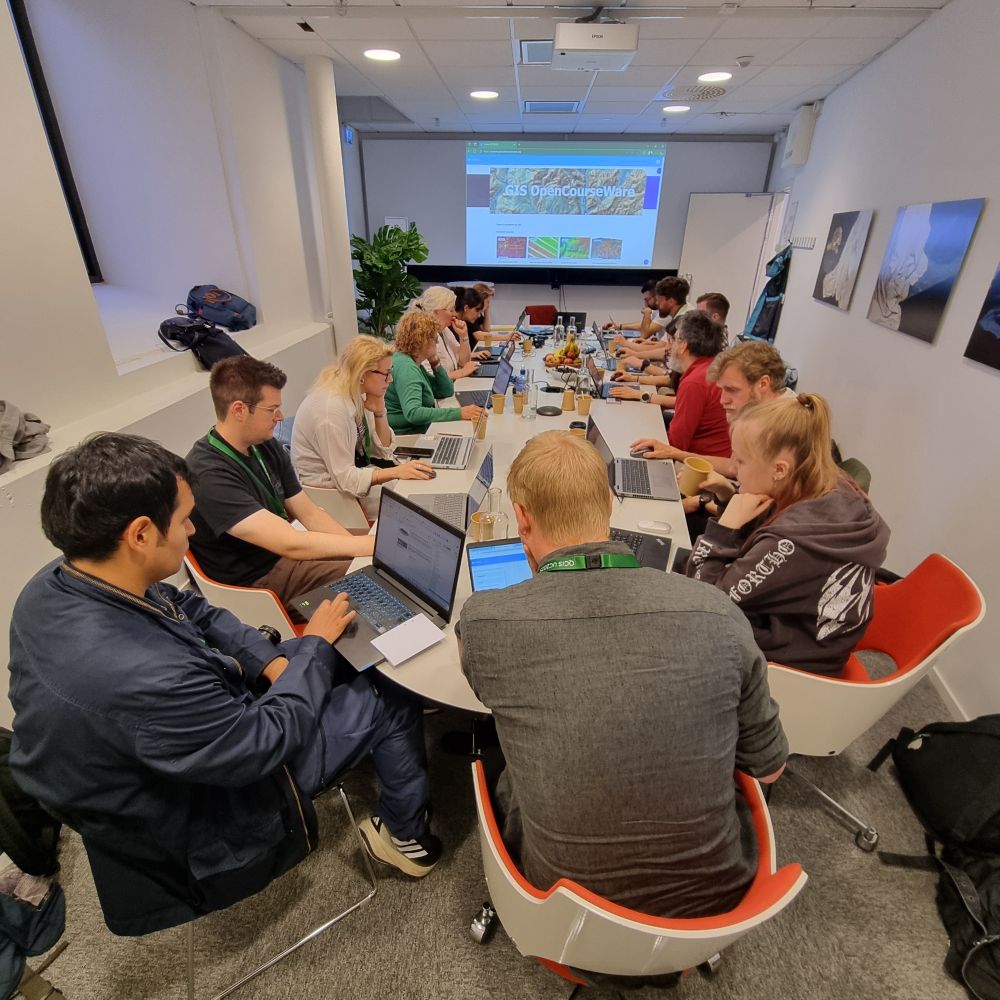
🚀 Today, I'm running a workshop on #PointCloud Processing in #QGIS at #FOSS4GEurope 2025 in #Mostar! We'll dive into the newest features in QGIS.
💻 Can’t join in person? Free access at @gisopencourseware.bsky.social: courses.gisopencourseware.org
💻 Can’t join in person? Free access at @gisopencourseware.bsky.social: courses.gisopencourseware.org
July 15, 2025 at 5:38 AM
🚀 Today, I'm running a workshop on #PointCloud Processing in #QGIS at #FOSS4GEurope 2025 in #Mostar! We'll dive into the newest features in QGIS.
💻 Can’t join in person? Free access at @gisopencourseware.bsky.social: courses.gisopencourseware.org
💻 Can’t join in person? Free access at @gisopencourseware.bsky.social: courses.gisopencourseware.org
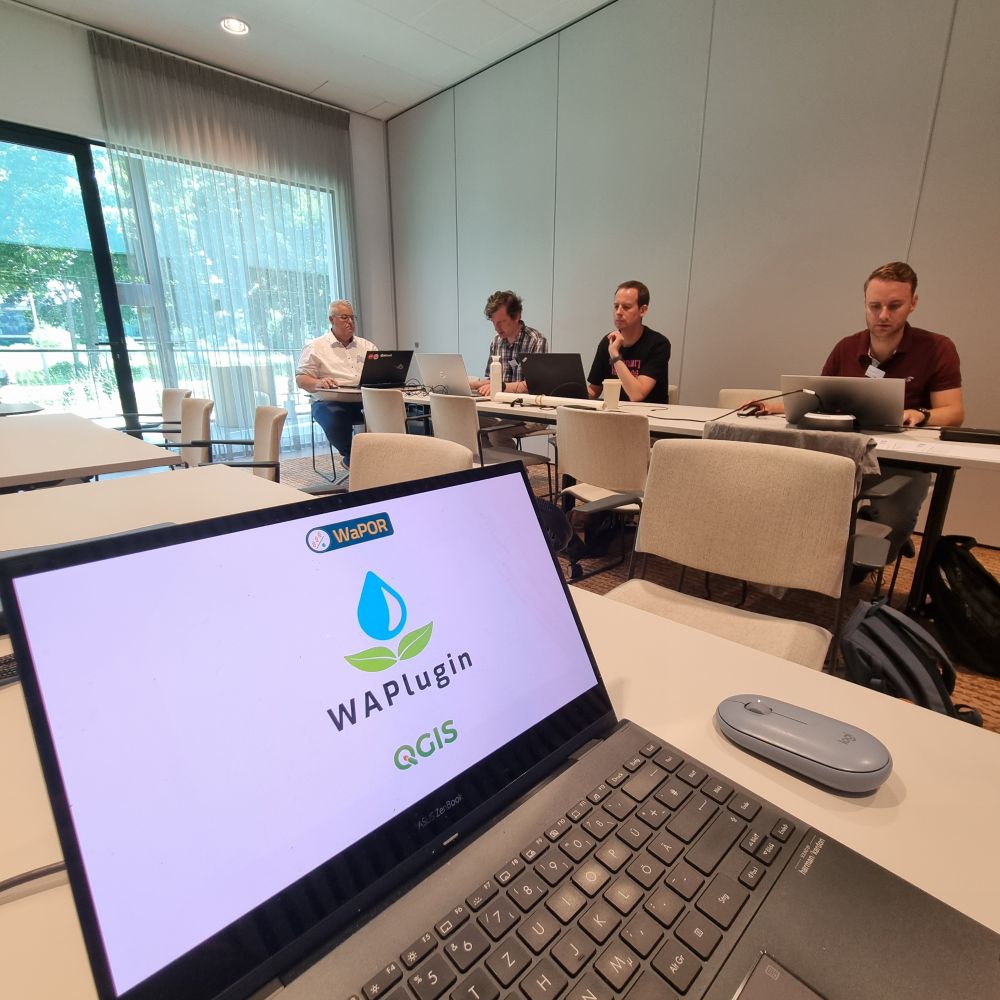
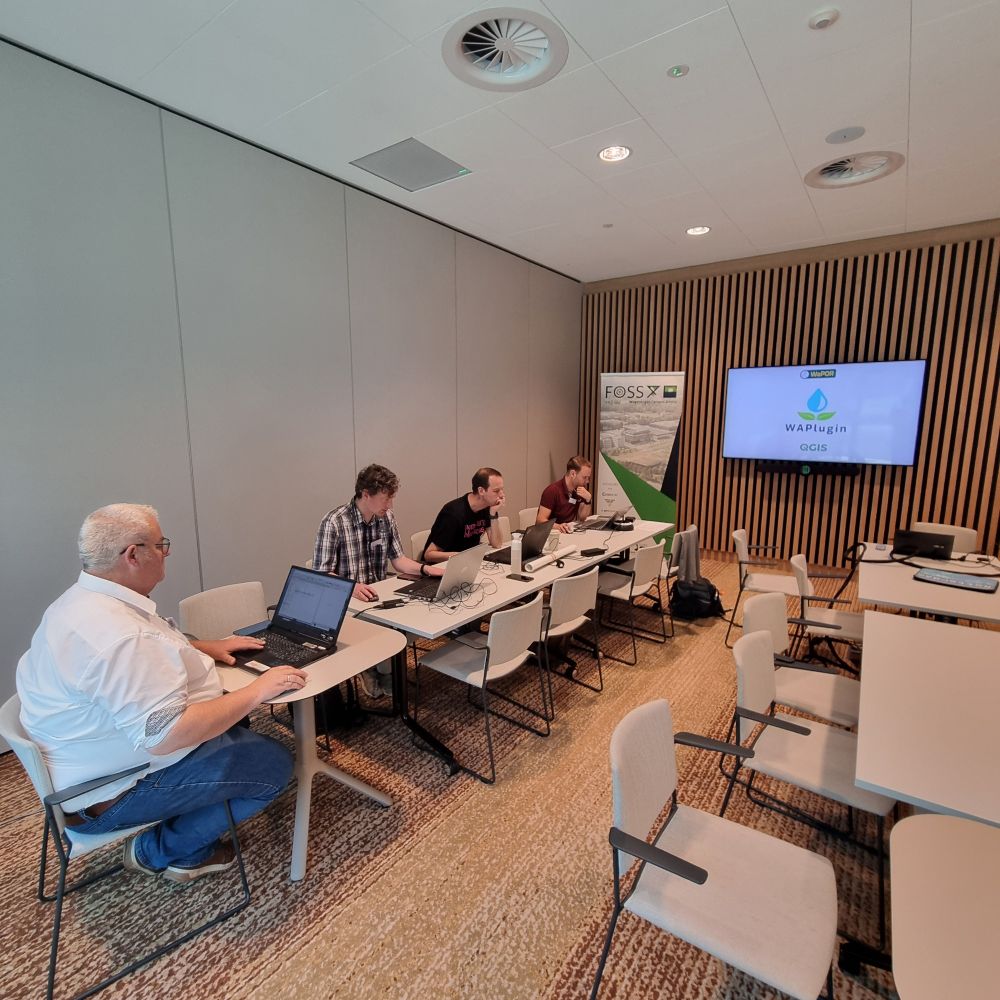
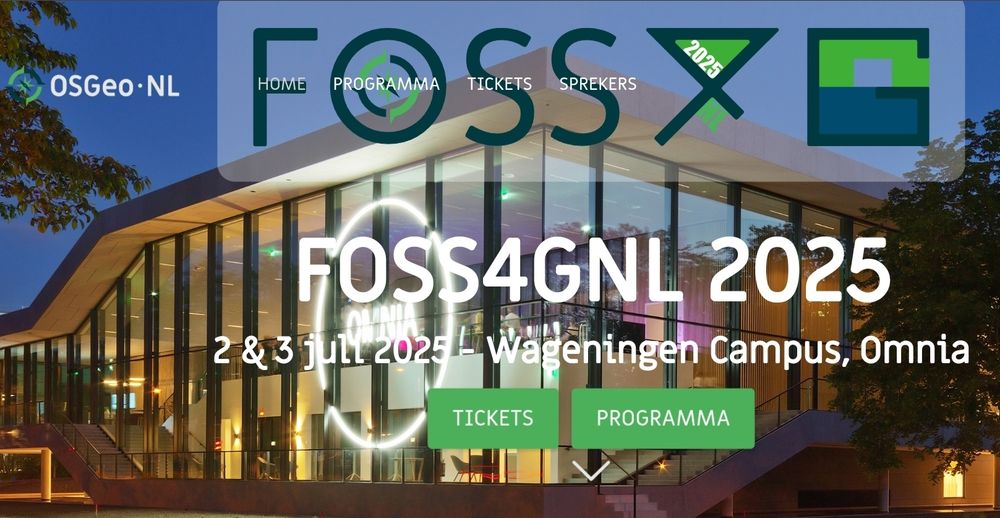
#QGIS #WaPlugin workshop at #FOSS4GNL in Wageningen. #FAO #WaPOR #waterproductivity #IHEDelft
Follow along at @gisopencourseware.bsky.social
courses.gisopencourseware.org/course/view....
Follow along at @gisopencourseware.bsky.social
courses.gisopencourseware.org/course/view....
July 2, 2025 at 9:43 AM
#QGIS #WaPlugin workshop at #FOSS4GNL in Wageningen. #FAO #WaPOR #waterproductivity #IHEDelft
Follow along at @gisopencourseware.bsky.social
courses.gisopencourseware.org/course/view....
Follow along at @gisopencourseware.bsky.social
courses.gisopencourseware.org/course/view....
Today at #FOSS4GNL, I'm giving 2 workshops. Follow along at @gisopencourseware.bsky.social:
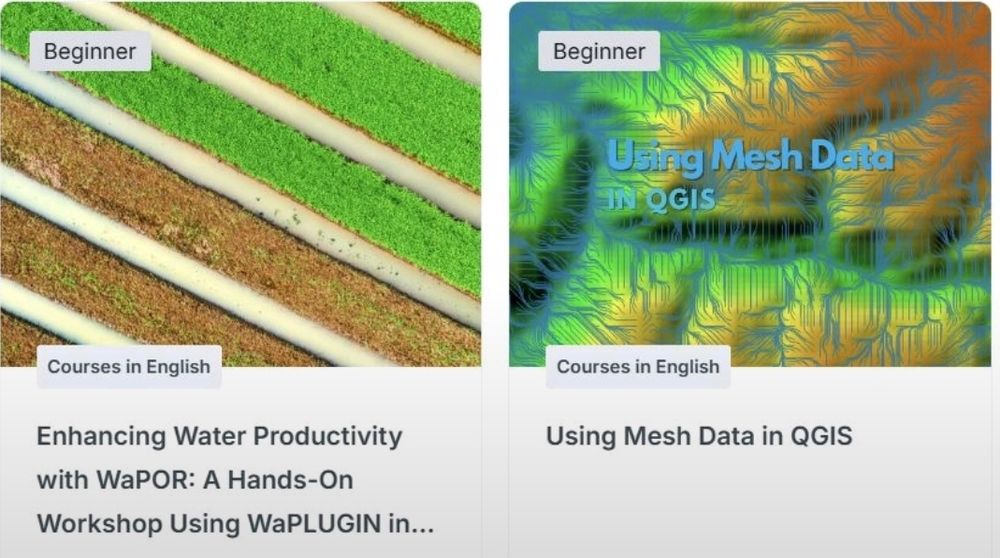
👉 Enhancing Crop Water Productivity with WaPOR: A Hands-On Workshop Using #WaPlugin in #QGIS: courses.gisopencourseware.org/course/view....
👉Mesh Data in QGIS: courses.gisopencourseware.org/course/view....
👉 Enhancing Crop Water Productivity with WaPOR: A Hands-On Workshop Using #WaPlugin in #QGIS: courses.gisopencourseware.org/course/view....
👉Mesh Data in QGIS: courses.gisopencourseware.org/course/view....
July 2, 2025 at 5:41 AM
Today at #FOSS4GNL, I'm giving 2 workshops. Follow along at @gisopencourseware.bsky.social:
👉 Enhancing Crop Water Productivity with WaPOR: A Hands-On Workshop Using #WaPlugin in #QGIS: courses.gisopencourseware.org/course/view....
👉Mesh Data in QGIS: courses.gisopencourseware.org/course/view....
👉 Enhancing Crop Water Productivity with WaPOR: A Hands-On Workshop Using #WaPlugin in #QGIS: courses.gisopencourseware.org/course/view....
👉Mesh Data in QGIS: courses.gisopencourseware.org/course/view....
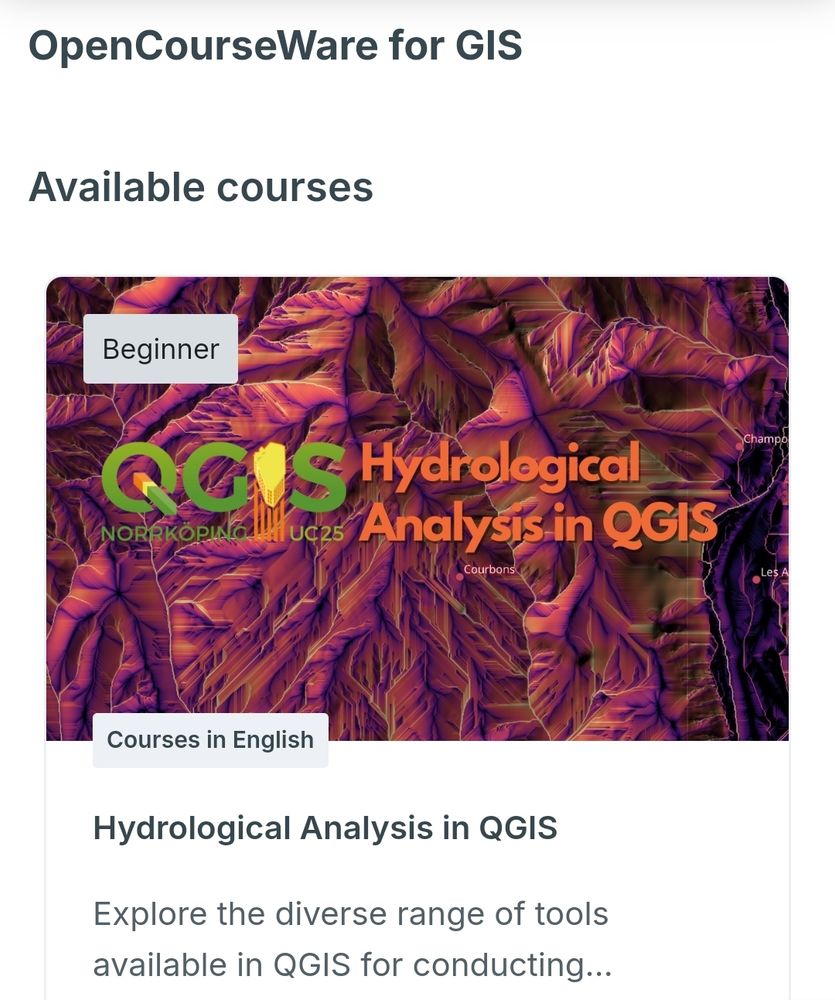
Teaching the workshop Hydrological Analysis in #QGIS at #qgisuc25 in Nörrkoping, Sweden. Follow along for free at @gisopencourseware.bsky.social: courses.gisopencourseware.org/course/view....
June 4, 2025 at 9:30 AM
Teaching the workshop Hydrological Analysis in #QGIS at #qgisuc25 in Nörrkoping, Sweden. Follow along for free at @gisopencourseware.bsky.social: courses.gisopencourseware.org/course/view....
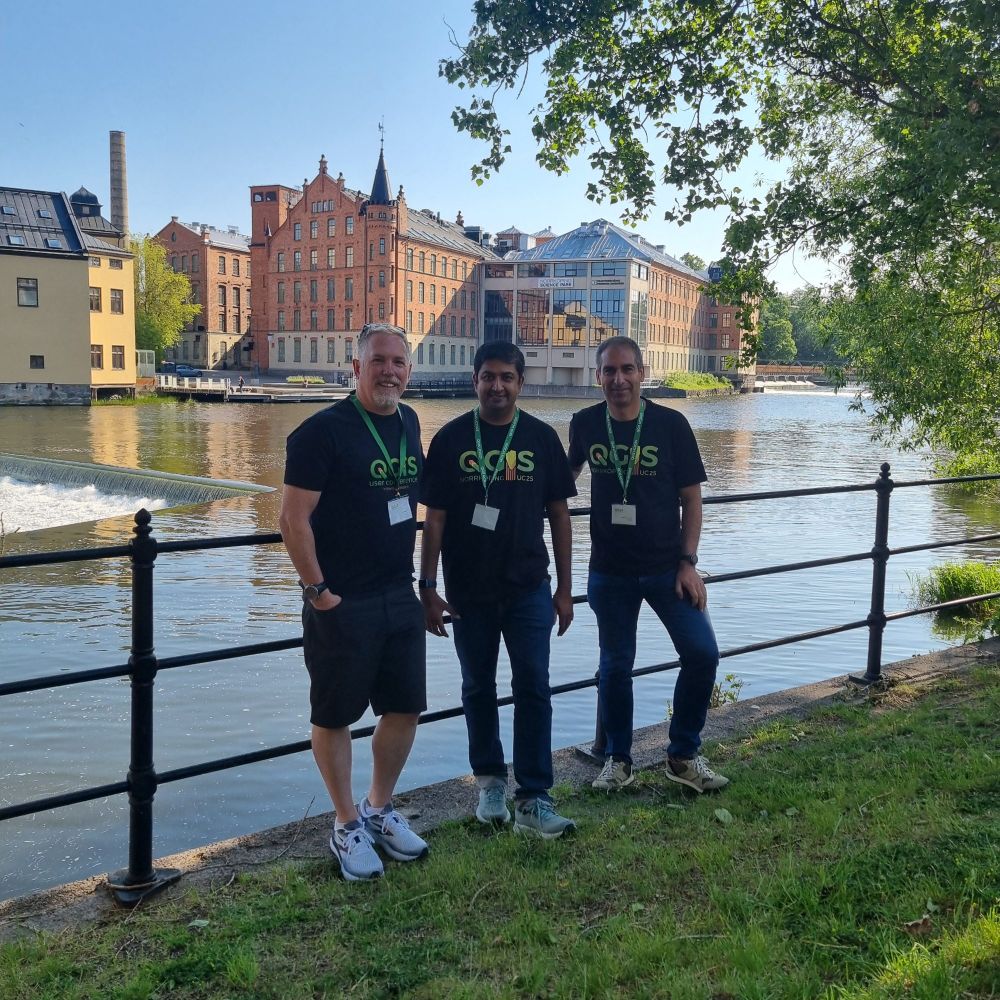
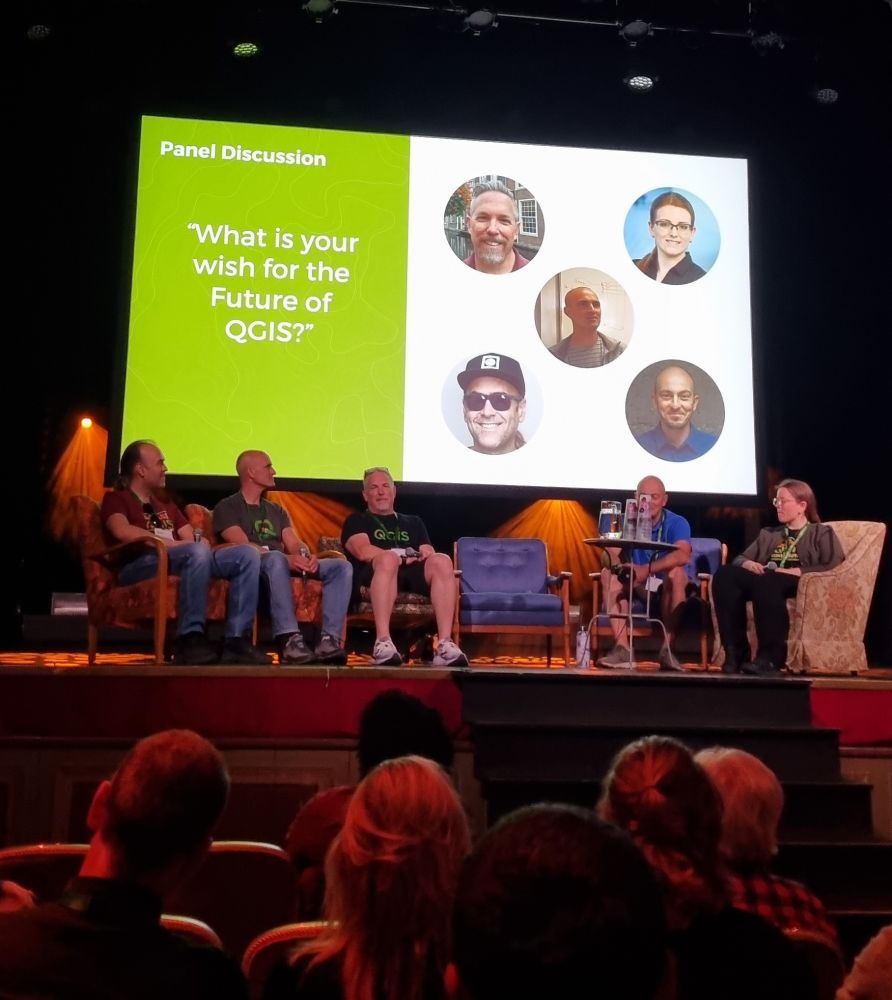
This week, I’m at #qgisuc2025 in Norrköping, Sweden! Inspiring talks, hands-on workshops!
💡Today, I’m giving a workshop on hydrological analysis tools in #QGIS, follow along at @gisopencourseware.bsky.social: courses.gisopencourseware.org/course/view....
💡Today, I’m giving a workshop on hydrological analysis tools in #QGIS, follow along at @gisopencourseware.bsky.social: courses.gisopencourseware.org/course/view....

June 4, 2025 at 5:07 AM
This week, I’m at #qgisuc2025 in Norrköping, Sweden! Inspiring talks, hands-on workshops!
💡Today, I’m giving a workshop on hydrological analysis tools in #QGIS, follow along at @gisopencourseware.bsky.social: courses.gisopencourseware.org/course/view....
💡Today, I’m giving a workshop on hydrological analysis tools in #QGIS, follow along at @gisopencourseware.bsky.social: courses.gisopencourseware.org/course/view....
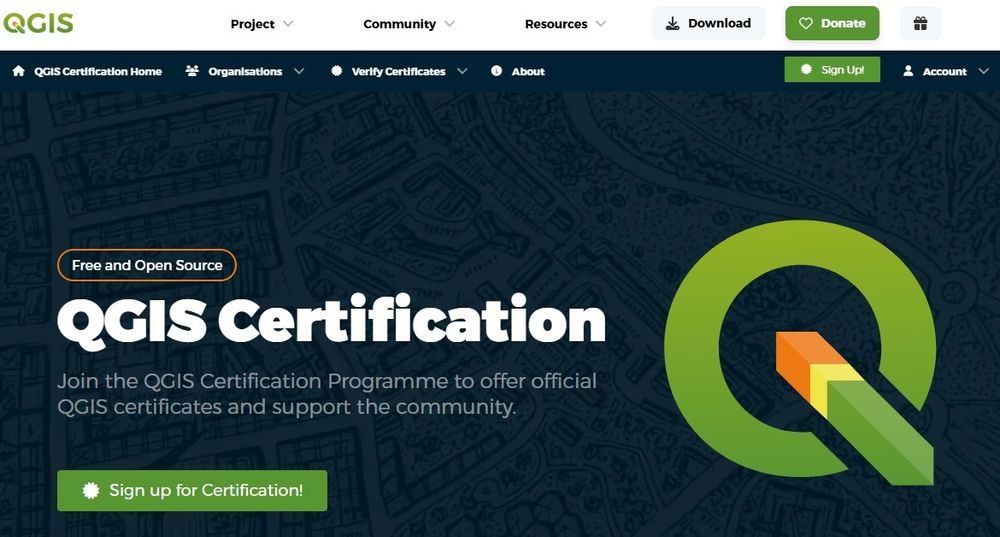
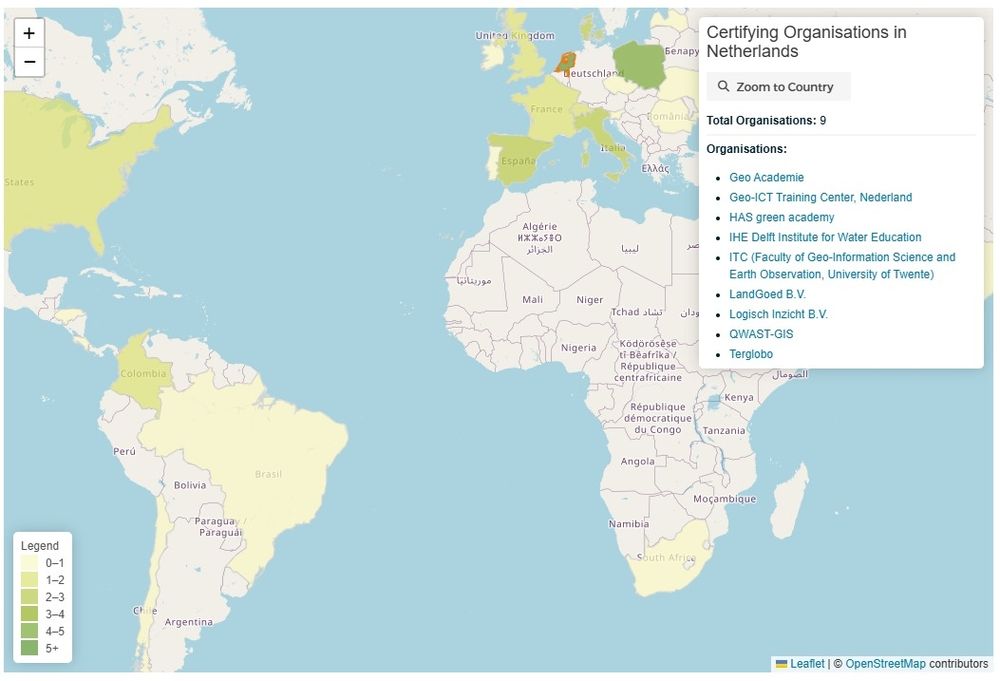
🚀 The new #QGIS Certification Programme Website is live!
🔍Easily find training courses:
🗺 Use an interactive map to find certified training providers.
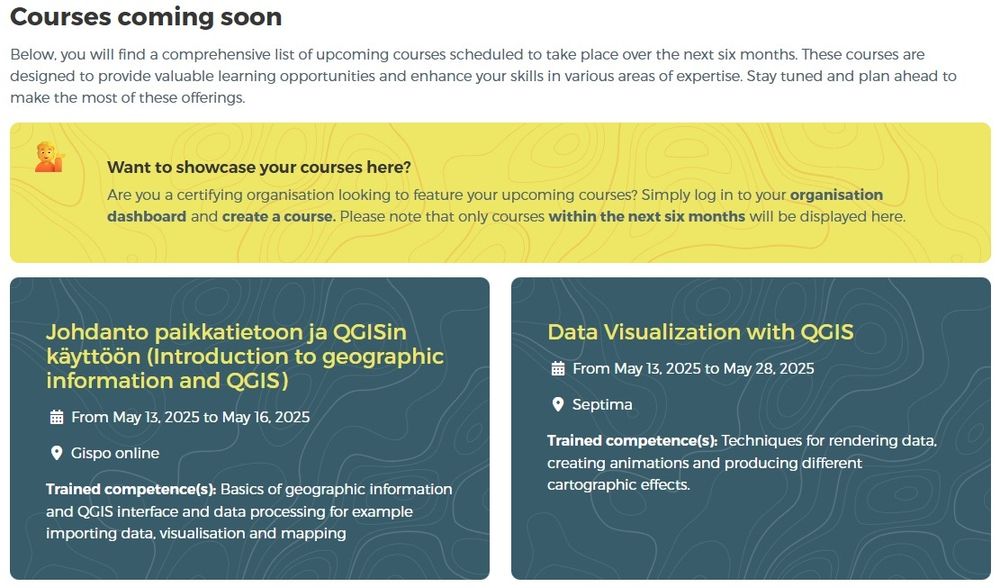
📅 Check out upcoming courses offering official QGIS certification.
🫶🏼 Thanks Lova, @timlinux.bsky.social & others!
🔗 certification.qgis.org
🔍Easily find training courses:
🗺 Use an interactive map to find certified training providers.
📅 Check out upcoming courses offering official QGIS certification.
🫶🏼 Thanks Lova, @timlinux.bsky.social & others!
🔗 certification.qgis.org
May 10, 2025 at 9:52 AM
🚀 The new #QGIS Certification Programme Website is live!
🔍Easily find training courses:
🗺 Use an interactive map to find certified training providers.
📅 Check out upcoming courses offering official QGIS certification.
🫶🏼 Thanks Lova, @timlinux.bsky.social & others!
🔗 certification.qgis.org
🔍Easily find training courses:
🗺 Use an interactive map to find certified training providers.
📅 Check out upcoming courses offering official QGIS certification.
🫶🏼 Thanks Lova, @timlinux.bsky.social & others!
🔗 certification.qgis.org