


Morgan Barry
@morganabigail.bsky.social
🌊 Meteorologist | 🤷🏼♀️ Obnoxiously overuse y'all | 💁🏼♀️ Specialize in sarcasm
Reposted by Morgan Barry

What is poor practice during Hurricane season is also poor practice in Winter Season.
Do not share deterministic models forecasts >5-7 days out. Snowfall maps are an especially poor choice of model graphic to share with much lead time.
My 2️⃣🪙
Do not share deterministic models forecasts >5-7 days out. Snowfall maps are an especially poor choice of model graphic to share with much lead time.
My 2️⃣🪙
There is a reason why most (unfortunately I can’t say all) #meteorologists don’t show extended range ensemble forecasts for a reason. Even if a disclaimer like “this is not a forecast” is given, the forecast is still being shown and could be misinterpreted as such. 😒

November 24, 2025 at 9:34 PM
What is poor practice during Hurricane season is also poor practice in Winter Season.
Do not share deterministic models forecasts >5-7 days out. Snowfall maps are an especially poor choice of model graphic to share with much lead time.
My 2️⃣🪙
Do not share deterministic models forecasts >5-7 days out. Snowfall maps are an especially poor choice of model graphic to share with much lead time.
My 2️⃣🪙
Reposted by Morgan Barry

There is a reason why most (unfortunately I can’t say all) #meteorologists don’t show extended range ensemble forecasts for a reason. Even if a disclaimer like “this is not a forecast” is given, the forecast is still being shown and could be misinterpreted as such. 😒
November 24, 2025 at 9:19 PM
There is a reason why most (unfortunately I can’t say all) #meteorologists don’t show extended range ensemble forecasts for a reason. Even if a disclaimer like “this is not a forecast” is given, the forecast is still being shown and could be misinterpreted as such. 😒
Reposted by Morgan Barry
The National Hurricane Center has put together a 2025 Verification Preview.
Covers a prelim view on seasonal track, intensity, & genesis 🌀forecasts. Also touching on rapid intensification forecasts & Melissa which was the most impactful storm of the year.
URL: www.nhc.noaa.gov/pdf/NHC_Veri...
Covers a prelim view on seasonal track, intensity, & genesis 🌀forecasts. Also touching on rapid intensification forecasts & Melissa which was the most impactful storm of the year.
URL: www.nhc.noaa.gov/pdf/NHC_Veri...


November 25, 2025 at 3:28 AM
The National Hurricane Center has put together a 2025 Verification Preview.
Covers a prelim view on seasonal track, intensity, & genesis 🌀forecasts. Also touching on rapid intensification forecasts & Melissa which was the most impactful storm of the year.
URL: www.nhc.noaa.gov/pdf/NHC_Veri...
Covers a prelim view on seasonal track, intensity, & genesis 🌀forecasts. Also touching on rapid intensification forecasts & Melissa which was the most impactful storm of the year.
URL: www.nhc.noaa.gov/pdf/NHC_Veri...
I've already watched The Devil Wears Prada and Miss Congeniality and am now onto Clueless on this long flight.
I refuse to watch anything serious 😂
I refuse to watch anything serious 😂

clueless poster with a woman in a yellow plaid jacket
ALT: clueless poster with a woman in a yellow plaid jacket
media.tenor.com
November 24, 2025 at 4:53 AM
I've already watched The Devil Wears Prada and Miss Congeniality and am now onto Clueless on this long flight.
I refuse to watch anything serious 😂
I refuse to watch anything serious 😂
Reposted by Morgan Barry

A horrific accident early Saturday morning left a car in the side of an NWS office and the office relying on the NWS service backup system. Service backup is important in situations like this - but also is being increasingly used due to NWS staffing and infrastructure issues. tinyurl.com/4txuyhbz

Tragic vehicle accident takes an NWS office offline
Looking at how the NWS offices back each other up. Severe weather and flash flooding in the south central US next couple of days.
tinyurl.com
November 23, 2025 at 7:02 PM
A horrific accident early Saturday morning left a car in the side of an NWS office and the office relying on the NWS service backup system. Service backup is important in situations like this - but also is being increasingly used due to NWS staffing and infrastructure issues. tinyurl.com/4txuyhbz
Reposted by Morgan Barry
That’s a lot of intense hurricanes over the past 5 years 😵💫
We added 4 more to the list this year, #Erin, #Gabrielle, #Humberto, & #Melissa.
We added 4 more to the list this year, #Erin, #Gabrielle, #Humberto, & #Melissa.

Every Category 4 and 5 Atlantic hurricane since 2020, all together, in one group photo.
H/t to @ferragamowx.bsky.social for the inspiration.
H/t to @ferragamowx.bsky.social for the inspiration.

November 21, 2025 at 5:35 PM
That’s a lot of intense hurricanes over the past 5 years 😵💫
We added 4 more to the list this year, #Erin, #Gabrielle, #Humberto, & #Melissa.
We added 4 more to the list this year, #Erin, #Gabrielle, #Humberto, & #Melissa.
Reposted by Morgan Barry

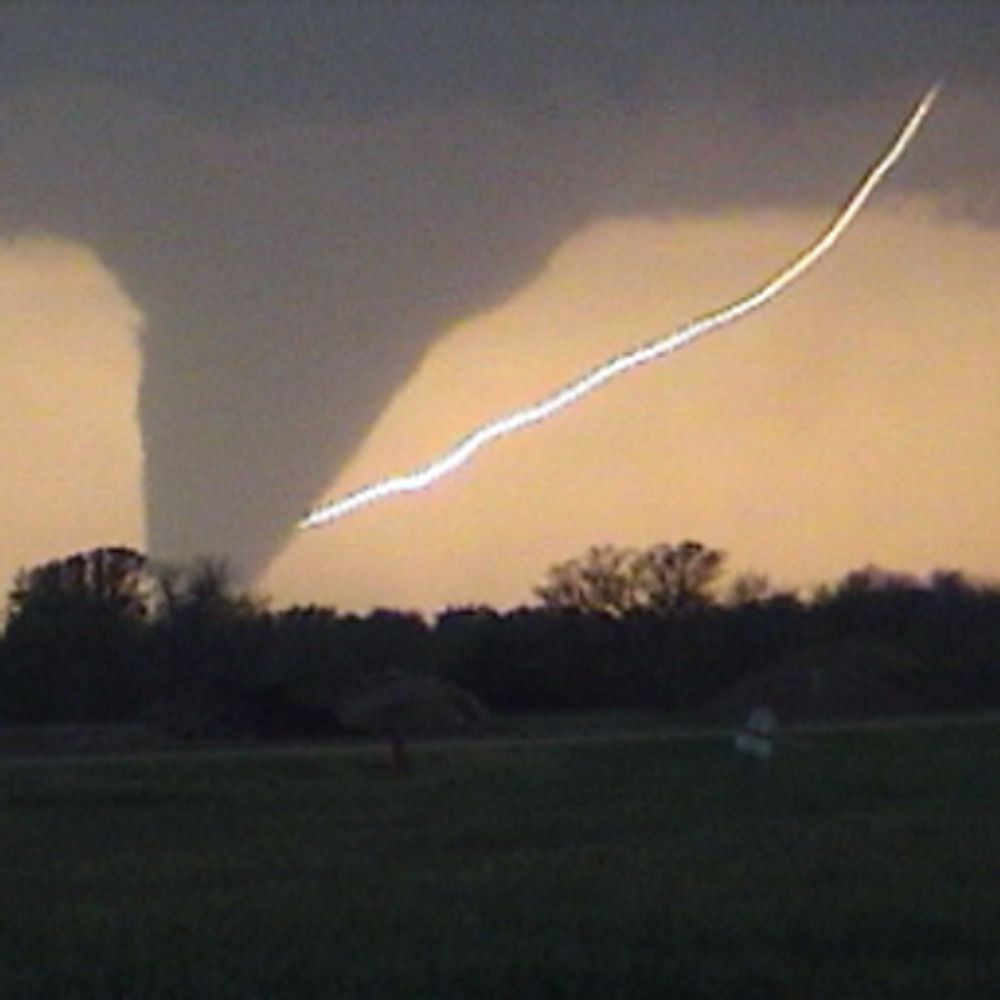
Ever feel like your town gets more nighttime tornadoes than others?
Here's a map of tornadoes by time of day (nighttime tors are plotted on top of daytime tors to stand out). I feel for you Tulsa, Jackson, Birmingham, Nashville...
Here's a map of tornadoes by time of day (nighttime tors are plotted on top of daytime tors to stand out). I feel for you Tulsa, Jackson, Birmingham, Nashville...

November 20, 2025 at 7:56 PM
Ever feel like your town gets more nighttime tornadoes than others?
Here's a map of tornadoes by time of day (nighttime tors are plotted on top of daytime tors to stand out). I feel for you Tulsa, Jackson, Birmingham, Nashville...
Here's a map of tornadoes by time of day (nighttime tors are plotted on top of daytime tors to stand out). I feel for you Tulsa, Jackson, Birmingham, Nashville...
Reposted by Morgan Barry

Possible goofballs in northwest Tennessee

November 19, 2025 at 2:54 AM
Possible goofballs in northwest Tennessee
Reposted by Morgan Barry

What was the weather like on your birthday? Now you can find out!
During the shutdown, I forced myself to stay agile in data science tech, like AWS, Google, and Open AI.
I made a notebook that gets weather for the day/location of your birth, using multiple NOAA sources.
github.com/jjrennie/bir...
During the shutdown, I forced myself to stay agile in data science tech, like AWS, Google, and Open AI.
I made a notebook that gets weather for the day/location of your birth, using multiple NOAA sources.
github.com/jjrennie/bir...


November 13, 2025 at 8:13 PM
What was the weather like on your birthday? Now you can find out!
During the shutdown, I forced myself to stay agile in data science tech, like AWS, Google, and Open AI.
I made a notebook that gets weather for the day/location of your birth, using multiple NOAA sources.
github.com/jjrennie/bir...
During the shutdown, I forced myself to stay agile in data science tech, like AWS, Google, and Open AI.
I made a notebook that gets weather for the day/location of your birth, using multiple NOAA sources.
github.com/jjrennie/bir...
Reposted by Morgan Barry

My favorite four from Tuesday night ❤️


November 14, 2025 at 12:22 AM
My favorite four from Tuesday night ❤️
Reposted by Morgan Barry
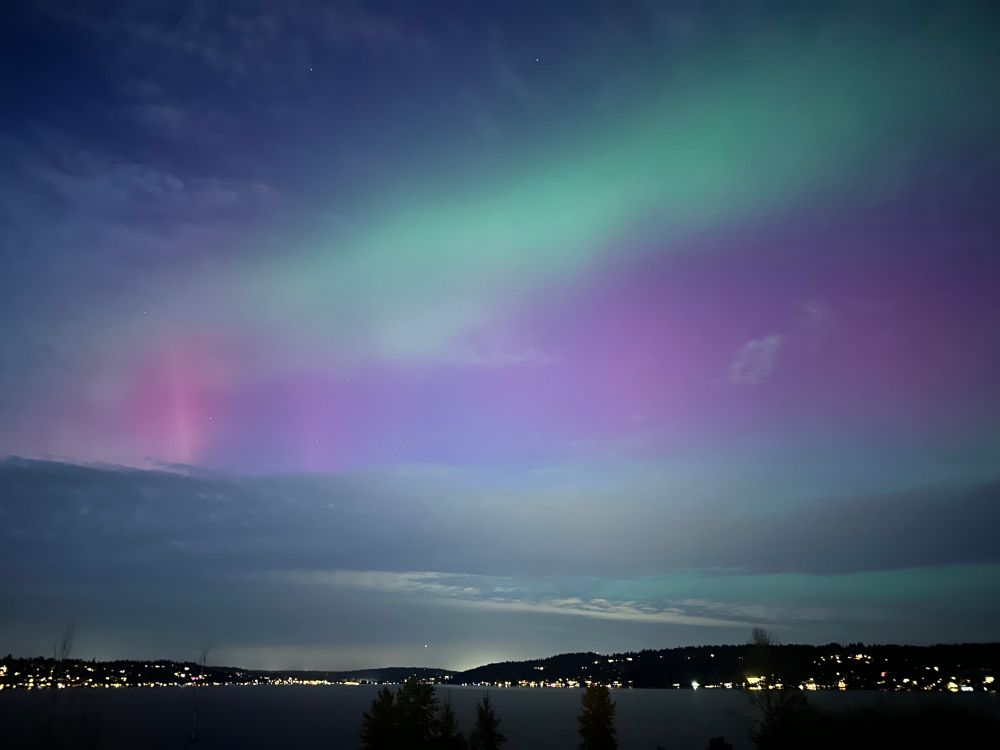
you know what’s extra crazy about this photo… this is the view looking SOUTH
almost the entire aurora arc is SOUTH of Great Falls, MONTANA
almost the entire aurora arc is SOUTH of Great Falls, MONTANA

November 12, 2025 at 4:12 AM
you know what’s extra crazy about this photo… this is the view looking SOUTH
almost the entire aurora arc is SOUTH of Great Falls, MONTANA
almost the entire aurora arc is SOUTH of Great Falls, MONTANA
Reposted by Morgan Barry


Reposted by Morgan Barry

Views of the Aurora Borealis from NWS Seattle!
November 12, 2025 at 1:48 AM
Views of the Aurora Borealis from NWS Seattle!
Reposted by Morgan Barry

Spectacular auroral display - 7:15-7:30p MT from the north end of Erie, CO.


November 12, 2025 at 2:36 AM
Spectacular auroral display - 7:15-7:30p MT from the north end of Erie, CO.
Reposted by Morgan Barry

Sometimes the best events are the unexpected ones. The green embedded within the reds/pinks was the best I’ve ever seen.
From Lafayette, CO.
From Lafayette, CO.

November 12, 2025 at 3:56 AM
Sometimes the best events are the unexpected ones. The green embedded within the reds/pinks was the best I’ve ever seen.
From Lafayette, CO.
From Lafayette, CO.
Seeing the aurora from the office wasn't on my to-do list for tonight. Absolutely wild that it was viewable all the way down in Mobile. 🤩

November 12, 2025 at 3:39 AM
Seeing the aurora from the office wasn't on my to-do list for tonight. Absolutely wild that it was viewable all the way down in Mobile. 🤩
Reposted by Morgan Barry
Day 40 of the shutdown, that’s 2 missed paychecks and part of a third. Federal employees (including my colleagues at the National Weather Service) continue working without knowing when they’ll be paid, or are furloughed. If you know someone affected, please check in on them. #GovernmentShutdown2025

November 9, 2025 at 5:26 PM
Day 40 of the shutdown, that’s 2 missed paychecks and part of a third. Federal employees (including my colleagues at the National Weather Service) continue working without knowing when they’ll be paid, or are furloughed. If you know someone affected, please check in on them. #GovernmentShutdown2025
Reposted by Morgan Barry
I did a post this morning talking about the science of how Doppler weather radar could be used to monitor the impacts from the tragic UPS crash, and how these same concepts can help improve our readiness and response to other non-weather threats. tinyurl.com/55f2cuu3

Positive update on the surface observation contract situation in the Mid-Atlantic, and using weather radar to track the impacts of the tragic UPS crash.
Kalmaegi intensifying as it approaches Vietnam, and next system still looks to be a major threat to northern Philippines.
tinyurl.com
November 6, 2025 at 2:28 AM
I did a post this morning talking about the science of how Doppler weather radar could be used to monitor the impacts from the tragic UPS crash, and how these same concepts can help improve our readiness and response to other non-weather threats. tinyurl.com/55f2cuu3
Reposted by Morgan Barry
A nearly one-week animation for Hurricane Melissa with infrared (IR) imagery on the left and its maximum wind speed (intensity) evolution on the right. The animation briefly pauses at landfall in Jamaica.
IR images extend about 600 km from the center of the storm to illustrate its shape evolution.
IR images extend about 600 km from the center of the storm to illustrate its shape evolution.
October 30, 2025 at 3:03 PM
A nearly one-week animation for Hurricane Melissa with infrared (IR) imagery on the left and its maximum wind speed (intensity) evolution on the right. The animation briefly pauses at landfall in Jamaica.
IR images extend about 600 km from the center of the storm to illustrate its shape evolution.
IR images extend about 600 km from the center of the storm to illustrate its shape evolution.
Reposted by Morgan Barry
NOAA Hurricane Hunters going through this 👇 to collect valuable scientific data to help forecast Hurricane #Melissa. 🧪

THEY. WERE. DOING. THIS. WITHOUT. PAY.
NOAA’s hurricane hunter pilots (and Kermit The Frog hanging from the control panel) fly into Hurricane Melissa.
Extraordinary bravery, saving lives.
(🎥 Cmdr. Danielle Varwig, NOAA Corps).
NOAA’s hurricane hunter pilots (and Kermit The Frog hanging from the control panel) fly into Hurricane Melissa.
Extraordinary bravery, saving lives.
(🎥 Cmdr. Danielle Varwig, NOAA Corps).
October 30, 2025 at 4:36 PM
NOAA Hurricane Hunters going through this 👇 to collect valuable scientific data to help forecast Hurricane #Melissa. 🧪
Reposted by Morgan Barry
Inspired by Brian's chart, I investigated how much time North Atlantic named storms spent at hurricane and at major hurricane strength during 1966-2025.
Blue = proportion for "hurricane time" (category 1-5).
Orange = proportion for "major hurricane time" (category 3-5).
More details in alt text!
Blue = proportion for "hurricane time" (category 1-5).
Orange = proportion for "major hurricane time" (category 3-5).
More details in alt text!

October 30, 2025 at 4:31 PM
Inspired by Brian's chart, I investigated how much time North Atlantic named storms spent at hurricane and at major hurricane strength during 1966-2025.
Blue = proportion for "hurricane time" (category 1-5).
Orange = proportion for "major hurricane time" (category 3-5).
More details in alt text!
Blue = proportion for "hurricane time" (category 1-5).
Orange = proportion for "major hurricane time" (category 3-5).
More details in alt text!
Reposted by Morgan Barry
Annotating a long 3+ day loop of #Hurricane #Melissa from Kingston, #Jamaica radar.
2️⃣ periods appear where an eyewall replacement cycle, #ERC, looked underway. In both cases, inner eyewall stayed intact & outer bands merged, resulting in a larger eye & strengthening after.
A remarkable evolution 🌀
2️⃣ periods appear where an eyewall replacement cycle, #ERC, looked underway. In both cases, inner eyewall stayed intact & outer bands merged, resulting in a larger eye & strengthening after.
A remarkable evolution 🌀
October 30, 2025 at 6:54 AM
Annotating a long 3+ day loop of #Hurricane #Melissa from Kingston, #Jamaica radar.
2️⃣ periods appear where an eyewall replacement cycle, #ERC, looked underway. In both cases, inner eyewall stayed intact & outer bands merged, resulting in a larger eye & strengthening after.
A remarkable evolution 🌀
2️⃣ periods appear where an eyewall replacement cycle, #ERC, looked underway. In both cases, inner eyewall stayed intact & outer bands merged, resulting in a larger eye & strengthening after.
A remarkable evolution 🌀
Reposted by Morgan Barry

NOAA’s hurricane research division staff has been cut from 52 in 2020 to 28 in 2025, almost a 50% cut. They’ve resorted to using volunteers to man the critical radar and dropsonde stations on Hurricane Hunter flights. Senseless cuts in an era of climate change making the strongest storms stronger.

Volunteers Step In to Help Understaffed NOAA Track Hurricane Melissa
www.nytimes.com
October 29, 2025 at 1:45 AM
NOAA’s hurricane research division staff has been cut from 52 in 2020 to 28 in 2025, almost a 50% cut. They’ve resorted to using volunteers to man the critical radar and dropsonde stations on Hurricane Hunter flights. Senseless cuts in an era of climate change making the strongest storms stronger.
Reposted by Morgan Barry

Alrighty, ready to see something really cool? (and maybe a little nauseating)
The evolution of Hurricane Melissa's mesovortices at peak strength.
The evolution of Hurricane Melissa's mesovortices at peak strength.
October 29, 2025 at 8:10 PM
Alrighty, ready to see something really cool? (and maybe a little nauseating)
The evolution of Hurricane Melissa's mesovortices at peak strength.
The evolution of Hurricane Melissa's mesovortices at peak strength.
Reposted by Morgan Barry

Saw something very similar after Hurricane Ian in 2022. New NOAA-funded research published in March found this sort of upwelling from strong hurricanes (causing the aquamarine color) and engorged river runoff stimulate phytoplankton blooms, leading to severe red tide outbreaks.
In the wake of Hurricane Melissa yesterday, runoff flows from the south of Jamaica and into the Caribbean Sea, while upwelling of the seafloor can be seen nearby.
This startling imagery was captured by the NOAA-20 and NOAA-21 polar-orbiting satellites.
This startling imagery was captured by the NOAA-20 and NOAA-21 polar-orbiting satellites.
October 29, 2025 at 10:00 PM
Saw something very similar after Hurricane Ian in 2022. New NOAA-funded research published in March found this sort of upwelling from strong hurricanes (causing the aquamarine color) and engorged river runoff stimulate phytoplankton blooms, leading to severe red tide outbreaks.