


𝚖𝚊𝚌𝚔𝚊 𝚜𝚣𝚎𝚌𝚑𝚗𝚘
@mackaszechno.bsky.social
#rstats geospatial data analyst. GIS expert, of a sort. Sci-fi fan and would be writer. Black cat owner. Occasionally apocalyptical. Can't DM.
WORDS ARE QUICK AND WORDS ARE VAIN, THE SINGLE SURE AND FINAL ANSWER MUST BE PAIN. -Dan Simmons, Olympos
WORDS ARE QUICK AND WORDS ARE VAIN, THE SINGLE SURE AND FINAL ANSWER MUST BE PAIN. -Dan Simmons, Olympos
Pinned

Reposted by 𝚖𝚊𝚌𝚔𝚊 𝚜𝚣𝚎𝚌𝚑𝚗𝚘

Visualizing US electric power transmission lines for Day 26 of #30DayMapChallenge: Transport
A few mapgl tips in this one:
- To achieve a "glow effect" for the lines, first add a blurred line using the `line_blur` parameter then add the same layer over it as an opaque line
A few mapgl tips in this one:
- To achieve a "glow effect" for the lines, first add a blurred line using the `line_blur` parameter then add the same layer over it as an opaque line
November 26, 2025 at 2:00 PM
Visualizing US electric power transmission lines for Day 26 of #30DayMapChallenge: Transport
A few mapgl tips in this one:
- To achieve a "glow effect" for the lines, first add a blurred line using the `line_blur` parameter then add the same layer over it as an opaque line
A few mapgl tips in this one:
- To achieve a "glow effect" for the lines, first add a blurred line using the `line_blur` parameter then add the same layer over it as an opaque line
Reposted by 𝚖𝚊𝚌𝚔𝚊 𝚜𝚣𝚎𝚌𝚑𝚗𝚘

If you missed my talk but still want some tips for writing good code for scientists, my slides are here:
daxkellie.quarto.pub/a-guide-to-w...
All the links and references are there too in case you want to see more! 😀🧪🌏
#ESA2025 #rstats #quartopub
daxkellie.quarto.pub/a-guide-to-w...
All the links and references are there too in case you want to see more! 😀🧪🌏
#ESA2025 #rstats #quartopub

November 26, 2025 at 6:12 AM
If you missed my talk but still want some tips for writing good code for scientists, my slides are here:
daxkellie.quarto.pub/a-guide-to-w...
All the links and references are there too in case you want to see more! 😀🧪🌏
#ESA2025 #rstats #quartopub
daxkellie.quarto.pub/a-guide-to-w...
All the links and references are there too in case you want to see more! 😀🧪🌏
#ESA2025 #rstats #quartopub
Reposted by 𝚖𝚊𝚌𝚔𝚊 𝚜𝚣𝚎𝚌𝚑𝚗𝚘


November 26, 2025 at 7:35 AM
Reposted by 𝚖𝚊𝚌𝚔𝚊 𝚜𝚣𝚎𝚌𝚑𝚗𝚘

Well, I just learned a new #rstats thing.
You can use group_by() to merge cells by a categorical variable:
dta_transcript_merged <- dta_transcript |>
group_by(idea_snippet, idea_theme) |>
summarise(
text = paste(text, collapse = " ")
) |>
ungroup()
...
You can use group_by() to merge cells by a categorical variable:
dta_transcript_merged <- dta_transcript |>
group_by(idea_snippet, idea_theme) |>
summarise(
text = paste(text, collapse = " ")
) |>
ungroup()
...
November 26, 2025 at 3:34 AM
Well, I just learned a new #rstats thing.
You can use group_by() to merge cells by a categorical variable:
dta_transcript_merged <- dta_transcript |>
group_by(idea_snippet, idea_theme) |>
summarise(
text = paste(text, collapse = " ")
) |>
ungroup()
...
You can use group_by() to merge cells by a categorical variable:
dta_transcript_merged <- dta_transcript |>
group_by(idea_snippet, idea_theme) |>
summarise(
text = paste(text, collapse = " ")
) |>
ungroup()
...
Reposted by 𝚖𝚊𝚌𝚔𝚊 𝚜𝚣𝚎𝚌𝚑𝚗𝚘

#30DayMapChallenge - Day 26 - Transport
During last year's challenge, I found a dataset for public transportation systems in Japan. With some patience and a translation app on my phone, I was able to make this map of the Shinkansen High Speed Rail.
During last year's challenge, I found a dataset for public transportation systems in Japan. With some patience and a translation app on my phone, I was able to make this map of the Shinkansen High Speed Rail.

November 26, 2025 at 3:15 AM
#30DayMapChallenge - Day 26 - Transport
During last year's challenge, I found a dataset for public transportation systems in Japan. With some patience and a translation app on my phone, I was able to make this map of the Shinkansen High Speed Rail.
During last year's challenge, I found a dataset for public transportation systems in Japan. With some patience and a translation app on my phone, I was able to make this map of the Shinkansen High Speed Rail.
Reposted by 𝚖𝚊𝚌𝚔𝚊 𝚜𝚣𝚎𝚌𝚑𝚗𝚘

At any rate, women attend college at higher rates. And my hypothesis is that women move to cities at higher rates as well. Maybe one day I will explore that idea.
I made this StoryMap about women's undergrad enrollment rates grad school.
storymaps.arcgis.com/stories/cf53...
I made this StoryMap about women's undergrad enrollment rates grad school.
storymaps.arcgis.com/stories/cf53...

Examining the Spatial Distribution of Women in College
Antonio A. Smith
storymaps.arcgis.com
November 25, 2025 at 8:53 PM
At any rate, women attend college at higher rates. And my hypothesis is that women move to cities at higher rates as well. Maybe one day I will explore that idea.
I made this StoryMap about women's undergrad enrollment rates grad school.
storymaps.arcgis.com/stories/cf53...
I made this StoryMap about women's undergrad enrollment rates grad school.
storymaps.arcgis.com/stories/cf53...
Reposted by 𝚖𝚊𝚌𝚔𝚊 𝚜𝚣𝚎𝚌𝚑𝚗𝚘

Stoked to announce the launch of our new short course, Introduction to Data Science 🚀
Designed to be delivered in 3-hour session but you can study at your own pace using online #opensource materials. Fully reproducible and deployed with GitHub actions: itsleeds.github.io/introds/ #datascience
Designed to be delivered in 3-hour session but you can study at your own pace using online #opensource materials. Fully reproducible and deployed with GitHub actions: itsleeds.github.io/introds/ #datascience


November 25, 2025 at 2:44 PM
Stoked to announce the launch of our new short course, Introduction to Data Science 🚀
Designed to be delivered in 3-hour session but you can study at your own pace using online #opensource materials. Fully reproducible and deployed with GitHub actions: itsleeds.github.io/introds/ #datascience
Designed to be delivered in 3-hour session but you can study at your own pace using online #opensource materials. Fully reproducible and deployed with GitHub actions: itsleeds.github.io/introds/ #datascience
Reposted by 𝚖𝚊𝚌𝚔𝚊 𝚜𝚣𝚎𝚌𝚑𝚗𝚘
Over the past 2.5 years I've been hosting Census data, web mapping, and Shiny workshops.
I'm giving my biggest discount ever on all the recordings + tutorials this week - I appreciate you checking them out!
This year: walkerdata.gumroad.c...
Past years: walkerdata.gumroad.c...
I'm giving my biggest discount ever on all the recordings + tutorials this week - I appreciate you checking them out!
This year: walkerdata.gumroad.c...
Past years: walkerdata.gumroad.c...


November 24, 2025 at 9:54 PM
Over the past 2.5 years I've been hosting Census data, web mapping, and Shiny workshops.
I'm giving my biggest discount ever on all the recordings + tutorials this week - I appreciate you checking them out!
This year: walkerdata.gumroad.c...
Past years: walkerdata.gumroad.c...
I'm giving my biggest discount ever on all the recordings + tutorials this week - I appreciate you checking them out!
This year: walkerdata.gumroad.c...
Past years: walkerdata.gumroad.c...
Reposted by 𝚖𝚊𝚌𝚔𝚊 𝚜𝚣𝚎𝚌𝚑𝚗𝚘
video tutorial: riverside.fm/shared/expor...

Map Challenge: Hexagons | Nov 25, 2025 001 - Riverside - HD Podcast & Video Software
riverside.fm
November 25, 2025 at 5:32 PM
video tutorial: riverside.fm/shared/expor...
Reposted by 𝚖𝚊𝚌𝚔𝚊 𝚜𝚣𝚎𝚌𝚑𝚗𝚘
Mapping US wind energy infrastructure with H3 hexagons for #30DayMapChallenge Day 25.
Turbines and their capacity are aggregated by H3 level; we apply a "fade effect" as the user zooms to reveal smaller hexagons then individual turbines.
Posting a tutorial later today!
Turbines and their capacity are aggregated by H3 level; we apply a "fade effect" as the user zooms to reveal smaller hexagons then individual turbines.
Posting a tutorial later today!
November 25, 2025 at 2:14 PM
Mapping US wind energy infrastructure with H3 hexagons for #30DayMapChallenge Day 25.
Turbines and their capacity are aggregated by H3 level; we apply a "fade effect" as the user zooms to reveal smaller hexagons then individual turbines.
Posting a tutorial later today!
Turbines and their capacity are aggregated by H3 level; we apply a "fade effect" as the user zooms to reveal smaller hexagons then individual turbines.
Posting a tutorial later today!
Proximity of addresses around target location anonymised by count inside hexbin. Rings show 0-0.5, 0.5-0.75, 0.75-1, 1-2, and 2-3 miles from target.
#30DayMapChallenge | Day 25 - Hexagons #rstats
#30DayMapChallenge | Day 25 - Hexagons #rstats

November 25, 2025 at 3:00 PM
Proximity of addresses around target location anonymised by count inside hexbin. Rings show 0-0.5, 0.5-0.75, 0.75-1, 1-2, and 2-3 miles from target.
#30DayMapChallenge | Day 25 - Hexagons #rstats
#30DayMapChallenge | Day 25 - Hexagons #rstats
Place names in West Sussex in English, Korean, and Ukrainian.
Plus a very lightly modified maplibregl js example of the same.
#30DayMapChallenge | Day 24 - Places and their names #rstats
(code in alt)
Plus a very lightly modified maplibregl js example of the same.
#30DayMapChallenge | Day 24 - Places and their names #rstats
(code in alt)

![<script>
const map = new maplibregl.Map({
container: 'map',
style: 'https://tiles.openfreemap.org/styles/bright',
center: [16.05, 48],
zoom: 2.9
});
document
.getElementById('buttons')
.addEventListener('click', (event) => {
const language = event.target.id.substr('button-'.length);
// Use setLayoutProperty to set the value of a layout property in a style layer.
// The three arguments are the id of the layer, the name of the layout property,
// and the new property value.
map.setLayoutProperty('label_country_1', 'text-field', [
'get',
`name:${language}`
]);
map.setLayoutProperty('label_country_2', 'text-field', [
'get',
`name:${language}`
]);
map.setLayoutProperty('label_country_3', 'text-field', [
'get',
`name:${language}`
]);
});
</script>](https://cdn.bsky.app/img/feed_thumbnail/plain/did:plc:lxpjtgfvz63z7zauo673qkfo/bafkreicy4araka7mf6snvteuurt646v7n3lg3zrv3lwzule2zipk3xnq5u@jpeg)
November 25, 2025 at 2:53 PM
Place names in West Sussex in English, Korean, and Ukrainian.
Plus a very lightly modified maplibregl js example of the same.
#30DayMapChallenge | Day 24 - Places and their names #rstats
(code in alt)
Plus a very lightly modified maplibregl js example of the same.
#30DayMapChallenge | Day 24 - Places and their names #rstats
(code in alt)

Reposted by 𝚖𝚊𝚌𝚔𝚊 𝚜𝚣𝚎𝚌𝚑𝚗𝚘

No, YOU'RE crying on the train into work...
xkcd.com/3172/
xkcd.com/3172/

Fifteen Years
xkcd.com
November 25, 2025 at 9:35 AM
No, YOU'RE crying on the train into work...
xkcd.com/3172/
xkcd.com/3172/
Reposted by 𝚖𝚊𝚌𝚔𝚊 𝚜𝚣𝚎𝚌𝚑𝚗𝚘
Every transport system has to deal with changes in elevation leading to slopes, also known as gradients. Even in the Netherlands, which is often described as being 'flat as a pancake', there are slopes on roads. Reproducible code using our {slopes} #rstats package: github.com/ropensci/slo...

November 25, 2025 at 8:37 AM
Every transport system has to deal with changes in elevation leading to slopes, also known as gradients. Even in the Netherlands, which is often described as being 'flat as a pancake', there are slopes on roads. Reproducible code using our {slopes} #rstats package: github.com/ropensci/slo...
Reposted by 𝚖𝚊𝚌𝚔𝚊 𝚜𝚣𝚎𝚌𝚑𝚗𝚘

#30DayMapChallenge Day 8: Urban
Inspired by the Morphocode Explorer, I’m building a Freiburg-focused remix using open data. Still early, but learning a ton already!
Tech: OSM, Freiburg Open Data · #Svelte · MapLibre · Turf.js · Tileserver-GL
#Urban #UrbanData #WebMapping #Geospatial #GIS #DataViz
Inspired by the Morphocode Explorer, I’m building a Freiburg-focused remix using open data. Still early, but learning a ton already!
Tech: OSM, Freiburg Open Data · #Svelte · MapLibre · Turf.js · Tileserver-GL
#Urban #UrbanData #WebMapping #Geospatial #GIS #DataViz
November 25, 2025 at 6:45 AM
#30DayMapChallenge Day 8: Urban
Inspired by the Morphocode Explorer, I’m building a Freiburg-focused remix using open data. Still early, but learning a ton already!
Tech: OSM, Freiburg Open Data · #Svelte · MapLibre · Turf.js · Tileserver-GL
#Urban #UrbanData #WebMapping #Geospatial #GIS #DataViz
Inspired by the Morphocode Explorer, I’m building a Freiburg-focused remix using open data. Still early, but learning a ton already!
Tech: OSM, Freiburg Open Data · #Svelte · MapLibre · Turf.js · Tileserver-GL
#Urban #UrbanData #WebMapping #Geospatial #GIS #DataViz
Reposted by 𝚖𝚊𝚌𝚔𝚊 𝚜𝚣𝚎𝚌𝚑𝚗𝚘

Seems the DeFlock app supports quickly adding Flock Ravens, the gunshot detectors all over the East End of RVA that are leaking west into the downtown wards.
deflock.me/app
deflock.me/app

November 25, 2025 at 12:17 AM
Seems the DeFlock app supports quickly adding Flock Ravens, the gunshot detectors all over the East End of RVA that are leaking west into the downtown wards.
deflock.me/app
deflock.me/app
Reposted by 𝚖𝚊𝚌𝚔𝚊 𝚜𝚣𝚎𝚌𝚑𝚗𝚘
For Day 24 of #30DayMapChallenge: Places and their names, a labeling trick in mapgl you can try.
Use the TurfJS integration in the package to dynamically compute centroids for your layer then use them as a symbol layer to label your polygons.
Try it: gist.github.com/walkerke/b77...
Use the TurfJS integration in the package to dynamically compute centroids for your layer then use them as a symbol layer to label your polygons.
Try it: gist.github.com/walkerke/b77...
November 24, 2025 at 1:12 PM
For Day 24 of #30DayMapChallenge: Places and their names, a labeling trick in mapgl you can try.
Use the TurfJS integration in the package to dynamically compute centroids for your layer then use them as a symbol layer to label your polygons.
Try it: gist.github.com/walkerke/b77...
Use the TurfJS integration in the package to dynamically compute centroids for your layer then use them as a symbol layer to label your polygons.
Try it: gist.github.com/walkerke/b77...
Reposted by 𝚖𝚊𝚌𝚔𝚊 𝚜𝚣𝚎𝚌𝚑𝚗𝚘

There are 10.990 municipalities in Germany.
From Berlin to the smallest municipality. All their names are shown in this map. The 50 largest cities’ names appear one after the other, after that they appear in chunks of increasing size.
#30DayMapChallenge Day 24: Places and their names #ggplot2
From Berlin to the smallest municipality. All their names are shown in this map. The 50 largest cities’ names appear one after the other, after that they appear in chunks of increasing size.
#30DayMapChallenge Day 24: Places and their names #ggplot2
November 24, 2025 at 11:22 AM
There are 10.990 municipalities in Germany.
From Berlin to the smallest municipality. All their names are shown in this map. The 50 largest cities’ names appear one after the other, after that they appear in chunks of increasing size.
#30DayMapChallenge Day 24: Places and their names #ggplot2
From Berlin to the smallest municipality. All their names are shown in this map. The 50 largest cities’ names appear one after the other, after that they appear in chunks of increasing size.
#30DayMapChallenge Day 24: Places and their names #ggplot2
Reposted by 𝚖𝚊𝚌𝚔𝚊 𝚜𝚣𝚎𝚌𝚑𝚗𝚘

#30DayMapChallenge Day 22/23, Natural Earth & Process
Uploaded a tutorial of how I made my typhoon map using data from Natural Earth and Copernicus, check it out: m.youtube.com/watch?v=efiG...
Uploaded a tutorial of how I made my typhoon map using data from Natural Earth and Copernicus, check it out: m.youtube.com/watch?v=efiG...

How to Animate Copernicus Wind Data in QGIS
YouTube video by Chiara Phillips
m.youtube.com
November 24, 2025 at 3:30 AM
#30DayMapChallenge Day 22/23, Natural Earth & Process
Uploaded a tutorial of how I made my typhoon map using data from Natural Earth and Copernicus, check it out: m.youtube.com/watch?v=efiG...
Uploaded a tutorial of how I made my typhoon map using data from Natural Earth and Copernicus, check it out: m.youtube.com/watch?v=efiG...
Reposted by 𝚖𝚊𝚌𝚔𝚊 𝚜𝚣𝚎𝚌𝚑𝚗𝚘

Day 24 #30DayMapChallenge - Places and their names, or in Olde English...
Settlements of olde bearing the '-ing' suffix in the shire of Sussex
#rstats #dataviz
Settlements of olde bearing the '-ing' suffix in the shire of Sussex
#rstats #dataviz

November 24, 2025 at 8:15 AM
Day 24 #30DayMapChallenge - Places and their names, or in Olde English...
Settlements of olde bearing the '-ing' suffix in the shire of Sussex
#rstats #dataviz
Settlements of olde bearing the '-ing' suffix in the shire of Sussex
#rstats #dataviz
Reposted by 𝚖𝚊𝚌𝚔𝚊 𝚜𝚣𝚎𝚌𝚑𝚗𝚘
Data from project line work, 1981 style by the MVP, Daniel Huffman! www.projectlinework.org

Project Linework
A library of handcrafted vector linework for cartography, each designed in a unique aesthetic style. They are meant to break us away from default line paths that we so often rely on by providing more ...
www.projectlinework.org
November 19, 2025 at 12:35 PM
Data from project line work, 1981 style by the MVP, Daniel Huffman! www.projectlinework.org
Reposted by 𝚖𝚊𝚌𝚔𝚊 𝚜𝚣𝚎𝚌𝚑𝚗𝚘

What are the most exciting trends you’re seeing in spatial data science lately?
Some of mine:
- New file formats (e.g. #geoparquet)
- Geospatial DBs (e.g. #duckdb + spatial)
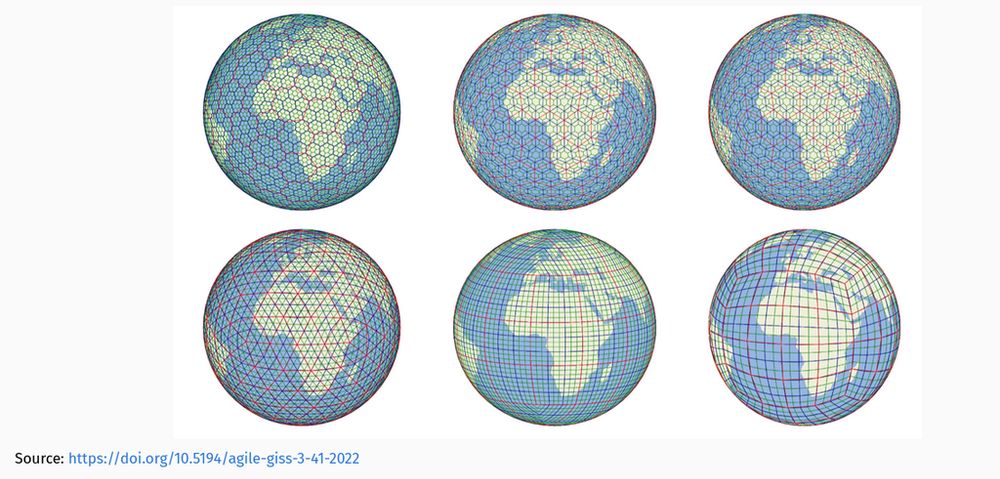
- Global discrete grids
What would you add?
#geospatial #gischat #rspatial #geopython
Some of mine:
- New file formats (e.g. #geoparquet)
- Geospatial DBs (e.g. #duckdb + spatial)
- Global discrete grids
What would you add?
#geospatial #gischat #rspatial #geopython
November 19, 2025 at 2:04 PM
What are the most exciting trends you’re seeing in spatial data science lately?
Some of mine:
- New file formats (e.g. #geoparquet)
- Geospatial DBs (e.g. #duckdb + spatial)
- Global discrete grids
What would you add?
#geospatial #gischat #rspatial #geopython
Some of mine:
- New file formats (e.g. #geoparquet)
- Geospatial DBs (e.g. #duckdb + spatial)
- Global discrete grids
What would you add?
#geospatial #gischat #rspatial #geopython
Started by uploading CSVs to free website to create weekly map. Website shut down. Moved to writing own GoogleMaps webpages. Google demanded credit card. Learnt Leafletjs instead. Landed a job doing GIS. Learnt GIS and R at the same time. Found my vocation in #rspatial with a side-order of GIS.


November 23, 2025 at 8:04 PM
Started by uploading CSVs to free website to create weekly map. Website shut down. Moved to writing own GoogleMaps webpages. Google demanded credit card. Learnt Leafletjs instead. Landed a job doing GIS. Learnt GIS and R at the same time. Found my vocation in #rspatial with a side-order of GIS.
Reposted by 𝚖𝚊𝚌𝚔𝚊 𝚜𝚣𝚎𝚌𝚑𝚗𝚘
The story map feature in the #rstats mapgl package is a tremendous teaching tool.
Teach your students geographic concepts while visualizing those concepts in real-time.
Check out this Census mapping story map tutorial for #30DayMapChallenge Day 23: Process.
Teach your students geographic concepts while visualizing those concepts in real-time.
Check out this Census mapping story map tutorial for #30DayMapChallenge Day 23: Process.
November 23, 2025 at 7:44 PM
The story map feature in the #rstats mapgl package is a tremendous teaching tool.
Teach your students geographic concepts while visualizing those concepts in real-time.
Check out this Census mapping story map tutorial for #30DayMapChallenge Day 23: Process.
Teach your students geographic concepts while visualizing those concepts in real-time.
Check out this Census mapping story map tutorial for #30DayMapChallenge Day 23: Process.