


Tan G.
@tangandhara.bsky.social
Data analyst and data viz geek
And that's enough maps for today
November 10, 2025 at 9:49 PM
And that's enough maps for today
Day 9 #30DayMapChallenge - Analog(ue)
I could've drawn the map but this was quicker to help me catch up but much less fun. I used {roughsf} to draw and colour in the continents.
schochastics.github.io/roughsf/
#rstats #dataviz
I could've drawn the map but this was quicker to help me catch up but much less fun. I used {roughsf} to draw and colour in the continents.
schochastics.github.io/roughsf/
#rstats #dataviz

November 10, 2025 at 9:43 PM
Day 9 #30DayMapChallenge - Analog(ue)
I could've drawn the map but this was quicker to help me catch up but much less fun. I used {roughsf} to draw and colour in the continents.
schochastics.github.io/roughsf/
#rstats #dataviz
I could've drawn the map but this was quicker to help me catch up but much less fun. I used {roughsf} to draw and colour in the continents.
schochastics.github.io/roughsf/
#rstats #dataviz
Day 8 #30DayMapChallenge - Urban Density
I followed a guide to plot the density of buildings in Worthing but I quite liked it with the buildings so stopped there. Will share the link to the guide if you want to have a go.
#rstats #dataviz
I followed a guide to plot the density of buildings in Worthing but I quite liked it with the buildings so stopped there. Will share the link to the guide if you want to have a go.
#rstats #dataviz

November 10, 2025 at 9:36 PM
Day 8 #30DayMapChallenge - Urban Density
I followed a guide to plot the density of buildings in Worthing but I quite liked it with the buildings so stopped there. Will share the link to the guide if you want to have a go.
#rstats #dataviz
I followed a guide to plot the density of buildings in Worthing but I quite liked it with the buildings so stopped there. Will share the link to the guide if you want to have a go.
#rstats #dataviz
Day 7 #30DayMapChallenge - I want to ride my bicycle...
Surprisingly, there's not a cycle path that connects Worthing to Brighton, mostly because of the bit occupied by Shoreham in the middle. Maybe one day it'll happen but in the meantime you'll have to join the A259.
#rstats #dataviz
Surprisingly, there's not a cycle path that connects Worthing to Brighton, mostly because of the bit occupied by Shoreham in the middle. Maybe one day it'll happen but in the meantime you'll have to join the A259.
#rstats #dataviz

November 10, 2025 at 9:33 PM
Day 7 #30DayMapChallenge - I want to ride my bicycle...
Surprisingly, there's not a cycle path that connects Worthing to Brighton, mostly because of the bit occupied by Shoreham in the middle. Maybe one day it'll happen but in the meantime you'll have to join the A259.
#rstats #dataviz
Surprisingly, there's not a cycle path that connects Worthing to Brighton, mostly because of the bit occupied by Shoreham in the middle. Maybe one day it'll happen but in the meantime you'll have to join the A259.
#rstats #dataviz
Day 6 #30DayMapChallenge - Mount Kailash
Not sure what to do with 'dimensions' but since everyone did a 3D map, I put together this 3D view of Mount Kailash in #QGIS and then added it into a ggplot as a background image.
#rstats #dataviz
Not sure what to do with 'dimensions' but since everyone did a 3D map, I put together this 3D view of Mount Kailash in #QGIS and then added it into a ggplot as a background image.
#rstats #dataviz

November 8, 2025 at 5:04 PM
Day 6 #30DayMapChallenge - Mount Kailash
Not sure what to do with 'dimensions' but since everyone did a 3D map, I put together this 3D view of Mount Kailash in #QGIS and then added it into a ggplot as a background image.
#rstats #dataviz
Not sure what to do with 'dimensions' but since everyone did a 3D map, I put together this 3D view of Mount Kailash in #QGIS and then added it into a ggplot as a background image.
#rstats #dataviz
Reposted by Tan G.

🚇 Paris en toute autonomie : accessibilité du métro
🌍 #30DayMapChallenge – Jour 7 : Accessibilité
Pour ce septième jour, cap sur Paris et son réseau de métro.
Données : Île-de-France Mobilités, RATP, Open Data Paris, BD Topo® (IGN)
#ArcGIS
🌍 #30DayMapChallenge – Jour 7 : Accessibilité
Pour ce septième jour, cap sur Paris et son réseau de métro.
Données : Île-de-France Mobilités, RATP, Open Data Paris, BD Topo® (IGN)
#ArcGIS

November 7, 2025 at 7:07 AM
🚇 Paris en toute autonomie : accessibilité du métro
🌍 #30DayMapChallenge – Jour 7 : Accessibilité
Pour ce septième jour, cap sur Paris et son réseau de métro.
Données : Île-de-France Mobilités, RATP, Open Data Paris, BD Topo® (IGN)
#ArcGIS
🌍 #30DayMapChallenge – Jour 7 : Accessibilité
Pour ce septième jour, cap sur Paris et son réseau de métro.
Données : Île-de-France Mobilités, RATP, Open Data Paris, BD Topo® (IGN)
#ArcGIS
Ugh, feel underprepared for this but trusting in the training I’ve done so far.

November 7, 2025 at 12:35 PM
Ugh, feel underprepared for this but trusting in the training I’ve done so far.
Reposted by Tan G.

Doing some math with the White House.
November 6, 2025 at 7:30 PM
Doing some math with the White House.
Reposted by Tan G.

Today’s Daily Cartoon, by Lindsey Budde. #NewYorkerCartoons

November 6, 2025 at 9:39 PM
Today’s Daily Cartoon, by Lindsey Budde. #NewYorkerCartoons
Reposted by Tan G.

I successfully nerd-sniped myself into making a precinct-level dot-density map of the NYC mayoral election. kieranhealy.org/blog/archive...

Mamdani vs Sliwa and Cuomo
Mamdani’s victory in the New York City mayoral election gave me the opportunity to draw a few maps, and also to learn a bit about incorporating additional spatial data into maps drawn in R. R is not a...
kieranhealy.org
November 6, 2025 at 10:07 PM
I successfully nerd-sniped myself into making a precinct-level dot-density map of the NYC mayoral election. kieranhealy.org/blog/archive...
Reposted by Tan G.

My favorite maps are the ones that take like 3 applications to finish.
Kidding.
Here's my Day 6 ("dimensions") of #30DayMapChallenge: a joy or ridgeline plot of kids in the US in 2020. Thanks @ipums.bsky.social (NHGIS), QGIS, R, Adobe Illustrator, and especially @helenmakesmaps.bsky.social
Kidding.
Here's my Day 6 ("dimensions") of #30DayMapChallenge: a joy or ridgeline plot of kids in the US in 2020. Thanks @ipums.bsky.social (NHGIS), QGIS, R, Adobe Illustrator, and especially @helenmakesmaps.bsky.social

November 6, 2025 at 8:35 PM
My favorite maps are the ones that take like 3 applications to finish.
Kidding.
Here's my Day 6 ("dimensions") of #30DayMapChallenge: a joy or ridgeline plot of kids in the US in 2020. Thanks @ipums.bsky.social (NHGIS), QGIS, R, Adobe Illustrator, and especially @helenmakesmaps.bsky.social
Kidding.
Here's my Day 6 ("dimensions") of #30DayMapChallenge: a joy or ridgeline plot of kids in the US in 2020. Thanks @ipums.bsky.social (NHGIS), QGIS, R, Adobe Illustrator, and especially @helenmakesmaps.bsky.social
Reposted by Tan G.

#30daymapchallenge | Day 6 Dimensions | Unrealized Heights
Still tinkering with this one, but here’s unbuilt volume for large buildings within 1 mile of the Capitol, where the Capitol View Preservation Ordinance restricts buildings from exceeding the elevation of the base of the Capitol’s columns.
Still tinkering with this one, but here’s unbuilt volume for large buildings within 1 mile of the Capitol, where the Capitol View Preservation Ordinance restricts buildings from exceeding the elevation of the base of the Capitol’s columns.

November 6, 2025 at 1:46 PM
#30daymapchallenge | Day 6 Dimensions | Unrealized Heights
Still tinkering with this one, but here’s unbuilt volume for large buildings within 1 mile of the Capitol, where the Capitol View Preservation Ordinance restricts buildings from exceeding the elevation of the base of the Capitol’s columns.
Still tinkering with this one, but here’s unbuilt volume for large buildings within 1 mile of the Capitol, where the Capitol View Preservation Ordinance restricts buildings from exceeding the elevation of the base of the Capitol’s columns.
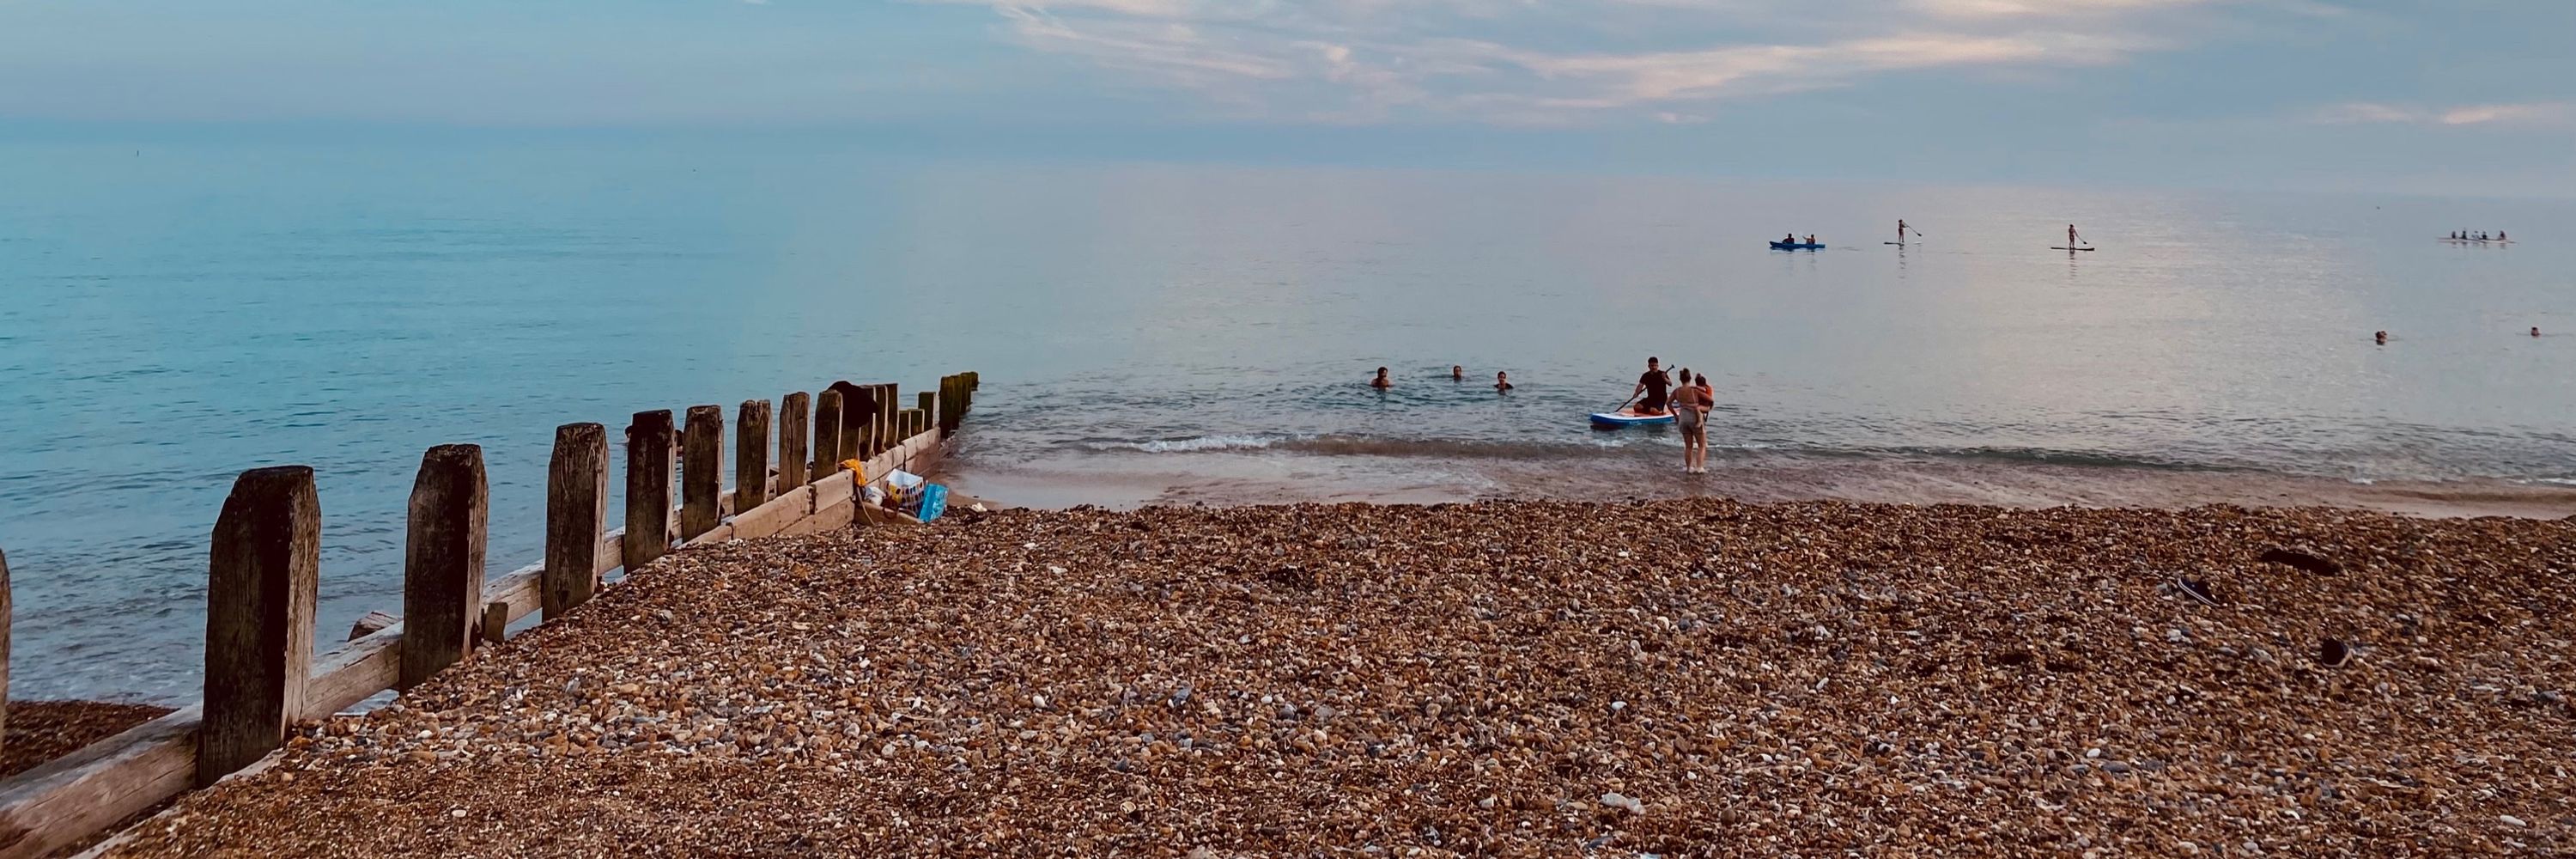
Bonfire night always draws a good crowd in Worthing

Bonfire night in Worthing#dogmum #puppy #londoners #welcometolondon #keşfet #bonfire #bonfires #pets
YouTube video by Elif Derin
youtube.com
November 6, 2025 at 2:40 PM
Bonfire night always draws a good crowd in Worthing


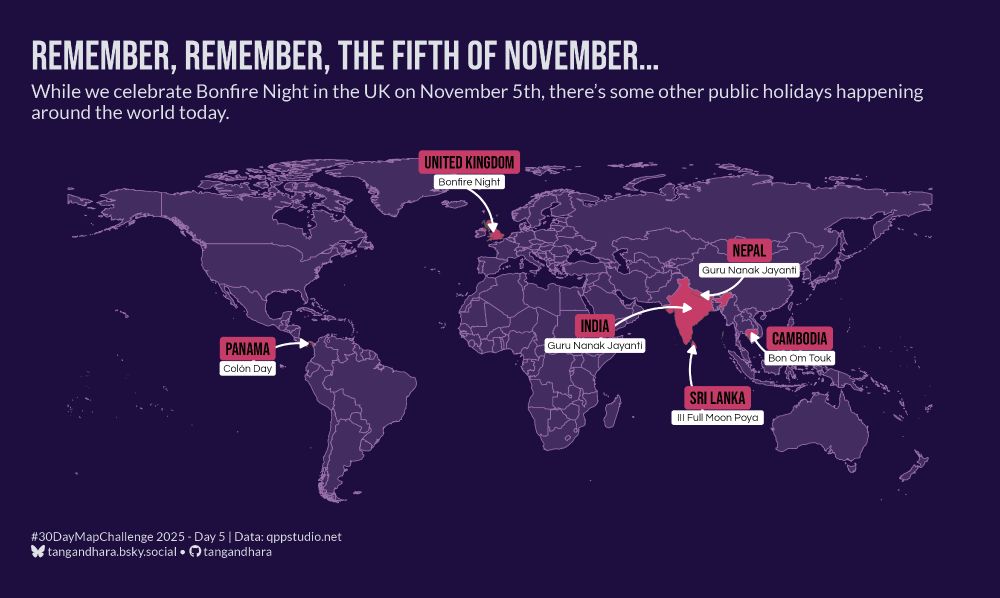
Day 5 #30DayMapChallenge - Remember, remember, the fifth of November...
Bonfire night here in the UK but there are some other public holidays going on earth (see what I did there?) today.
#rstats #dataviz
Bonfire night here in the UK but there are some other public holidays going on earth (see what I did there?) today.
#rstats #dataviz
November 5, 2025 at 10:02 PM
Day 5 #30DayMapChallenge - Remember, remember, the fifth of November...
Bonfire night here in the UK but there are some other public holidays going on earth (see what I did there?) today.
#rstats #dataviz
Bonfire night here in the UK but there are some other public holidays going on earth (see what I did there?) today.
#rstats #dataviz
Reposted by Tan G.

30DayMapChallenge - Day 5: earth
Protected areas vs oil & gas extraction using Latam datasets and oil concessions in 5 Latam countries (Colombia, Brazil, Peru, Ecuador and Argentina).
Data: Global Energy Monitor, Global Forest Watch, World Database on Protected Areas
#dataviz #map
Protected areas vs oil & gas extraction using Latam datasets and oil concessions in 5 Latam countries (Colombia, Brazil, Peru, Ecuador and Argentina).
Data: Global Energy Monitor, Global Forest Watch, World Database on Protected Areas
#dataviz #map
November 5, 2025 at 5:51 PM
Reposted by Tan G.

Building upon the earlier land/water hemisphere maps, this exercise further refines the design by incorporating perspectives of the Eastern and Western Hemispheres, the polar regions, and layered contourline coloring. The result is a relatively comprehensive map.
#QGIS #Inkscape #Hemisphere #Map
#QGIS #Inkscape #Hemisphere #Map

September 19, 2025 at 8:24 AM
Building upon the earlier land/water hemisphere maps, this exercise further refines the design by incorporating perspectives of the Eastern and Western Hemispheres, the polar regions, and layered contourline coloring. The result is a relatively comprehensive map.
#QGIS #Inkscape #Hemisphere #Map
#QGIS #Inkscape #Hemisphere #Map
Reposted by Tan G.
Day 03 of #30DayMapChallenge with a density choropleth and quantiles!
👏 Thanks to @Benjamin Novak's tutorial in @yan-holtz.bsky.social gallery r-graph-gallery.com/web-map-chor...
🌚 Used data from the Observatoire Statistique Tranfrontalier
#rstats #dataviz #map #ggplot2 #gis
👏 Thanks to @Benjamin Novak's tutorial in @yan-holtz.bsky.social gallery r-graph-gallery.com/web-map-chor...
🌚 Used data from the Observatoire Statistique Tranfrontalier
#rstats #dataviz #map #ggplot2 #gis

November 5, 2025 at 3:14 PM
Day 03 of #30DayMapChallenge with a density choropleth and quantiles!
👏 Thanks to @Benjamin Novak's tutorial in @yan-holtz.bsky.social gallery r-graph-gallery.com/web-map-chor...
🌚 Used data from the Observatoire Statistique Tranfrontalier
#rstats #dataviz #map #ggplot2 #gis
👏 Thanks to @Benjamin Novak's tutorial in @yan-holtz.bsky.social gallery r-graph-gallery.com/web-map-chor...
🌚 Used data from the Observatoire Statistique Tranfrontalier
#rstats #dataviz #map #ggplot2 #gis
Reposted by Tan G.

Night trains are really having a moment right now. Every year, a few more routes appear, offering travellers real alternatives to short-haul flights across Europe. Next time, swap the airport for the train station and wake up somewhere new.
A data story by Sebastian Gräff.
A data story by Sebastian Gräff.


November 5, 2025 at 12:08 PM
Night trains are really having a moment right now. Every year, a few more routes appear, offering travellers real alternatives to short-haul flights across Europe. Next time, swap the airport for the train station and wake up somewhere new.
A data story by Sebastian Gräff.
A data story by Sebastian Gräff.
Reposted by Tan G.

We’re launching a bold plan to make high-speed rail the fastest, more sustainable way to travel across Europe by 2040.
It’s a concrete timeline to remove bottlenecks, unlock investment, and harmonise rail systems ⬇️
It’s a concrete timeline to remove bottlenecks, unlock investment, and harmonise rail systems ⬇️

November 5, 2025 at 10:29 AM
We’re launching a bold plan to make high-speed rail the fastest, more sustainable way to travel across Europe by 2040.
It’s a concrete timeline to remove bottlenecks, unlock investment, and harmonise rail systems ⬇️
It’s a concrete timeline to remove bottlenecks, unlock investment, and harmonise rail systems ⬇️
Reposted by Tan G.

#30daymapchallenge Day 4: Data: My Data. This summer I cycled from home in Brighton, UK to Rouen in France to watch the Tour de France. This was my route - mapped in Official Tour de France route map style.

November 4, 2025 at 10:36 AM
#30daymapchallenge Day 4: Data: My Data. This summer I cycled from home in Brighton, UK to Rouen in France to watch the Tour de France. This was my route - mapped in Official Tour de France route map style.
Reposted by Tan G.
#30daymapchallenge 🗺️ jour 4 : MyData.
Quand je pense à certaines chansons, que je les entends, instantanément, je visualise un endroit. Souvent là où je les ai entendues.
Encore un soir, par Céline Dion, est indissociable pour moi de la RN7 à Roanne.
Et vous ?
Quand je pense à certaines chansons, que je les entends, instantanément, je visualise un endroit. Souvent là où je les ai entendues.
Encore un soir, par Céline Dion, est indissociable pour moi de la RN7 à Roanne.
Et vous ?

November 4, 2025 at 3:34 PM
#30daymapchallenge 🗺️ jour 4 : MyData.
Quand je pense à certaines chansons, que je les entends, instantanément, je visualise un endroit. Souvent là où je les ai entendues.
Encore un soir, par Céline Dion, est indissociable pour moi de la RN7 à Roanne.
Et vous ?
Quand je pense à certaines chansons, que je les entends, instantanément, je visualise un endroit. Souvent là où je les ai entendues.
Encore un soir, par Céline Dion, est indissociable pour moi de la RN7 à Roanne.
Et vous ?
Reposted by Tan G.

November 4, 2025 at 5:16 PM
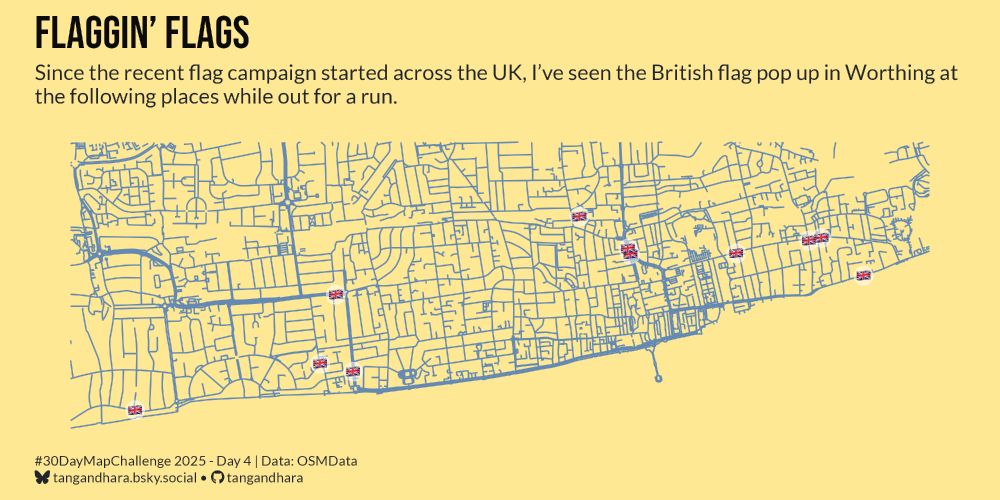
Day 4 #30DayMapChallenge - Flaggin' Flags
Here's all the places I've seen the Union Jack whilst out on a run in Worthing. I spend a fair time running east and west of central Worthing, so it makes sense that I've recorded most observations there.
#rstats #dataviz
Here's all the places I've seen the Union Jack whilst out on a run in Worthing. I spend a fair time running east and west of central Worthing, so it makes sense that I've recorded most observations there.
#rstats #dataviz
November 4, 2025 at 3:34 PM
Day 4 #30DayMapChallenge - Flaggin' Flags
Here's all the places I've seen the Union Jack whilst out on a run in Worthing. I spend a fair time running east and west of central Worthing, so it makes sense that I've recorded most observations there.
#rstats #dataviz
Here's all the places I've seen the Union Jack whilst out on a run in Worthing. I spend a fair time running east and west of central Worthing, so it makes sense that I've recorded most observations there.
#rstats #dataviz