


Jan Herder
@janherder.bsky.social
Gaian, trees, permaculture, history, archaeology, Birder, vegan, Covid conscious. Doomer. Posting on Overshoot, climate, weather and issues of collapse equity. Living on colonized Passamaquoddy land.
Reposted by Jan Herder
The Earth energy imbalance (EEI) is best looked at over longer periods, as short-term impacts from ENSO, volcanoes, solar cycle, cloud cover and aerosols can create a lot of volatility.
Here is a graph showing the 36-month running average for the EEI, currently at 11.2 HpS.
Here is a graph showing the 36-month running average for the EEI, currently at 11.2 HpS.

November 19, 2025 at 2:24 PM
The Earth energy imbalance (EEI) is best looked at over longer periods, as short-term impacts from ENSO, volcanoes, solar cycle, cloud cover and aerosols can create a lot of volatility.
Here is a graph showing the 36-month running average for the EEI, currently at 11.2 HpS.
Here is a graph showing the 36-month running average for the EEI, currently at 11.2 HpS.
Reposted by Jan Herder

1,019 glaciers have disappeared since 1973 in Switzerland! ✝️
1st nationwide assessment of vanished glaciers:
>40% of the glaciers inventoried in 1973
~13% (47±3 km²) of total glacier area loss! 🧊🔥
But, as it is based on the latest inventory (from 2016), the actual figures are far much higher! 📈 😰
1st nationwide assessment of vanished glaciers:
>40% of the glaciers inventoried in 1973
~13% (47±3 km²) of total glacier area loss! 🧊🔥
But, as it is based on the latest inventory (from 2016), the actual figures are far much higher! 📈 😰

November 19, 2025 at 12:05 PM
1,019 glaciers have disappeared since 1973 in Switzerland! ✝️
1st nationwide assessment of vanished glaciers:
>40% of the glaciers inventoried in 1973
~13% (47±3 km²) of total glacier area loss! 🧊🔥
But, as it is based on the latest inventory (from 2016), the actual figures are far much higher! 📈 😰
1st nationwide assessment of vanished glaciers:
>40% of the glaciers inventoried in 1973
~13% (47±3 km²) of total glacier area loss! 🧊🔥
But, as it is based on the latest inventory (from 2016), the actual figures are far much higher! 📈 😰
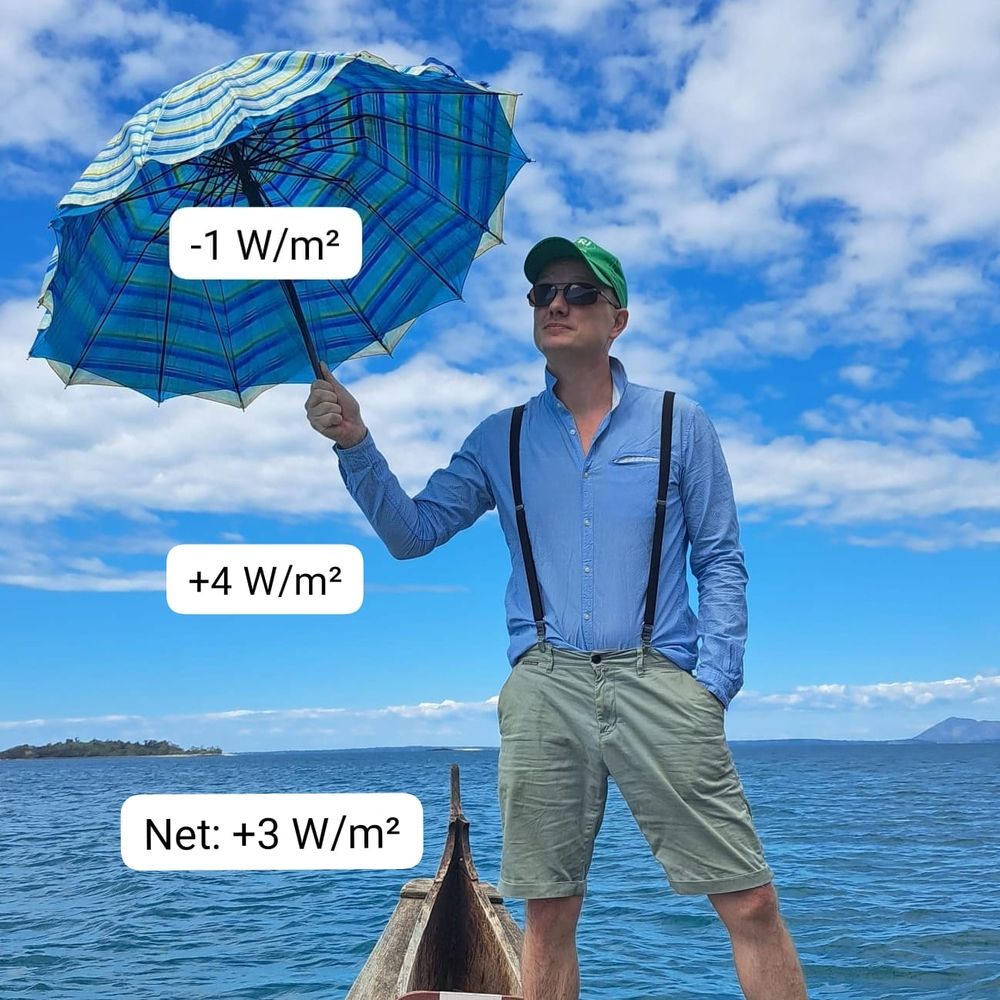
A billion Hiroshima bombs a year
👻BOO‼️
I can't think of anything scarier than this.
The greenhouse gases we have added to the atmosphere now force over a billion Hiroshima bombs worth of heat into the Earth system every year.
I can't think of anything scarier than this.
The greenhouse gases we have added to the atmosphere now force over a billion Hiroshima bombs worth of heat into the Earth system every year.
November 19, 2025 at 1:06 PM
A billion Hiroshima bombs a year
12,000 year old ice


November 18, 2025 at 3:38 PM
12,000 year old ice
Reposted by Jan Herder
“Even for an intermediate emissions scenario [which is our current emissions pathway] the probability of AMOC shutdown is way above 50%”
(AMOC shut-down means Europe and parts of South-East Asia become uninhabitable, by the way.)
1/4
(AMOC shut-down means Europe and parts of South-East Asia become uninhabitable, by the way.)
1/4
Is the Atlantic Ocean circulation close to tipping?
Hear the latest science as I presented it last month at the ATLAS25 event in Helsinki.
Let me know if anything is unclear, or if you see good reasons why your government shouldn't immediately act on this. 🌊
youtu.be/ULJXqOZuY-8
Hear the latest science as I presented it last month at the ATLAS25 event in Helsinki.
Let me know if anything is unclear, or if you see good reasons why your government shouldn't immediately act on this. 🌊
youtu.be/ULJXqOZuY-8

Is the Atlantic Ocean circulation close to tipping?
YouTube video by Earth System Analysis - Potsdam Institute
youtu.be
November 16, 2025 at 7:56 PM
“Even for an intermediate emissions scenario [which is our current emissions pathway] the probability of AMOC shutdown is way above 50%”
(AMOC shut-down means Europe and parts of South-East Asia become uninhabitable, by the way.)
1/4
(AMOC shut-down means Europe and parts of South-East Asia become uninhabitable, by the way.)
1/4
They should tell us

Someone turned up on one of our threads the other day and said something very irritating… but probably a commonly held belief.
“They should only tell us if a significantly different virus turns up..”
Ok. Not irritating. Infuriating. I’ll explain why.
“They should only tell us if a significantly different virus turns up..”
Ok. Not irritating. Infuriating. I’ll explain why.
November 16, 2025 at 1:31 PM
They should tell us
PFAS map in the UK. An essential tool. In the States only Maine has anything similar
November 15, 2025 at 4:46 PM
PFAS map in the UK. An essential tool. In the States only Maine has anything similar
Reposted by Jan Herder

First known human case of H5N5!

AFD Blog `Washington State DOH: #H5N5 Avian influenza confirmed in Grays Harbor County resident' afludiary.blogspot.com/2025/11/wash...
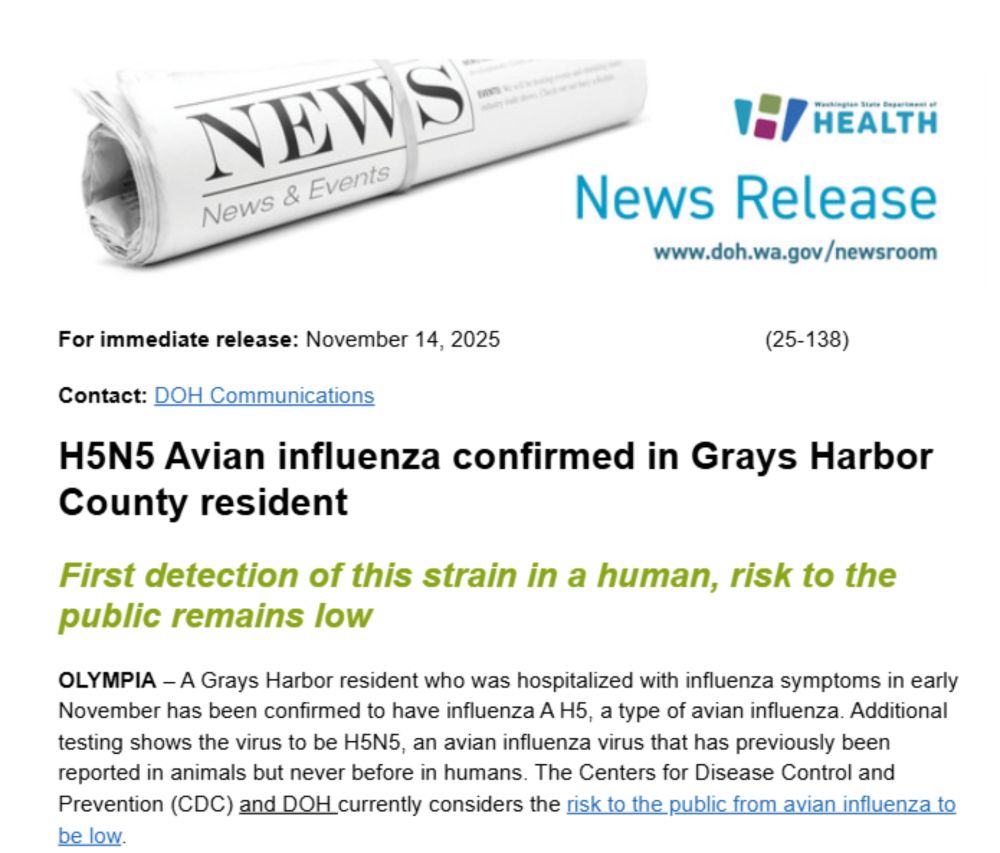
Washington State DOH: H5N5 Avian influenza confirmed in Grays Harbor County resident
#18,846 In a `the plot thickens ' moment, this afternoon the Washington State Department of Health has announced their presumptive H5 cas...
afludiary.blogspot.com
November 14, 2025 at 10:09 PM
First known human case of H5N5!
Reposted by Jan Herder
The atmospheric CO₂ growth rate was off the chart in 2024!

November 14, 2025 at 7:00 PM
The atmospheric CO₂ growth rate was off the chart in 2024!
Reposted by Jan Herder

Equalizing electricity prices between residential, commercial, and industrial customers would save households - aka voters - 21% on their electricity bills. Commercial prices would go up 1%. Industrial prices would go up 59% because residential and commercial customers deeply subsidize them today.
7. Residential customers - aka you and me, aka voters - pay 28% more (16.5 c/kWh, 2024 average) than commercial customers (12.9 c/kWh) and 201% more than industrial (8.2 c/kWh). This trend is accelerating: Residential prices rose 27% from 2019-2023, vs. 21% for commercial and 19% for industrial.

November 13, 2025 at 11:21 PM
Equalizing electricity prices between residential, commercial, and industrial customers would save households - aka voters - 21% on their electricity bills. Commercial prices would go up 1%. Industrial prices would go up 59% because residential and commercial customers deeply subsidize them today.
Debt

Unlike other nations, the US has racked up unprecedented debt by giving away treasury funds to the wealthiest 0.1% of its population through a process that sociologists call capture.

November 14, 2025 at 2:47 PM
Debt
Walnut groves thinning


November 13, 2025 at 10:30 PM
Walnut groves thinning
Reposted by Jan Herder


900

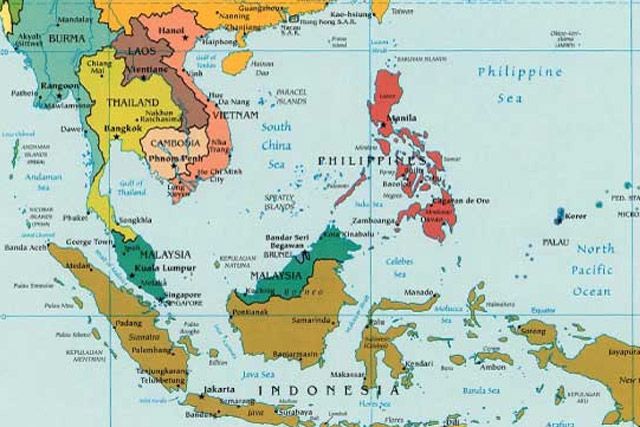
EXCEPTIONAL HEAT IN SE ASIA
Records pulverized every day in every country over and over again
Most extreme event ever in SINGAPORE
35.4 Changi AP Monthly record again!
THAILAND
35.7 Sawi
INDONESIA
35.5 Timika
>900 consecutive days breaking records in Thailand & Indonesia!
Records pulverized every day in every country over and over again
Most extreme event ever in SINGAPORE
35.4 Changi AP Monthly record again!
THAILAND
35.7 Sawi
INDONESIA
35.5 Timika
>900 consecutive days breaking records in Thailand & Indonesia!
November 8, 2025 at 12:49 PM
900
Reposted by Jan Herder

I believe that’s called ‘going Greek’. Few return from that glance. Great quote Ian
“Glance into the world just as though time were gone: and everything crooked will become straight to you.”
(Nietzsche)
#collapse
(Nietzsche)
#collapse
November 8, 2025 at 12:42 PM
I believe that’s called ‘going Greek’. Few return from that glance. Great quote Ian
Reposted by Jan Herder

🚨🚨🚨The Arctic portion of the Northern Hemisphere (60N to 90N) had its warmest October on record. What could go wrong? @alaskawx.bsky.social 🚨🚨🚨

November 5, 2025 at 3:05 AM
🚨🚨🚨The Arctic portion of the Northern Hemisphere (60N to 90N) had its warmest October on record. What could go wrong? @alaskawx.bsky.social 🚨🚨🚨
Faster than expected
As if it wasn't 'bad enough' already, climate models underestimate future Ocean Heat Uptake, because them get present-day Antarctic sea-ice wrong.
One more reason why climate change will be worse than models project..
One more reason why climate change will be worse than models project..
November 5, 2025 at 2:20 PM
Faster than expected
Granular thread, Replying to Gates memo
I strongly agree--both because I personally believe that it's the right thing to do and also because the evidence supports it--that rapidly addressing poverty, health inequity, and food/water insecurity should be a first-order priority. Full stop. No argument there. [3/n]
October 31, 2025 at 4:38 PM
Granular thread, Replying to Gates memo
Addleshade

This is Noble Shadow
A literal translation of the Old English Æðelsceadu, or Addleshade if the word still existed
This is a Kingdom of Kent acorn 🫡🌳
Our little hero has finally decided to reach for the sky
A literal translation of the Old English Æðelsceadu, or Addleshade if the word still existed
This is a Kingdom of Kent acorn 🫡🌳
Our little hero has finally decided to reach for the sky


October 31, 2025 at 4:03 PM
Addleshade
Reposted by Jan Herder

One striking result is that the dangers of the dramatic decline in natural ecosystems and biodiversity (in oceans and on land) are not widely recognised by the general public, and I would say are still underestimated by the experts. We all ultimately depend on a functioning biosphere.

October 31, 2025 at 9:57 AM
One striking result is that the dangers of the dramatic decline in natural ecosystems and biodiversity (in oceans and on land) are not widely recognised by the general public, and I would say are still underestimated by the experts. We all ultimately depend on a functioning biosphere.
Ai tells.
Love the analysis
Love the analysis

Remember when social media was a useful tool for assessing damage post-disaster, instead of having to fish through fake photos made with AI garbage?
That was nice.
That was nice.

Black River hospital Jamaica #hurricane #melissa 🇯🇲
October 29, 2025 at 5:34 PM
Ai tells.
Love the analysis
Love the analysis
Hawaii precipitation trend analysis

October 29, 2025 at 5:30 PM
Hawaii precipitation trend analysis
Reposted by Jan Herder
Unlocking rivers: build a world that's more Arnie

🐟 “Arnie” the Murray cod (Maccullochella peelii) swam 530 miles upstream. A record journey across Australia’s Murray-Darling rivers. When rivers stay connected. Water flows. Life flows 💪
#RiverConnectivity
#Monitoring
#Australia
#Biodiversity
#RiverConnectivity
#Monitoring
#Australia
#Biodiversity

A freshwater fish named Arnie just swam a record 530 miles, mostly upstream, Australian scientists say
The Murray cod, named Arnie after Australia's recently retired Olympic champion Ariarne Titmus, was first tagged in 2022.
share.google
October 29, 2025 at 8:09 AM
Unlocking rivers: build a world that's more Arnie