


Matt Marchesi
@mattmarchesi.bsky.social
Working on home energy efficiency, sustainability and climate policy, cycling for transport and fun, running up and down many hills.
Reposted by Matt Marchesi

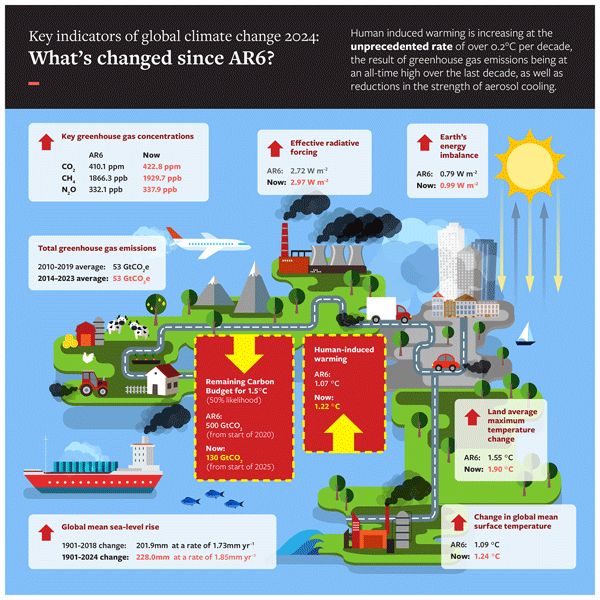
Our new paper updating key metrics in the IPCC is now out, and the news is grim:
⬆️ Human induced warming now at 1.36C
⬆️ Rate of warming now 0.27C / decade
⬆️ Sharp increase in Earth's energy imbalance
⬇️ Remaining 1.5C carbon budget only 130 GtCO2
essd.copernicus.org/...
⬆️ Human induced warming now at 1.36C
⬆️ Rate of warming now 0.27C / decade
⬆️ Sharp increase in Earth's energy imbalance
⬇️ Remaining 1.5C carbon budget only 130 GtCO2
essd.copernicus.org/...
Indicators of Global Climate Change 2024: annual update of key indicators of the state of the climate system and human influence
Abstract. In a rapidly changing climate, evidence-based decision-making benefits from up-to-date and timely information. Here we compile monitoring datasets (published at https://doi.org/10.5281/zenodo.15639576; Smith et al., 2025a) to produce updated estimates for key indicators of the state of the climate system: net emissions of greenhouse gases and short-lived climate forcers, greenhouse gas concentrations, radiative forcing, the Earth's energy imbalance, surface temperature changes, warming attributed to human activities, the remaining carbon budget, and estimates of global temperature extremes. This year, we additionally include indicators for sea-level rise and land precipitation change. We follow methods as closely as possible to those used in the IPCC Sixth Assessment Report (AR6) Working Group One report. The indicators show that human activities are increasing the Earth's energy imbalance and driving faster sea-level rise compared to the AR6 assessment. For the 2015–2024 decade average, observed warming relative to 1850–1900 was 1.24 [1.11 to 1.35] °C, of which 1.22 [1.0 to 1.5] °C was human-induced. The 2024-observed best estimate of global surface temperature (1.52 °C) is well above the best estimate of human-caused warming (1.36 °C). However, the 2024 observed warming can still be regarded as a typical year, considering the human-induced warming level and the state of internal variability associated with the phase of El Niño and Atlantic variability. Human-induced warming has been increasing at a rate that is unprecedented in the instrumental record, reaching 0.27 [0.2–0.4] °C per decade over 2015–2024. This high rate of warming is caused by a combination of greenhouse gas emissions being at an all-time high of 53.6±5.2 Gt CO2e yr−1 over the last decade (2014–2023), as well as reductions in the strength of aerosol cooling. Despite this, there is evidence that the rate of increase in CO2 emissions over the last decade has slowed compared to the 2000s, and depending on societal choices, a continued series of these annual updates over the critical 2020s decade could track decreases or increases in the rate of the climatic changes presented here.
essd.copernicus.org
June 18, 2025 at 11:10 PM
Our new paper updating key metrics in the IPCC is now out, and the news is grim:
⬆️ Human induced warming now at 1.36C
⬆️ Rate of warming now 0.27C / decade
⬆️ Sharp increase in Earth's energy imbalance
⬇️ Remaining 1.5C carbon budget only 130 GtCO2
essd.copernicus.org/...
⬆️ Human induced warming now at 1.36C
⬆️ Rate of warming now 0.27C / decade
⬆️ Sharp increase in Earth's energy imbalance
⬇️ Remaining 1.5C carbon budget only 130 GtCO2
essd.copernicus.org/...
Reposted by Matt Marchesi

And the conjunction, shown in this photo, of 20+ year old diesel technology in what we perceive as a modern train running on a railway with actual concrete reminders of an electrically powered past ought to spur us to think about what trains we should be building for the next 20 to 40 years.
June 4, 2025 at 2:50 AM
And the conjunction, shown in this photo, of 20+ year old diesel technology in what we perceive as a modern train running on a railway with actual concrete reminders of an electrically powered past ought to spur us to think about what trains we should be building for the next 20 to 40 years.
Reposted by Matt Marchesi

Check them all out:
Australia: isithotrightnow.com
UK: istheukhotrightnow.com
Spain: hoyextremo.com
Germany: scp.geographie.rub.de/isithot/lmss
@roostweather.bsky.social
@edhawkins.org
@jamesgoldie.dev
danielargueso.com
Steefan Contractor
Jonas Kittner
Australia: isithotrightnow.com
UK: istheukhotrightnow.com
Spain: hoyextremo.com
Germany: scp.geographie.rub.de/isithot/lmss
@roostweather.bsky.social
@edhawkins.org
@jamesgoldie.dev
danielargueso.com
Steefan Contractor
Jonas Kittner

Is it hot right now?
Is it hot right now, or does it just feel like it?
isithotrightnow.com
May 30, 2025 at 10:30 AM
Check them all out:
Australia: isithotrightnow.com
UK: istheukhotrightnow.com
Spain: hoyextremo.com
Germany: scp.geographie.rub.de/isithot/lmss
@roostweather.bsky.social
@edhawkins.org
@jamesgoldie.dev
danielargueso.com
Steefan Contractor
Jonas Kittner
Australia: isithotrightnow.com
UK: istheukhotrightnow.com
Spain: hoyextremo.com
Germany: scp.geographie.rub.de/isithot/lmss
@roostweather.bsky.social
@edhawkins.org
@jamesgoldie.dev
danielargueso.com
Steefan Contractor
Jonas Kittner
Thankful for good footy analysis coming across to bluesky, and the camera angles barb!

🆕 on The Shinboner: A relief to be able to write a straight North Melbourne game analysis after the last few weeks.
Looking at what caused the start against Port Adelaide, what changed after quarter time, and how much can translate to future weeks.
↪️ theshinboner.com/2025/04/27/d...
Looking at what caused the start against Port Adelaide, what changed after quarter time, and how much can translate to future weeks.
↪️ theshinboner.com/2025/04/27/d...

April 26, 2025 at 11:57 PM
Thankful for good footy analysis coming across to bluesky, and the camera angles barb!
Reposted by Matt Marchesi

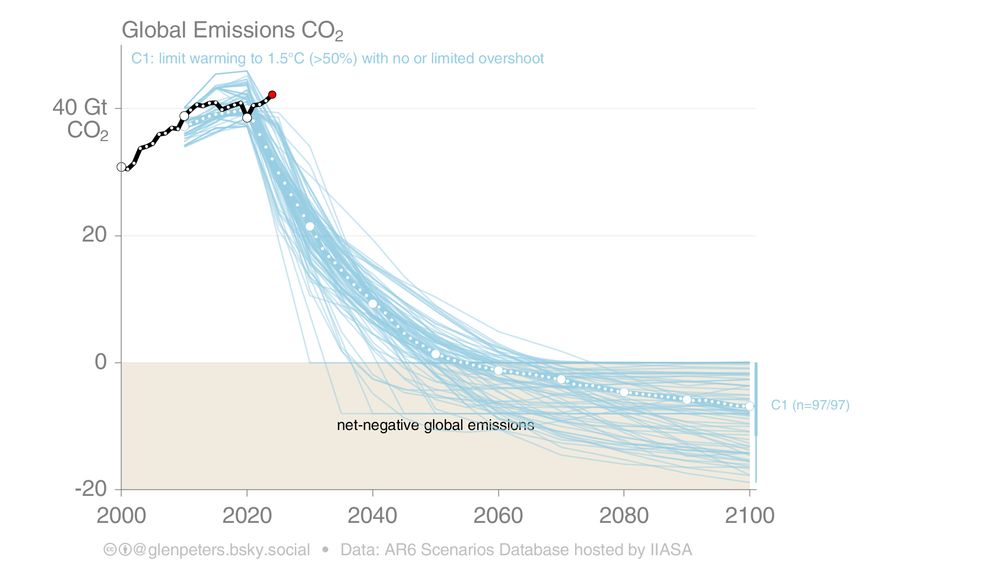
Just your regular reminder of where global CO2 emissions are tracking compared to scenarios that keep warming to below 1.5C in 2100, with "no or low overshoot" (maximum temperature around 1.6C).
journals.sagepub.com/doi/full/10....
C1/
journals.sagepub.com/doi/full/10....
C1/
April 16, 2025 at 11:29 AM
Just your regular reminder of where global CO2 emissions are tracking compared to scenarios that keep warming to below 1.5C in 2100, with "no or low overshoot" (maximum temperature around 1.6C).
journals.sagepub.com/doi/full/10....
C1/
journals.sagepub.com/doi/full/10....
C1/
Reposted by Matt Marchesi
Atmospheric CO2 has passed 430 parts per million.
The last time atmospheric CO2 was at 430 ppm was during the ancient Pliocene Era, three to five million years ago, and humans didn’t exist.
The last time atmospheric CO2 was at 430 ppm was during the ancient Pliocene Era, three to five million years ago, and humans didn’t exist.
April 22, 2025 at 5:29 AM
Atmospheric CO2 has passed 430 parts per million.
The last time atmospheric CO2 was at 430 ppm was during the ancient Pliocene Era, three to five million years ago, and humans didn’t exist.
The last time atmospheric CO2 was at 430 ppm was during the ancient Pliocene Era, three to five million years ago, and humans didn’t exist.
Reposted by Matt Marchesi

Out the front of the High Court of Australia, after the HCA dismissed the Cth appeal, Gumatj leaders Djawa Yunupingu and Balupalu Yunupingu. And Sean Bowden, the brilliant legal mind who has been the Gumatj lawyer for a long, long time. And Aunty Pat Anderson in pink. ❤️🖤💛


March 12, 2025 at 10:06 AM
Out the front of the High Court of Australia, after the HCA dismissed the Cth appeal, Gumatj leaders Djawa Yunupingu and Balupalu Yunupingu. And Sean Bowden, the brilliant legal mind who has been the Gumatj lawyer for a long, long time. And Aunty Pat Anderson in pink. ❤️🖤💛
Reposted by Matt Marchesi

The energy industry has assumed consumers manage their #energy use like ‘mini-economists’ or ‘mini-engineers.’ Digital sociologist Professor Yolande Strengers says this is wrong

SwitchedOn podcast: Why the energy industry keeps getting consumers wrong - One Step Off The Grid
The energy industry has assumed consumers manage their energy use like ‘mini-economists’ or ‘mini-engineers.’ Digital sociologist Professor Yolande Strengers says this is wrong.
onestepoffthegrid.com.au
March 5, 2025 at 6:42 AM
The energy industry has assumed consumers manage their #energy use like ‘mini-economists’ or ‘mini-engineers.’ Digital sociologist Professor Yolande Strengers says this is wrong
Reposted by Matt Marchesi

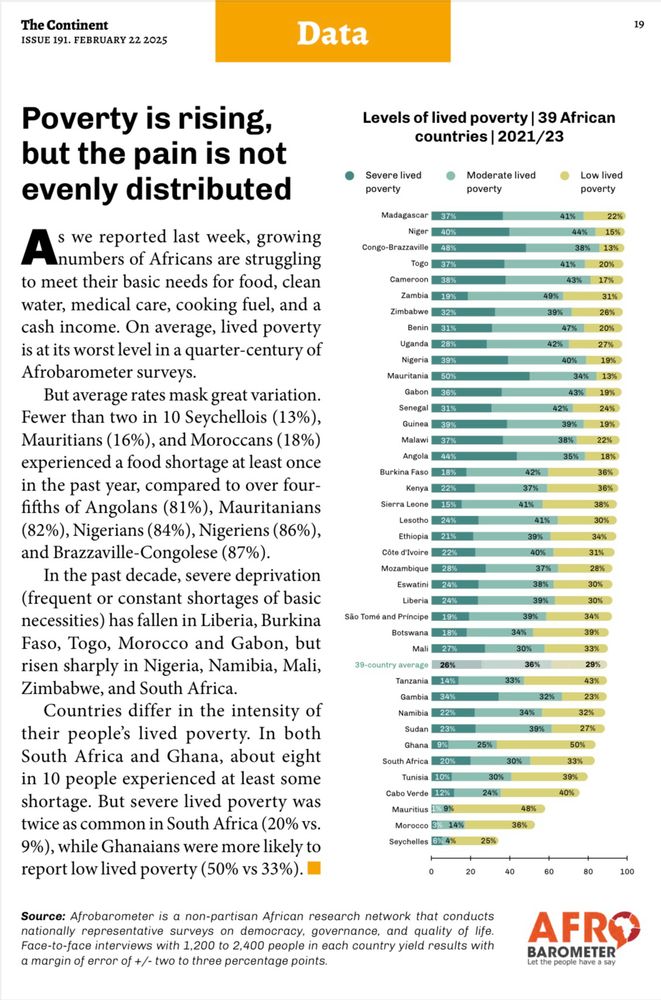
Poverty is on the rise across the African continent. The pain, however, is not evenly distributed.
On average, lived poverty is at its worst level in a quarter-century of Afrobarometer surveys.
On average, lived poverty is at its worst level in a quarter-century of Afrobarometer surveys.
February 23, 2025 at 7:21 AM
Poverty is on the rise across the African continent. The pain, however, is not evenly distributed.
On average, lived poverty is at its worst level in a quarter-century of Afrobarometer surveys.
On average, lived poverty is at its worst level in a quarter-century of Afrobarometer surveys.
Reposted by Matt Marchesi
Today's historic pic: Just 6 weeks before its withdrawal after 57 years of service, SW2 class tram no 644 runs a depot-bound Special in Moreland Rd, Brunswick, Vic, October 31 1987. 644 was converted from a W2 to an SW2 in 1953 after collision damage, and was one of just six SW2 class trams.

February 1, 2025 at 2:08 AM
Today's historic pic: Just 6 weeks before its withdrawal after 57 years of service, SW2 class tram no 644 runs a depot-bound Special in Moreland Rd, Brunswick, Vic, October 31 1987. 644 was converted from a W2 to an SW2 in 1953 after collision damage, and was one of just six SW2 class trams.
Reposted by Matt Marchesi

We all need these gang-gang smiles 🤩🪶🌏🧪🌿


January 21, 2025 at 10:07 AM
We all need these gang-gang smiles 🤩🪶🌏🧪🌿
Reposted by Matt Marchesi

I assume most people know this, but seems important to point out basic truths at this moment in time. There is no energy emergency in the U.S. The U.S. is the world's top producer of oil and gas at the moment, and the top exporter of gas, and U.S. oil and gas producers are making record profits.
January 21, 2025 at 2:22 AM
I assume most people know this, but seems important to point out basic truths at this moment in time. There is no energy emergency in the U.S. The U.S. is the world's top producer of oil and gas at the moment, and the top exporter of gas, and U.S. oil and gas producers are making record profits.
Reposted by Matt Marchesi

From declaring a “national energy emergency” to exiting the Paris Agreement, here is everything climate-related Trump did on Day 1: grist.org/article/trum...

Trump unravels US climate agenda as he promises to ‘drill, baby, drill’
From declaring a “national energy emergency” to exiting the Paris Agreement, here is everything climate-related Trump did on Day 1.
grist.org
January 21, 2025 at 2:40 AM
From declaring a “national energy emergency” to exiting the Paris Agreement, here is everything climate-related Trump did on Day 1: grist.org/article/trum...
Reposted by Matt Marchesi
Ever wondered how many trains run in Australia today?
Wonder no more.
Today there are 9,096 trips by train. And 7,579 scheduled tram trips, and 129,609 bus trips.
You can track these figures each day here:
railmaps.com.au/how_many_tra...
And you can drill into every trip in Australia's GTFS data.
Wonder no more.
Today there are 9,096 trips by train. And 7,579 scheduled tram trips, and 129,609 bus trips.
You can track these figures each day here:
railmaps.com.au/how_many_tra...
And you can drill into every trip in Australia's GTFS data.

January 14, 2025 at 3:44 AM
Ever wondered how many trains run in Australia today?
Wonder no more.
Today there are 9,096 trips by train. And 7,579 scheduled tram trips, and 129,609 bus trips.
You can track these figures each day here:
railmaps.com.au/how_many_tra...
And you can drill into every trip in Australia's GTFS data.
Wonder no more.
Today there are 9,096 trips by train. And 7,579 scheduled tram trips, and 129,609 bus trips.
You can track these figures each day here:
railmaps.com.au/how_many_tra...
And you can drill into every trip in Australia's GTFS data.
Reposted by Matt Marchesi

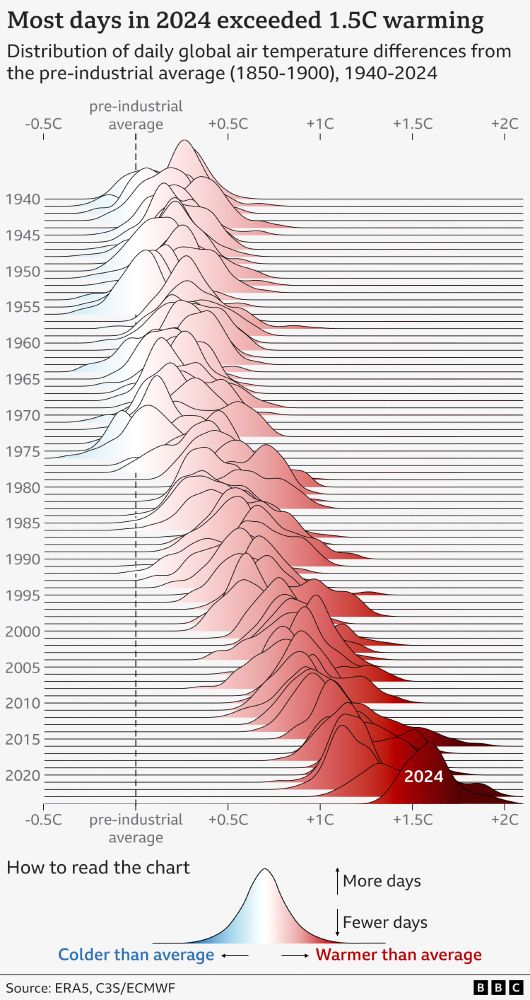
NEW: 2024 has just been confirmed as the warmest year on record, and the first to breach the 1.5C threshold.
We used a ridgeline (Joy Division inspired) chart to visualise daily temperature anomalies since 1940.
2024 clearly stands out with 100% of its days above 1.3C and 75% above 1.5C.
We used a ridgeline (Joy Division inspired) chart to visualise daily temperature anomalies since 1940.
2024 clearly stands out with 100% of its days above 1.3C and 75% above 1.5C.
January 10, 2025 at 8:04 AM
NEW: 2024 has just been confirmed as the warmest year on record, and the first to breach the 1.5C threshold.
We used a ridgeline (Joy Division inspired) chart to visualise daily temperature anomalies since 1940.
2024 clearly stands out with 100% of its days above 1.3C and 75% above 1.5C.
We used a ridgeline (Joy Division inspired) chart to visualise daily temperature anomalies since 1940.
2024 clearly stands out with 100% of its days above 1.3C and 75% above 1.5C.
Reposted by Matt Marchesi
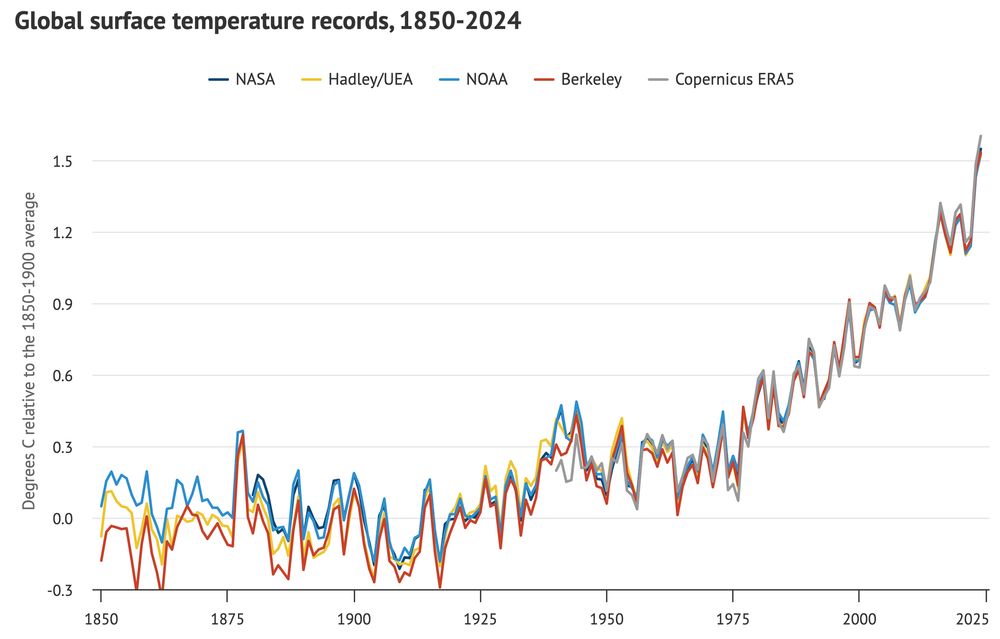
Global surface temperatures set a new record in 2024, exceeding 1.5C above preindustrial levels in the majority of datasets.
It was more than 0.1C warmer than the prior record set in 2023, and more than 0.25C warmer than any year prior to that: www.carbonbrief.org/...
It was more than 0.1C warmer than the prior record set in 2023, and more than 0.25C warmer than any year prior to that: www.carbonbrief.org/...
January 10, 2025 at 4:18 PM
Global surface temperatures set a new record in 2024, exceeding 1.5C above preindustrial levels in the majority of datasets.
It was more than 0.1C warmer than the prior record set in 2023, and more than 0.25C warmer than any year prior to that: www.carbonbrief.org/...
It was more than 0.1C warmer than the prior record set in 2023, and more than 0.25C warmer than any year prior to that: www.carbonbrief.org/...
Reposted by Matt Marchesi
I just remembered, we had three years to safeguard the climate, starting in 2017...
www.nature.com/articles/546...
www.nature.com/articles/546...

January 8, 2025 at 11:57 AM
I just remembered, we had three years to safeguard the climate, starting in 2017...
www.nature.com/articles/546...
www.nature.com/articles/546...
Reposted by Matt Marchesi

Here is a brilliant Christmas gift for you, from @drdonalbrown.bsky.social. The next instalment in our #relational approach to #retrofit story. In this new paper Donal looks specifically at the way in which relational approaches can be used to craft policy.
www.sciencedirect.com/science/arti...
www.sciencedirect.com/science/arti...

Rethinking retrofit: Relational insights for the design of residential energy efficiency policy
The ‘retrofit’ of energy efficiency, low carbon heating and renewable microgeneration measures in homes is a major focus for energy and climate policy…
www.sciencedirect.com
December 18, 2024 at 8:20 AM
Here is a brilliant Christmas gift for you, from @drdonalbrown.bsky.social. The next instalment in our #relational approach to #retrofit story. In this new paper Donal looks specifically at the way in which relational approaches can be used to craft policy.
www.sciencedirect.com/science/arti...
www.sciencedirect.com/science/arti...
Reposted by Matt Marchesi
A project in Melbourne that provided free #energy audits and energy upgrades for private rental homes was stonewalled by real estate agents

The shocking reasons why rental homes are not getting energy upgrades - One Step Off The Grid
A project in Melbourne that provided free energy audits and energy upgrades for private rental homes was stonewalled by real estate agents.
onestepoffthegrid.com.au
December 11, 2024 at 4:26 AM
A project in Melbourne that provided free #energy audits and energy upgrades for private rental homes was stonewalled by real estate agents
Reposted by Matt Marchesi
All Protocol Observed
Welcome to Issue 184 of The Continent
Coup de latte: The trouble Ugandan President Yoweri Museveni is brewing.
Get your copy here: bit.ly/TheContinent...
Welcome to Issue 184 of The Continent
Coup de latte: The trouble Ugandan President Yoweri Museveni is brewing.
Get your copy here: bit.ly/TheContinent...

November 29, 2024 at 10:02 PM
All Protocol Observed
Welcome to Issue 184 of The Continent
Coup de latte: The trouble Ugandan President Yoweri Museveni is brewing.
Get your copy here: bit.ly/TheContinent...
Welcome to Issue 184 of The Continent
Coup de latte: The trouble Ugandan President Yoweri Museveni is brewing.
Get your copy here: bit.ly/TheContinent...
Reposted by Matt Marchesi
Australia’s electricity system is physically decentralising, but the regulatory response is to extend the current centralised operational and market model. That must change

Rooftop solar and EVs will dominate our grids: How do we reform the energy system around them?
Australia’s electricity system is physically decentralising, but the regulatory response is to extend the current centralised operational and market model. That must change.
reneweconomy.com.au
November 25, 2024 at 10:28 AM
Australia’s electricity system is physically decentralising, but the regulatory response is to extend the current centralised operational and market model. That must change
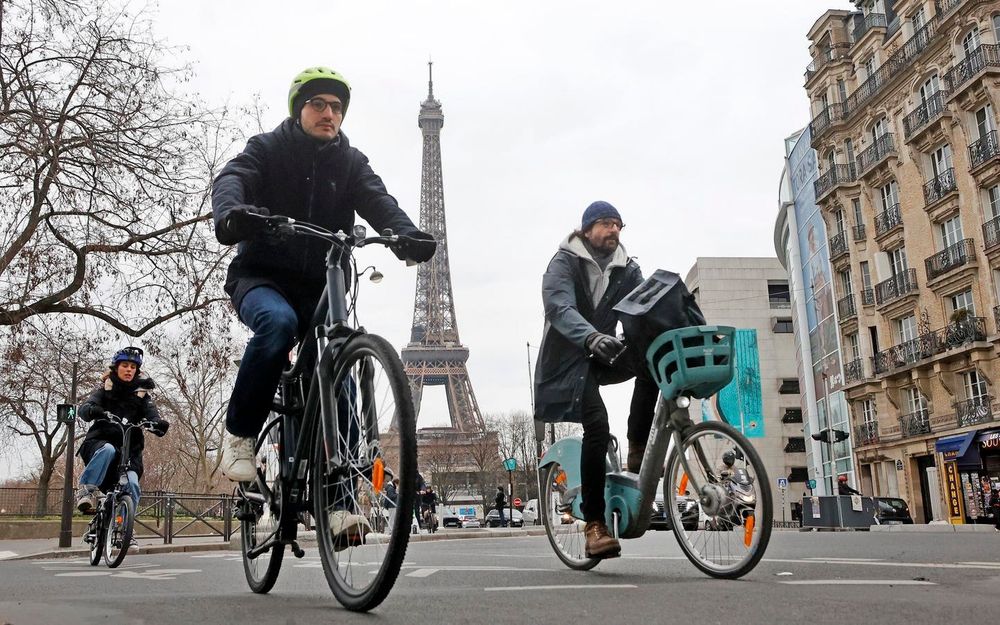
Change can happen quickly
READ: “3,337 Parisians were equipped with GPS trackers to record their journeys…for journeys from the outskirts of Paris to the center, the number of cyclists now far exceeds the number of motorists, a huge change from just 5 years ago.”
Evidence of leadership.
www.forbes.com/sites/carlto...
Evidence of leadership.
www.forbes.com/sites/carlto...
French Revolution: Cyclists Now Outnumber Motorists In Paris
Official measurements have found that Paris is rapidly becoming a city of cyclists.
www.forbes.com
November 20, 2024 at 4:02 AM
Change can happen quickly
Reposted by Matt Marchesi

A bit disconcerting when one of the world's largest moth species is attracted to your headlamp! Found this beautiful Hercules Moth in far north Queensland.
#wildoz #wildlife #nature #biodiversity #insects
#wildoz #wildlife #nature #biodiversity #insects

November 18, 2024 at 9:15 AM
A bit disconcerting when one of the world's largest moth species is attracted to your headlamp! Found this beautiful Hercules Moth in far north Queensland.
#wildoz #wildlife #nature #biodiversity #insects
#wildoz #wildlife #nature #biodiversity #insects
Reposted by Matt Marchesi

NEW: I have been speaking to homeowners about how hard it can be to make their homes more energy efficient. There IS good advice out there - but you may not always find it easily... 🏠🤔
www.bbc.co.uk/news/article...
www.bbc.co.uk/news/article...

Energy bills: The difficulty of making your home energy efficient
It can be hard to find good advice on how to make homes more energy efficient.
www.bbc.co.uk
November 12, 2024 at 8:49 AM
NEW: I have been speaking to homeowners about how hard it can be to make their homes more energy efficient. There IS good advice out there - but you may not always find it easily... 🏠🤔
www.bbc.co.uk/news/article...
www.bbc.co.uk/news/article...
Reposted by Matt Marchesi

THREAD: I’m going to share this thread here to clearly state my perspective on electric vehicles, car dependency and better cities, for all those who frequently ask me about it, including media, elected leaders and many others. Here goes. Please share it frequently if you think it will help. 🧵#EVS

November 11, 2024 at 11:11 PM
THREAD: I’m going to share this thread here to clearly state my perspective on electric vehicles, car dependency and better cities, for all those who frequently ask me about it, including media, elected leaders and many others. Here goes. Please share it frequently if you think it will help. 🧵#EVS