


LHaden
@lhaden-climate.bsky.social
Electrical/Software Engineer @ Sandia National Labs
Pinned

Reposted by LHaden

Record high temperatures are currently being set across the northernmost portions of the #Arctic. In fact, it is effectively ice-free on the Atlantic side of the Arctic all the way up to about 85°N latitude! This includes record low sea ice around Svalbard.
Graphic by zacklabe.com/arctic-tempe...
Graphic by zacklabe.com/arctic-tempe...

October 11, 2025 at 12:57 AM
Record high temperatures are currently being set across the northernmost portions of the #Arctic. In fact, it is effectively ice-free on the Atlantic side of the Arctic all the way up to about 85°N latitude! This includes record low sea ice around Svalbard.
Graphic by zacklabe.com/arctic-tempe...
Graphic by zacklabe.com/arctic-tempe...
Reposted by LHaden
Happy October 1st and start to spooky season (though for me, that begins in early September 😅).
It's my favorite time of year, so I thought I would kick it off with something pretty scary!
It's my favorite time of year, so I thought I would kick it off with something pretty scary!

October 1, 2025 at 11:56 PM
Happy October 1st and start to spooky season (though for me, that begins in early September 😅).
It's my favorite time of year, so I thought I would kick it off with something pretty scary!
It's my favorite time of year, so I thought I would kick it off with something pretty scary!
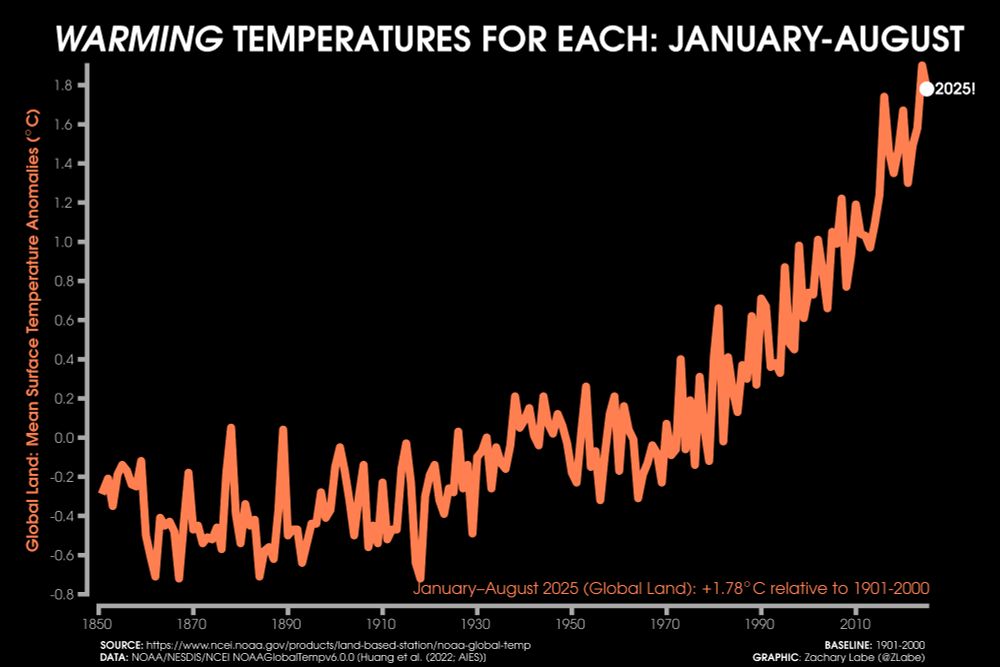
Sadly impressive.
It's been extremely warm (again) over global land areas so far this year. Here's a comparison against every other average January-August period since at least 1850...
Data from NOAAGlobalTempv6.0.0: www.ncei.noaa.gov/products/lan...
Data from NOAAGlobalTempv6.0.0: www.ncei.noaa.gov/products/lan...
September 28, 2025 at 9:07 PM
Sadly impressive.
Reposted by LHaden
All latitude bands were warmer than average over the last 3 months. This was particularly notable across the Antarctic around the South Pole (austral winter).
Plot shows zonal-mean temperature anomalies, where latitude = y-axis (not scaled by distance). GISTEMPv4 data using their 1951-1980 baseline
Plot shows zonal-mean temperature anomalies, where latitude = y-axis (not scaled by distance). GISTEMPv4 data using their 1951-1980 baseline

September 28, 2025 at 12:26 AM
All latitude bands were warmer than average over the last 3 months. This was particularly notable across the Antarctic around the South Pole (austral winter).
Plot shows zonal-mean temperature anomalies, where latitude = y-axis (not scaled by distance). GISTEMPv4 data using their 1951-1980 baseline
Plot shows zonal-mean temperature anomalies, where latitude = y-axis (not scaled by distance). GISTEMPv4 data using their 1951-1980 baseline
Reposted by LHaden


Reposted by LHaden

12 month running average Artic sea ice extent lowest on record.

August 24, 2025 at 10:34 AM
12 month running average Artic sea ice extent lowest on record.
Reposted by LHaden

Here you go, daily global sea surface temperatures through the end of July, 2025.
Meanwhile, the Climate 8-ball is refusing to use the terminology "new normal."
Meanwhile, the Climate 8-ball is refusing to use the terminology "new normal."

August 1, 2025 at 3:07 PM
Here you go, daily global sea surface temperatures through the end of July, 2025.
Meanwhile, the Climate 8-ball is refusing to use the terminology "new normal."
Meanwhile, the Climate 8-ball is refusing to use the terminology "new normal."
Reposted by LHaden
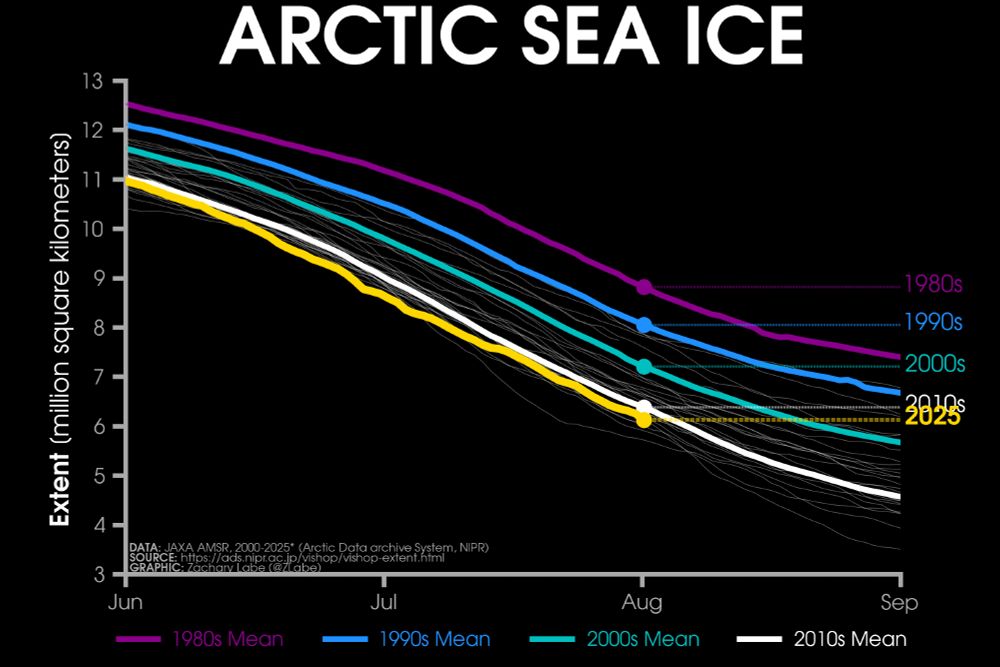
Saturday ice update - #Arctic sea ice extent is currently the 5th lowest on record (JAXA data)
• about 260,000 km² below the 2010s mean
• about 1,080,000 km² below the 2000s mean
• about 1,930,000 km² below the 1990s mean
• about 2,690,000 km² below the 1980s mean
More zacklabe.com/arctic-sea-i...
• about 260,000 km² below the 2010s mean
• about 1,080,000 km² below the 2000s mean
• about 1,930,000 km² below the 1990s mean
• about 2,690,000 km² below the 1980s mean
More zacklabe.com/arctic-sea-i...
August 2, 2025 at 4:08 PM
Saturday ice update - #Arctic sea ice extent is currently the 5th lowest on record (JAXA data)
• about 260,000 km² below the 2010s mean
• about 1,080,000 km² below the 2000s mean
• about 1,930,000 km² below the 1990s mean
• about 2,690,000 km² below the 1980s mean
More zacklabe.com/arctic-sea-i...
• about 260,000 km² below the 2010s mean
• about 1,080,000 km² below the 2000s mean
• about 1,930,000 km² below the 1990s mean
• about 2,690,000 km² below the 1980s mean
More zacklabe.com/arctic-sea-i...
Reposted by LHaden

For more on the meteorology behind this devastating event, i recommend this thorough discussion by @drjeffmasters.bsky.social and @bhensonweather.bsky.social
July 5, 2025 at 8:24 PM
For more on the meteorology behind this devastating event, i recommend this thorough discussion by @drjeffmasters.bsky.social and @bhensonweather.bsky.social
Reposted by LHaden
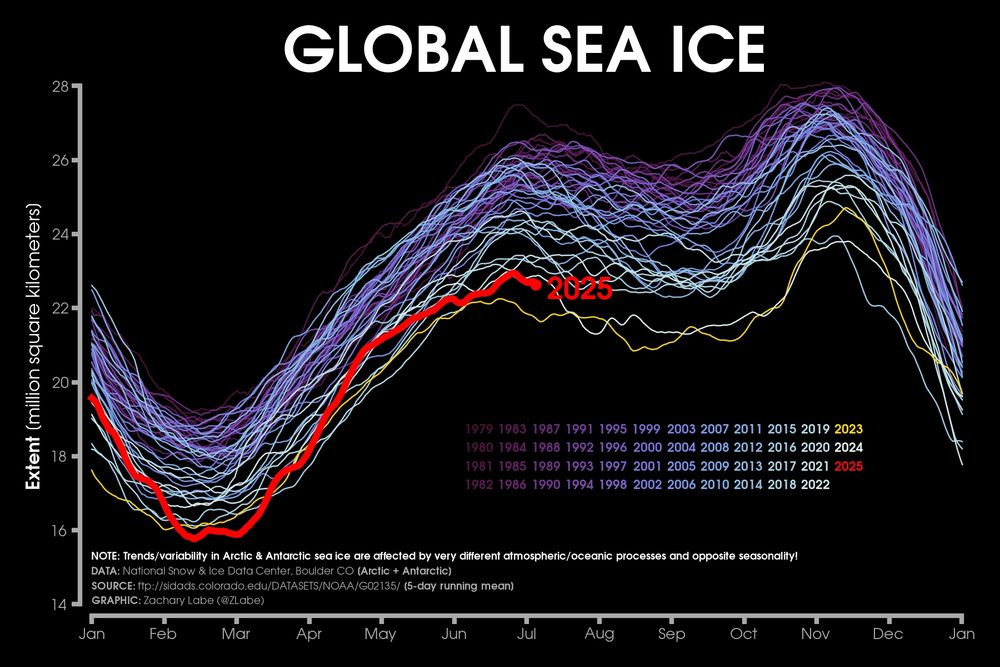
With both poles observing unusually low sea ice conditions, global sea ice extent is the 2nd lowest on record for today's date...
More sea ice graphics available at zacklabe.com/global-sea-i.... Data from @nsidc.bsky.social.
More sea ice graphics available at zacklabe.com/global-sea-i.... Data from @nsidc.bsky.social.
July 6, 2025 at 9:53 PM
With both poles observing unusually low sea ice conditions, global sea ice extent is the 2nd lowest on record for today's date...
More sea ice graphics available at zacklabe.com/global-sea-i.... Data from @nsidc.bsky.social.
More sea ice graphics available at zacklabe.com/global-sea-i.... Data from @nsidc.bsky.social.
Reposted by LHaden
The extent of snow cover in the Northern Hemisphere during June 2025 was over 2,500,000 km² below average... 🫠
There is significant year-to-year variability along with a long-term decreasing trend in boreal spring. Data and graph from climate.rutgers.edu/snowcover/in...
There is significant year-to-year variability along with a long-term decreasing trend in boreal spring. Data and graph from climate.rutgers.edu/snowcover/in...

July 6, 2025 at 3:04 PM
The extent of snow cover in the Northern Hemisphere during June 2025 was over 2,500,000 km² below average... 🫠
There is significant year-to-year variability along with a long-term decreasing trend in boreal spring. Data and graph from climate.rutgers.edu/snowcover/in...
There is significant year-to-year variability along with a long-term decreasing trend in boreal spring. Data and graph from climate.rutgers.edu/snowcover/in...
Reposted by LHaden
To complement my plot of yearly temperatures, I added a new graph showing changes in annual precipitation averaged across the contiguous United States (CONUS) from 1895 through 2024.
I will update this visualization each year at zacklabe.com/climate-chan.... Data is from NOAA NClimGrid.
I will update this visualization each year at zacklabe.com/climate-chan.... Data is from NOAA NClimGrid.

July 6, 2025 at 5:29 PM
To complement my plot of yearly temperatures, I added a new graph showing changes in annual precipitation averaged across the contiguous United States (CONUS) from 1895 through 2024.
I will update this visualization each year at zacklabe.com/climate-chan.... Data is from NOAA NClimGrid.
I will update this visualization each year at zacklabe.com/climate-chan.... Data is from NOAA NClimGrid.
Reposted by LHaden
My #Arctic sea-ice thickness and volume graphics are now updated for June 2025. This month was the 2nd lowest June volume on record. zacklabe.com/arctic-sea-i...
#SciComm #DataViz #OpenScience #OpenData
#SciComm #DataViz #OpenScience #OpenData

Arctic: Sea-Ice Thickness/Volume
Near real-time visualizations [Arctic Climate Seasonality and Variability] [Arctic Sea-Ice Extent and Concentration] [Arctic Sea-Ice Volume and Thickness] [Arctic Temperatures] [Antarctic Sea-Ice E…
zacklabe.com
July 6, 2025 at 3:53 AM
My #Arctic sea-ice thickness and volume graphics are now updated for June 2025. This month was the 2nd lowest June volume on record. zacklabe.com/arctic-sea-i...
#SciComm #DataViz #OpenScience #OpenData
#SciComm #DataViz #OpenScience #OpenData
A baby roadrunner at my house.

May 17, 2025 at 6:37 PM
A baby roadrunner at my house.
Reposted by LHaden
Yes, Antarctic sea-ice extent has been crashing, with the 3-year running average recently setting a new record low, down nearly 20% from its 2016 peak and more than 10% from its long-term average.
The 3-year running average smoothes out short-term anomalies and tells the story:
The 3-year running average smoothes out short-term anomalies and tells the story:

May 17, 2025 at 3:26 PM
Yes, Antarctic sea-ice extent has been crashing, with the 3-year running average recently setting a new record low, down nearly 20% from its 2016 peak and more than 10% from its long-term average.
The 3-year running average smoothes out short-term anomalies and tells the story:
The 3-year running average smoothes out short-term anomalies and tells the story:
Reposted by LHaden

The only way to stop climate change is to drastically reduce CO₂ emissions.

May 15, 2025 at 12:27 PM
The only way to stop climate change is to drastically reduce CO₂ emissions.
Reposted by LHaden

The official Climate Prediction Center summer outlook posted today. Another hot girl summer?

May 15, 2025 at 5:16 PM
The official Climate Prediction Center summer outlook posted today. Another hot girl summer?
Reposted by LHaden
Breaking News!
Code Yikes!
April data for "total column precipitable water" just came in from ECMWF, and, you guessed it, yet another record high for the 36-month running average, while April 2025 was the third highest April since 1940.
Information overload summary: a hard rain's a-gonna fall.
Code Yikes!
April data for "total column precipitable water" just came in from ECMWF, and, you guessed it, yet another record high for the 36-month running average, while April 2025 was the third highest April since 1940.
Information overload summary: a hard rain's a-gonna fall.

May 8, 2025 at 1:20 PM
Breaking News!
Code Yikes!
April data for "total column precipitable water" just came in from ECMWF, and, you guessed it, yet another record high for the 36-month running average, while April 2025 was the third highest April since 1940.
Information overload summary: a hard rain's a-gonna fall.
Code Yikes!
April data for "total column precipitable water" just came in from ECMWF, and, you guessed it, yet another record high for the 36-month running average, while April 2025 was the third highest April since 1940.
Information overload summary: a hard rain's a-gonna fall.
As with many dark corners of the internet, once you see it, you can't un-see it.


May 4, 2025 at 12:44 PM
As with many dark corners of the internet, once you see it, you can't un-see it.
Words of wisdom.

Hard reminder tonight that my chances of being killed by a goose are low… but never zero.


May 3, 2025 at 1:30 PM
Words of wisdom.
Reposted by LHaden

Oh look, the new tax is kicking in. It's good they break it out so that you can see it.

April 20, 2025 at 12:14 PM
Oh look, the new tax is kicking in. It's good they break it out so that you can see it.
Reposted by LHaden

⚠️ Freeze Watch is in effect Sunday morning for the Albuquerque Metro. Temperatures could drop down into the upper 20s and low 30s. #NMwx

April 18, 2025 at 10:58 PM
⚠️ Freeze Watch is in effect Sunday morning for the Albuquerque Metro. Temperatures could drop down into the upper 20s and low 30s. #NMwx
Reposted by LHaden
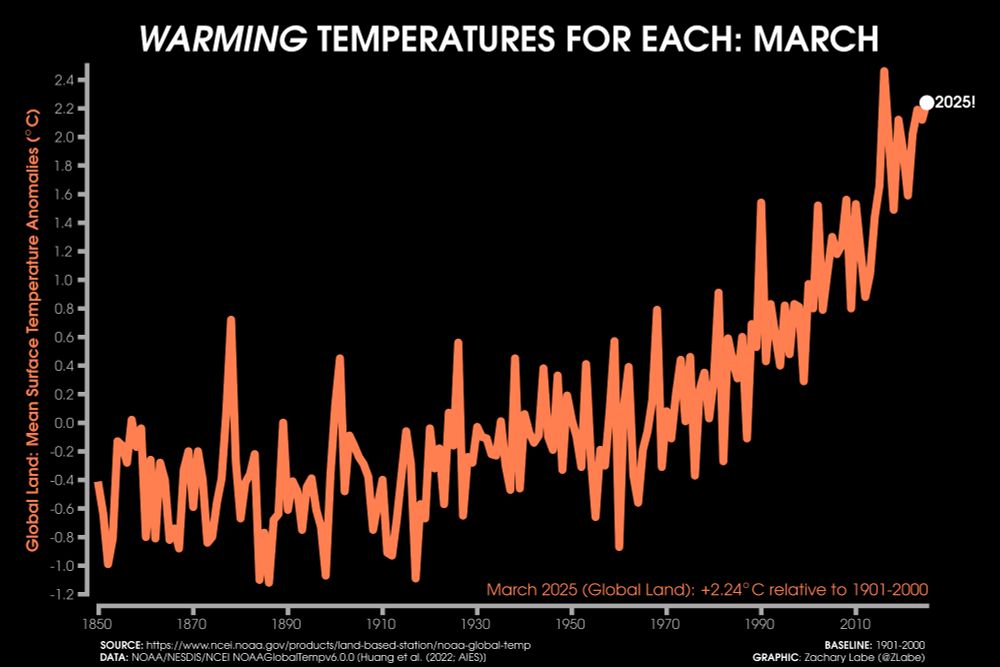
Last month was the 2nd warmest March on record for land areas around the world...
Data provided by @noaa.gov NOAAGlobalTemp v6.0.0 (www.ncei.noaa.gov/products/lan...).
Data provided by @noaa.gov NOAAGlobalTemp v6.0.0 (www.ncei.noaa.gov/products/lan...).
April 19, 2025 at 1:51 AM
Last month was the 2nd warmest March on record for land areas around the world...
Data provided by @noaa.gov NOAAGlobalTemp v6.0.0 (www.ncei.noaa.gov/products/lan...).
Data provided by @noaa.gov NOAAGlobalTemp v6.0.0 (www.ncei.noaa.gov/products/lan...).
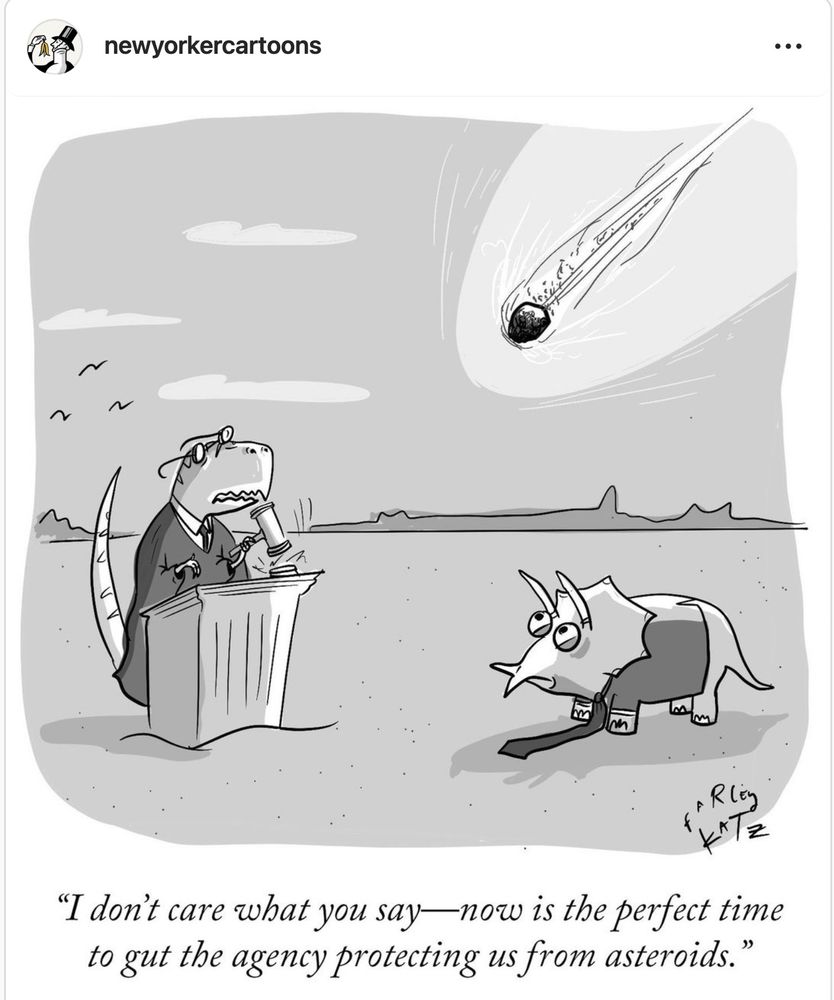
Reposted by LHaden

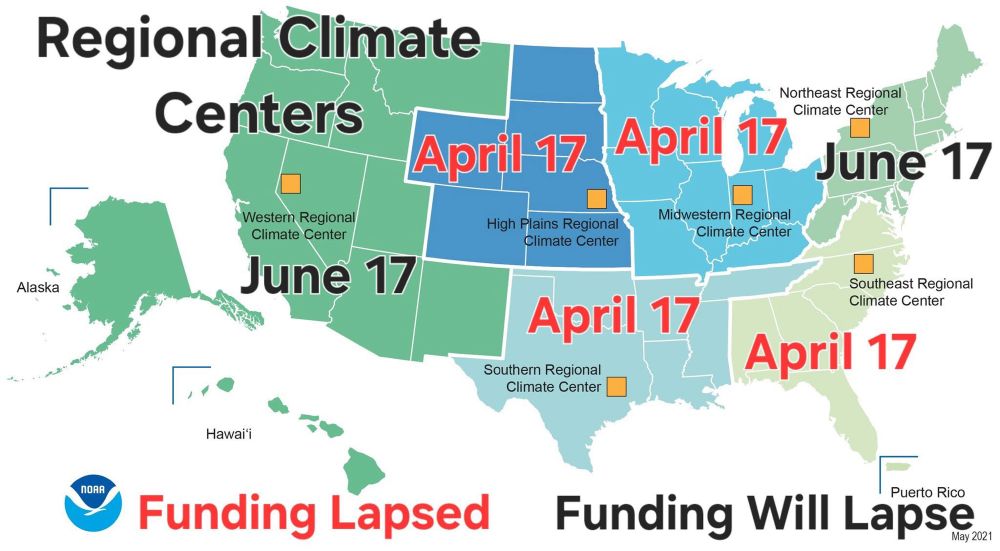
NOAA Regional Climate Centers’ contracts are lapsing, and they are shutting down. The administration wants Congress to eliminate the NOAA office of Oceanic and Atmospheric Research, which supports thousands of employees and university research. It’s up to you to advocate against these cuts!
April 17, 2025 at 5:57 PM
NOAA Regional Climate Centers’ contracts are lapsing, and they are shutting down. The administration wants Congress to eliminate the NOAA office of Oceanic and Atmospheric Research, which supports thousands of employees and university research. It’s up to you to advocate against these cuts!