


Tom Di Liberto
@tdiliberto.bsky.social
Climate scientist and science communicator who dabbles in comedy.
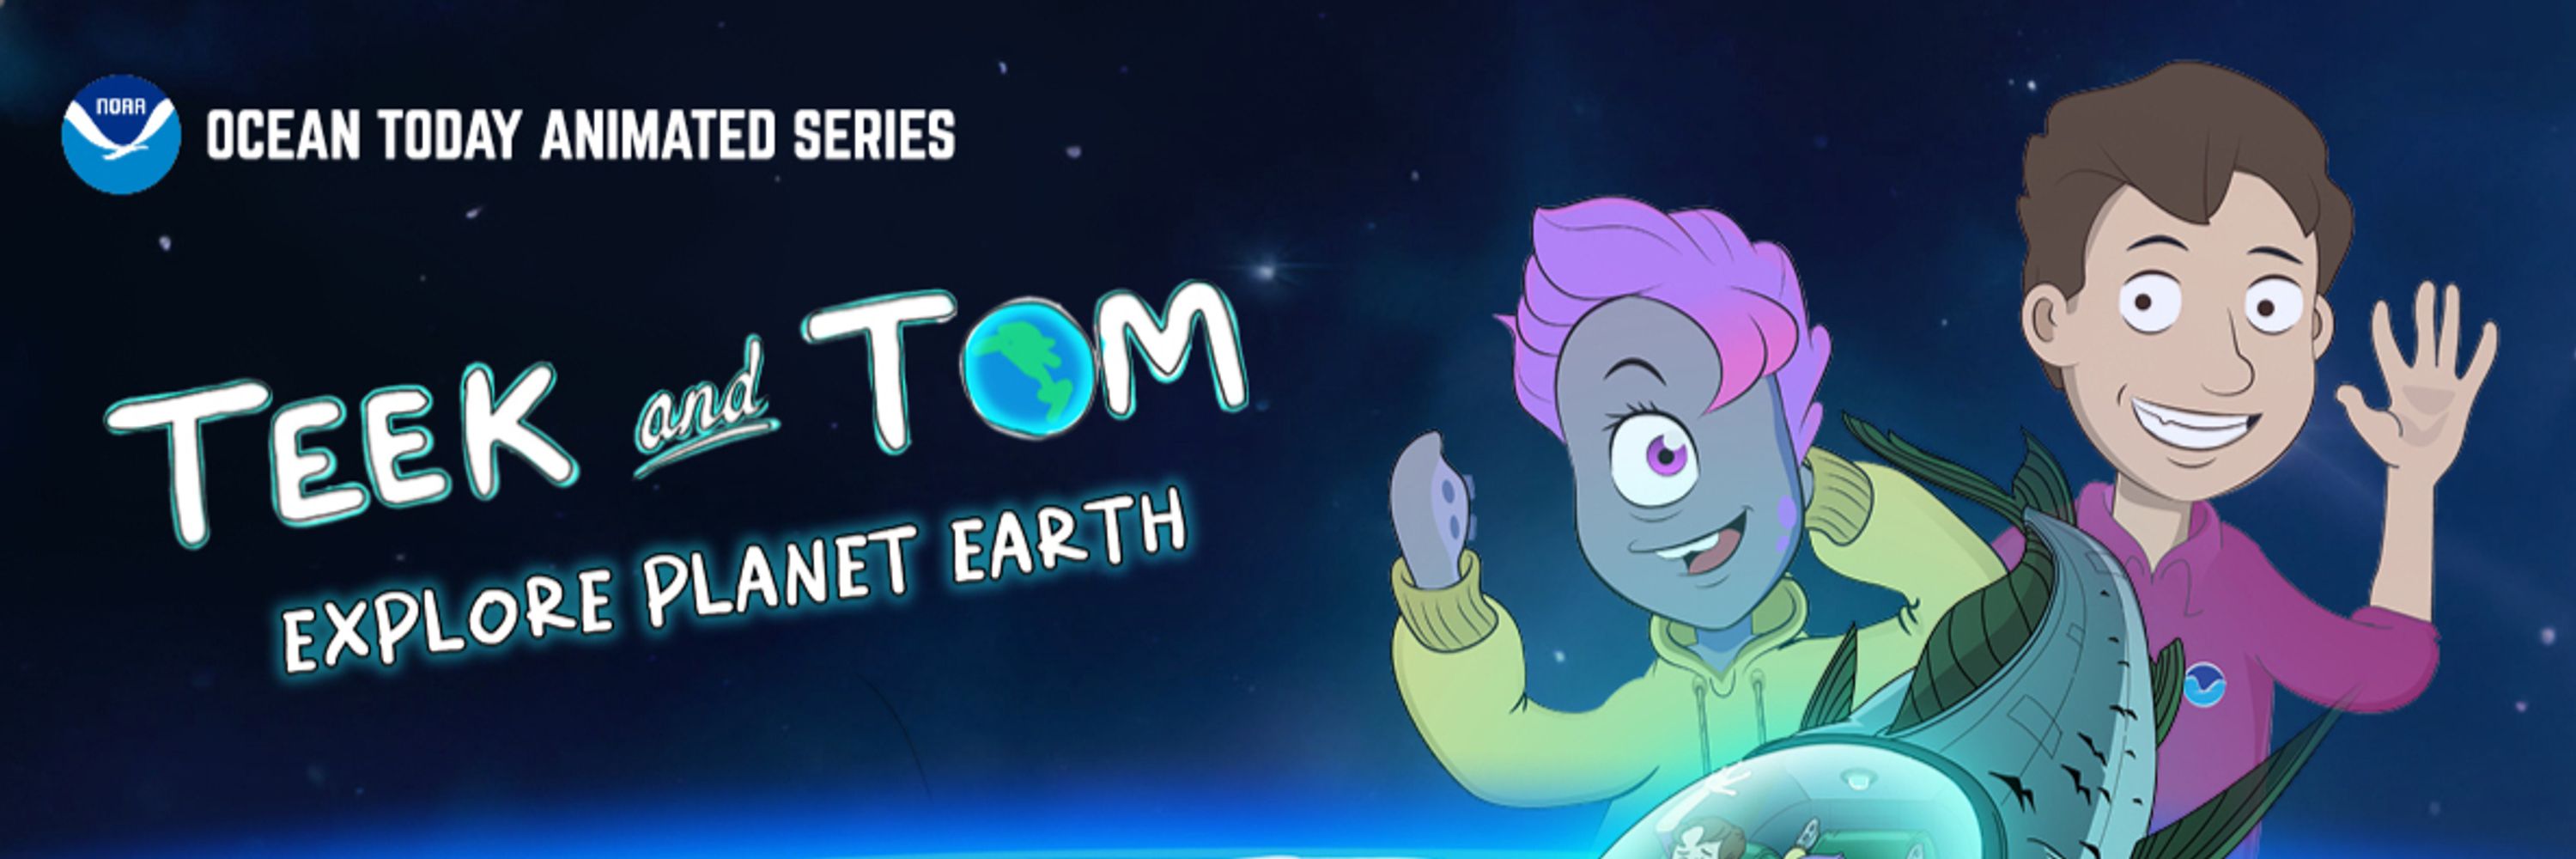
Creator of NOAA's Teek and Tom cartoon series focused on weather, climate and ocean science.
If in Washington DC, come check out my science improv troupe at Washington Improv theater
Creator of NOAA's Teek and Tom cartoon series focused on weather, climate and ocean science.
If in Washington DC, come check out my science improv troupe at Washington Improv theater
Reposted by Tom Di Liberto

🌹Roses are red,
🌊The ocean is blue.
🌍Climate science matters,
💚And so do YOU.
Happy #ValentinesDay from Climate Central💙
🌊The ocean is blue.
🌍Climate science matters,
💚And so do YOU.
Happy #ValentinesDay from Climate Central💙


February 13, 2026 at 5:01 PM
🌹Roses are red,
🌊The ocean is blue.
🌍Climate science matters,
💚And so do YOU.
Happy #ValentinesDay from Climate Central💙
🌊The ocean is blue.
🌍Climate science matters,
💚And so do YOU.
Happy #ValentinesDay from Climate Central💙
Things are less than ideal right now. Here are some climate-themed valentines to, at least, maybe put a slight smile on your face.
🌹Roses are red,
🌊The ocean is blue.
🌍Climate science matters,
💚And so do YOU.
Happy #ValentinesDay from Climate Central💙
🌊The ocean is blue.
🌍Climate science matters,
💚And so do YOU.
Happy #ValentinesDay from Climate Central💙
February 13, 2026 at 6:09 PM
Things are less than ideal right now. Here are some climate-themed valentines to, at least, maybe put a slight smile on your face.
Reposted by Tom Di Liberto

You can't... repeal... a scientific finding. At that point it's just called lying about it.

Breaking News: The Trump administration repealed the bedrock scientific finding that greenhouse gases threaten human life and well being, meaning that the EPA can no longer regulate them. nyti.ms/4rSszQu

February 12, 2026 at 8:38 PM
You can't... repeal... a scientific finding. At that point it's just called lying about it.
Reposted by Tom Di Liberto
It's been hot across the West and cold across the East. Why? Join us for the next Monthly Climate Brief as we dig in. And stay for a live demo of a new Climate Central tool designed to help you understand and tell local climate stories.
📆 February 17, Noon EST
Register: bit.ly/3OrhGGw
📆 February 17, Noon EST
Register: bit.ly/3OrhGGw

February 10, 2026 at 7:42 PM
It's been hot across the West and cold across the East. Why? Join us for the next Monthly Climate Brief as we dig in. And stay for a live demo of a new Climate Central tool designed to help you understand and tell local climate stories.
📆 February 17, Noon EST
Register: bit.ly/3OrhGGw
📆 February 17, Noon EST
Register: bit.ly/3OrhGGw
Reposted by Tom Di Liberto

I love writing about geeky science that has real-world implications. In this case, a new NOAA index does a more solid job of classifying El Niño and La Niña—and that helps explain some recent puzzling events. @climateconnections.bsky.social
yaleclimateconnections.org/2026/02/a-ne...
yaleclimateconnections.org/2026/02/a-ne...

A new and better way to keep tabs on El Niño and La Niña » Yale Climate Connections
Developed in response to a warming world, NOAA’s revised scale more precisely identifies which episodes are likely to have the biggest impacts.
yaleclimateconnections.org
February 5, 2026 at 6:06 PM
I love writing about geeky science that has real-world implications. In this case, a new NOAA index does a more solid job of classifying El Niño and La Niña—and that helps explain some recent puzzling events. @climateconnections.bsky.social
yaleclimateconnections.org/2026/02/a-ne...
yaleclimateconnections.org/2026/02/a-ne...
Reposted by Tom Di Liberto

🚨Our new paper led by Dr. @zialyle.bsky.social looked at how climate change poses risks to US drinking water utilities & if their bonds disclose these risks to investors. Utilities serving 67 million people have high risks, but 36% of their bonds don't mention climate: www.nature.com/articles/s43...

Climate change risk index and municipal bond disclosures of United States drinking water utilities - Communications Earth & Environment
67 million customers across the US rely on drinking water utilities that face higher climate risk than accounted for, which exposes major gaps in climate adaptation and resilience planning, suggests a...
www.nature.com
February 3, 2026 at 1:06 AM
🚨Our new paper led by Dr. @zialyle.bsky.social looked at how climate change poses risks to US drinking water utilities & if their bonds disclose these risks to investors. Utilities serving 67 million people have high risks, but 36% of their bonds don't mention climate: www.nature.com/articles/s43...
Reposted by Tom Di Liberto

Reposted by Tom Di Liberto
What's in store tomorrow, January 27, at #AMS2026 from Climate Central?
Talks on💲Billion dollar disasters, climate change + ER visits, Urban Heat Islands, Precipitation attribution, and climate visualizations.
🗣️ Reach out to us if you'd like to connect!
Talks on💲Billion dollar disasters, climate change + ER visits, Urban Heat Islands, Precipitation attribution, and climate visualizations.
🗣️ Reach out to us if you'd like to connect!

January 26, 2026 at 11:00 PM
What's in store tomorrow, January 27, at #AMS2026 from Climate Central?
Talks on💲Billion dollar disasters, climate change + ER visits, Urban Heat Islands, Precipitation attribution, and climate visualizations.
🗣️ Reach out to us if you'd like to connect!
Talks on💲Billion dollar disasters, climate change + ER visits, Urban Heat Islands, Precipitation attribution, and climate visualizations.
🗣️ Reach out to us if you'd like to connect!
Reposted by Tom Di Liberto
The extreme cold across eastern N America is due to the Alaskan Ridge regime, which on average brings the coldest winter weather to this region.
Is this happening more often?
No. During the modern warming era, there has been no observed trend in the occurrence of this regime at this time of year.
Is this happening more often?
No. During the modern warming era, there has been no observed trend in the occurrence of this regime at this time of year.

January 23, 2026 at 4:59 PM
The extreme cold across eastern N America is due to the Alaskan Ridge regime, which on average brings the coldest winter weather to this region.
Is this happening more often?
No. During the modern warming era, there has been no observed trend in the occurrence of this regime at this time of year.
Is this happening more often?
No. During the modern warming era, there has been no observed trend in the occurrence of this regime at this time of year.
Reposted by Tom Di Liberto
No Winter Olympics in Salt Lake City in 2034? It's possible says Rocky Anderson, former Salt Lake City Mayor during the 2002 Winter Games.
youtube.com/shorts/w2uhr...
youtube.com/shorts/w2uhr...

No winter games in Salt Lake City in 2034? Not out of the realm of possibility.
YouTube video by climatecentral
youtube.com
January 23, 2026 at 4:04 PM
No Winter Olympics in Salt Lake City in 2034? It's possible says Rocky Anderson, former Salt Lake City Mayor during the 2002 Winter Games.
youtube.com/shorts/w2uhr...
youtube.com/shorts/w2uhr...
Reposted by Tom Di Liberto
⛷️ ⛸️ The 2026 Winter Olympics in Milan and Cortina d'Ampezzo, Italy starts soon on February 6! 🔥 And it's a heck of a lot warmer—+6.4°F—than the first time Cortina held the Winter Games back in 1956.
📊 Let's ski jump right in ⬇️
📊 Let's ski jump right in ⬇️

January 21, 2026 at 5:45 PM
⛷️ ⛸️ The 2026 Winter Olympics in Milan and Cortina d'Ampezzo, Italy starts soon on February 6! 🔥 And it's a heck of a lot warmer—+6.4°F—than the first time Cortina held the Winter Games back in 1956.
📊 Let's ski jump right in ⬇️
📊 Let's ski jump right in ⬇️
Reposted by Tom Di Liberto

Today we release our Gallagher Re 2025 Natural Catastrophe and Climate Report.
Full Report: www.ajg.com/gallagherre/...
Economic Loss: $296bn (-25% vs 10 Yr Avg; $394 bn)
Insured Loss: $129bn (-5% vs 10 Yr Avg; $136 bn)
(1/n)
Full Report: www.ajg.com/gallagherre/...
Economic Loss: $296bn (-25% vs 10 Yr Avg; $394 bn)
Insured Loss: $129bn (-5% vs 10 Yr Avg; $136 bn)
(1/n)
www.ajg.com
January 21, 2026 at 2:50 PM
Today we release our Gallagher Re 2025 Natural Catastrophe and Climate Report.
Full Report: www.ajg.com/gallagherre/...
Economic Loss: $296bn (-25% vs 10 Yr Avg; $394 bn)
Insured Loss: $129bn (-5% vs 10 Yr Avg; $136 bn)
(1/n)
Full Report: www.ajg.com/gallagherre/...
Economic Loss: $296bn (-25% vs 10 Yr Avg; $394 bn)
Insured Loss: $129bn (-5% vs 10 Yr Avg; $136 bn)
(1/n)
Reposted by Tom Di Liberto

A year ago, Southern California was parched. Now, it’s soaked, thanks to atmospheric rivers. This animation shows GOES satellite images from dawn to dusk on December 31, 2025, as an atmospheric river (right of bottom center of the frame) feeds a storm. Read the feature story at Climate.us.
January 19, 2026 at 12:20 PM
A year ago, Southern California was parched. Now, it’s soaked, thanks to atmospheric rivers. This animation shows GOES satellite images from dawn to dusk on December 31, 2025, as an atmospheric river (right of bottom center of the frame) feeds a storm. Read the feature story at Climate.us.
Reposted by Tom Di Liberto

The first half of meteorological winter was record warm for an extraordinary swath of the West, from Las Vegas to Denver, Salt Lake City to Seattle and Phoenix to Portland. The anomalously temperatures are fueling a snow drought, concerning scientists.
www.sfchronicle.com/weather/arti...
www.sfchronicle.com/weather/arti...

January 16, 2026 at 4:21 PM
The first half of meteorological winter was record warm for an extraordinary swath of the West, from Las Vegas to Denver, Salt Lake City to Seattle and Phoenix to Portland. The anomalously temperatures are fueling a snow drought, concerning scientists.
www.sfchronicle.com/weather/arti...
www.sfchronicle.com/weather/arti...
🌊🔥

2025 was the hottest year on record for ocean heat content. Unfortunately, we now say this every year. 🥹
"In addition to setting a new record in 2025, the global
ocean continues to show sustained and intensified warming."
+ #OpenAccess Study: doi.org/10.1007/s003...
+ Data: www.ocean.iap.ac.cn
"In addition to setting a new record in 2025, the global
ocean continues to show sustained and intensified warming."
+ #OpenAccess Study: doi.org/10.1007/s003...
+ Data: www.ocean.iap.ac.cn

January 10, 2026 at 4:35 PM
🌊🔥
Mark it down on your calendars! Our next monthly climate brief will be on January 20th
🗓️Tuesday, January 20 | 12pm ET
Join us for a live discussion breaking down December’s climate numbers, the latest global & U.S. climate change data, and a deep dive into 2025’s U.S. Billion-Dollar Weather Disasters.
🔗Register: climatecentral-org.zoom.us/webinar/regi...
Join us for a live discussion breaking down December’s climate numbers, the latest global & U.S. climate change data, and a deep dive into 2025’s U.S. Billion-Dollar Weather Disasters.
🔗Register: climatecentral-org.zoom.us/webinar/regi...
January 9, 2026 at 10:27 PM
Mark it down on your calendars! Our next monthly climate brief will be on January 20th
Reposted by Tom Di Liberto

One more for the to-read pile

Yay! Thrilled that the volume I co-edited with Saima Kazmi and Burton St. John is available for pre-order: Public Relations in Times of Dissensus: Narratives, Artifacts, and the Challenges of Meaning. It’s a pretty timely exploration of how we can communicate with the public when we all disagree.

Public Relations in Times of Dissensus
Public relations are entering an era marked by increasing societal dissensus, where shared narratives are breaking down and contentious communication defines th…
www.bloomsbury.com
January 9, 2026 at 2:41 PM
One more for the to-read pile
Reposted by Tom Di Liberto

Best TikTok thing going is the two dudes trying food from every country without leaving NYC. If you haven’t seen them yet, it’s incredible. My favorite so far is last week’s. Legit got me emotional.
January 9, 2026 at 1:50 AM
Best TikTok thing going is the two dudes trying food from every country without leaving NYC. If you haven’t seen them yet, it’s incredible. My favorite so far is last week’s. Legit got me emotional.
Reposted by Tom Di Liberto

“Survey after survey has shown that business owners overestimate how many customers drive to their stores vs walking or biking. In a 2012 Los Angeles study, more than half of the store owners on the bike-laned part of the boulevard thought most of their customers drove. The actual number was 15%.”

I read all the studies on the economic impact of bike lanes. Here's what I learned.
Research proves that bike lanes are good for business. So why do so many stores and restaurants still oppose them?
www.businessinsider.com
January 2, 2026 at 4:41 AM
“Survey after survey has shown that business owners overestimate how many customers drive to their stores vs walking or biking. In a 2012 Los Angeles study, more than half of the store owners on the bike-laned part of the boulevard thought most of their customers drove. The actual number was 15%.”
The amount of times I think of this comic strip when I'm feeling down, hopeless or in a rut.

The final Calvin and Hobbes, which appeared in papers 30 years ago today.

December 31, 2025 at 11:12 PM
The amount of times I think of this comic strip when I'm feeling down, hopeless or in a rut.
Next Monthly Climate Brief from @climatecentral.org is on January 20! Register below.
November 2025 ranked as the 4th warmest November on record for the contiguous U.S.🌡️
December brought cooler conditions to the Northeast, but record warmth across the West. We’ll dig into what’s driving December in our next webinar.
🗓️Tuesday, January 20 | 12pm ET
🔗Please Register: buff.ly/tvpvvHG
December brought cooler conditions to the Northeast, but record warmth across the West. We’ll dig into what’s driving December in our next webinar.
🗓️Tuesday, January 20 | 12pm ET
🔗Please Register: buff.ly/tvpvvHG

December 31, 2025 at 3:41 AM
Next Monthly Climate Brief from @climatecentral.org is on January 20! Register below.
Reposted by Tom Di Liberto
November 2025 ranked as the 4th warmest November on record for the contiguous U.S.🌡️
December brought cooler conditions to the Northeast, but record warmth across the West. We’ll dig into what’s driving December in our next webinar.
🗓️Tuesday, January 20 | 12pm ET
🔗Please Register: buff.ly/tvpvvHG
December brought cooler conditions to the Northeast, but record warmth across the West. We’ll dig into what’s driving December in our next webinar.
🗓️Tuesday, January 20 | 12pm ET
🔗Please Register: buff.ly/tvpvvHG
December 30, 2025 at 6:00 PM
November 2025 ranked as the 4th warmest November on record for the contiguous U.S.🌡️
December brought cooler conditions to the Northeast, but record warmth across the West. We’ll dig into what’s driving December in our next webinar.
🗓️Tuesday, January 20 | 12pm ET
🔗Please Register: buff.ly/tvpvvHG
December brought cooler conditions to the Northeast, but record warmth across the West. We’ll dig into what’s driving December in our next webinar.
🗓️Tuesday, January 20 | 12pm ET
🔗Please Register: buff.ly/tvpvvHG
Reposted by Tom Di Liberto
Records roasting over an open fire.
Holiday heat check (Dec 22-28):
- 2,135 record highs set
- 2,610 record warm lows
vs just 25 record lows and 30 record cool highs
Not your classic December weather...
/1
Holiday heat check (Dec 22-28):
- 2,135 record highs set
- 2,610 record warm lows
vs just 25 record lows and 30 record cool highs
Not your classic December weather...
/1
December 29, 2025 at 5:38 PM
Records roasting over an open fire.
Holiday heat check (Dec 22-28):
- 2,135 record highs set
- 2,610 record warm lows
vs just 25 record lows and 30 record cool highs
Not your classic December weather...
/1
Holiday heat check (Dec 22-28):
- 2,135 record highs set
- 2,610 record warm lows
vs just 25 record lows and 30 record cool highs
Not your classic December weather...
/1
Bonkers heat🔥
Records roasting over an open fire.
Holiday heat check (Dec 22-28):
- 2,135 record highs set
- 2,610 record warm lows
vs just 25 record lows and 30 record cool highs
Not your classic December weather...
/1
Holiday heat check (Dec 22-28):
- 2,135 record highs set
- 2,610 record warm lows
vs just 25 record lows and 30 record cool highs
Not your classic December weather...
/1
December 29, 2025 at 7:23 PM
Bonkers heat🔥
Reposted by Tom Di Liberto
Climate change isn't the sole culprit of this holiday heat, but it did make it much more likely than past generations would have experienced.
Climate Shift Index shows human-caused climate change made this widespread warmth far more likely -- and in some areas, nearly impossible without it.
Climate Shift Index shows human-caused climate change made this widespread warmth far more likely -- and in some areas, nearly impossible without it.

December 29, 2025 at 5:38 PM
Climate change isn't the sole culprit of this holiday heat, but it did make it much more likely than past generations would have experienced.
Climate Shift Index shows human-caused climate change made this widespread warmth far more likely -- and in some areas, nearly impossible without it.
Climate Shift Index shows human-caused climate change made this widespread warmth far more likely -- and in some areas, nearly impossible without it.