


Climate Central
@climatecentral.org
Researching and reporting the science and impacts of climate change 🌎
climatecentral.org
climatecentral.org
Reposted by Climate Central

The 2026 #WinterOlympics are taking place on fake snow, and almost no one is talking about what that really means.
The Alps are warming fast.
This year’s Games may be the clearest warning yet of a winter on the brink.
👉 Read ow.ly/jwKc50YbQYs
@WWFitalia #ClimateCrisis
The Alps are warming fast.
This year’s Games may be the clearest warning yet of a winter on the brink.
👉 Read ow.ly/jwKc50YbQYs
@WWFitalia #ClimateCrisis

February 9, 2026 at 6:17 PM
The 2026 #WinterOlympics are taking place on fake snow, and almost no one is talking about what that really means.
The Alps are warming fast.
This year’s Games may be the clearest warning yet of a winter on the brink.
👉 Read ow.ly/jwKc50YbQYs
@WWFitalia #ClimateCrisis
The Alps are warming fast.
This year’s Games may be the clearest warning yet of a winter on the brink.
👉 Read ow.ly/jwKc50YbQYs
@WWFitalia #ClimateCrisis
Athletes: Ready.
Fans: Excited.
How is climate change playing a role at #WinterOlympic2026? What about future Games?
Let's sled through the details in ~90 seconds ⤵️
youtube.com/shorts/PIizG...
Fans: Excited.
How is climate change playing a role at #WinterOlympic2026? What about future Games?
Let's sled through the details in ~90 seconds ⤵️
youtube.com/shorts/PIizG...

Winter Olympics vs Climate Change
YouTube video by climatecentral
youtube.com
February 6, 2026 at 10:42 PM
Athletes: Ready.
Fans: Excited.
How is climate change playing a role at #WinterOlympic2026? What about future Games?
Let's sled through the details in ~90 seconds ⤵️
youtube.com/shorts/PIizG...
Fans: Excited.
How is climate change playing a role at #WinterOlympic2026? What about future Games?
Let's sled through the details in ~90 seconds ⤵️
youtube.com/shorts/PIizG...
#WinterOlympics start today! 🏅❄️
📍Events span northern Italy. Indoor competitions in Milan & outdoor events in Cortina d’Ampezzo.
Climate change is also showing up…going for gold, threatening the future viability of the Games.
🧵Let’s ski down this slope together🎿
📍Events span northern Italy. Indoor competitions in Milan & outdoor events in Cortina d’Ampezzo.
Climate change is also showing up…going for gold, threatening the future viability of the Games.
🧵Let’s ski down this slope together🎿
February 6, 2026 at 5:00 PM
#WinterOlympics start today! 🏅❄️
📍Events span northern Italy. Indoor competitions in Milan & outdoor events in Cortina d’Ampezzo.
Climate change is also showing up…going for gold, threatening the future viability of the Games.
🧵Let’s ski down this slope together🎿
📍Events span northern Italy. Indoor competitions in Milan & outdoor events in Cortina d’Ampezzo.
Climate change is also showing up…going for gold, threatening the future viability of the Games.
🧵Let’s ski down this slope together🎿
Join us on February 17 for the next Monthly Climate Brief as we overview the latest global and U.S. climate stats from January 2026, and dig into the striking U.S. weather contrast between the cold East and the warm West.
🗓️ February 17, 12pm EST.
📝 buff.ly/6jd1vph
🗓️ February 17, 12pm EST.
📝 buff.ly/6jd1vph

February 5, 2026 at 10:16 PM
Join us on February 17 for the next Monthly Climate Brief as we overview the latest global and U.S. climate stats from January 2026, and dig into the striking U.S. weather contrast between the cold East and the warm West.
🗓️ February 17, 12pm EST.
📝 buff.ly/6jd1vph
🗓️ February 17, 12pm EST.
📝 buff.ly/6jd1vph
Reposted by Climate Central

"In a warming world there are… Still freezing nights — but fewer of them.
In a warming world there are… Still cold streaks — but shorter ones.
In a warming world there are… Still extremely cold days — but not as cold."
➡️ More in @climatecentral.org's latest: www.climatecentral.org/climate-matt...
In a warming world there are… Still cold streaks — but shorter ones.
In a warming world there are… Still extremely cold days — but not as cold."
➡️ More in @climatecentral.org's latest: www.climatecentral.org/climate-matt...

February 5, 2026 at 9:00 PM
"In a warming world there are… Still freezing nights — but fewer of them.
In a warming world there are… Still cold streaks — but shorter ones.
In a warming world there are… Still extremely cold days — but not as cold."
➡️ More in @climatecentral.org's latest: www.climatecentral.org/climate-matt...
In a warming world there are… Still cold streaks — but shorter ones.
In a warming world there are… Still extremely cold days — but not as cold."
➡️ More in @climatecentral.org's latest: www.climatecentral.org/climate-matt...
🛣️ 🌉 🚆 🛳️ The nation’s vital but aging roads, railroads, bridges, and ports face rising risks from climate change and extreme weather.🔥⛈️🌊 🌀
📊 What can we do?
Cut heat-trapping pollution!
Institute adaptation methods to make transportation systems more climate resilient.
📊 What can we do?
Cut heat-trapping pollution!
Institute adaptation methods to make transportation systems more climate resilient.


February 4, 2026 at 9:56 PM
🛣️ 🌉 🚆 🛳️ The nation’s vital but aging roads, railroads, bridges, and ports face rising risks from climate change and extreme weather.🔥⛈️🌊 🌀
📊 What can we do?
Cut heat-trapping pollution!
Institute adaptation methods to make transportation systems more climate resilient.
📊 What can we do?
Cut heat-trapping pollution!
Institute adaptation methods to make transportation systems more climate resilient.
Reposted by Climate Central

Metcalf and @soljourno.bsky.social are teaming up to offer another free science training for journalists – on an issue many of us are feeling the effects of right now: Causes and Responses to Extreme Winter Weather. Join us Feb. 18 at 1 PM!
ow.ly/YVeX50Y8lZp
ow.ly/YVeX50Y8lZp

February 4, 2026 at 4:18 PM
Metcalf and @soljourno.bsky.social are teaming up to offer another free science training for journalists – on an issue many of us are feeling the effects of right now: Causes and Responses to Extreme Winter Weather. Join us Feb. 18 at 1 PM!
ow.ly/YVeX50Y8lZp
ow.ly/YVeX50Y8lZp
Punxsutawney Phil: “There’s my shadow! 6 more weeks of winter!!”
The western U.S.: 😶 (…still waiting on winter, with another well-above-average week underway)
🧵/1
The western U.S.: 😶 (…still waiting on winter, with another well-above-average week underway)
🧵/1

February 3, 2026 at 6:22 PM
Punxsutawney Phil: “There’s my shadow! 6 more weeks of winter!!”
The western U.S.: 😶 (…still waiting on winter, with another well-above-average week underway)
🧵/1
The western U.S.: 😶 (…still waiting on winter, with another well-above-average week underway)
🧵/1
Ol’ Punxsutawney Phil saw his shadow this morning. 🐿️
Does the thought of 6 more weeks of winter make you want to dive back into your burrow?
Let’s have a very quick chat about climate change and this fastest warming season for much of the U.S. ⬇️
Does the thought of 6 more weeks of winter make you want to dive back into your burrow?
Let’s have a very quick chat about climate change and this fastest warming season for much of the U.S. ⬇️


February 2, 2026 at 5:01 PM
Ol’ Punxsutawney Phil saw his shadow this morning. 🐿️
Does the thought of 6 more weeks of winter make you want to dive back into your burrow?
Let’s have a very quick chat about climate change and this fastest warming season for much of the U.S. ⬇️
Does the thought of 6 more weeks of winter make you want to dive back into your burrow?
Let’s have a very quick chat about climate change and this fastest warming season for much of the U.S. ⬇️
Want a good example of weather vs. climate? It's outside your window right now! 🪟
🥶 It's fair to say that for many in the U.S. it's quite cold out.
🔥 And yet, not only is winter warming quickly as a season but it's the fastest warming season for the central and eastern U.S.
🥶 It's fair to say that for many in the U.S. it's quite cold out.
🔥 And yet, not only is winter warming quickly as a season but it's the fastest warming season for the central and eastern U.S.


January 29, 2026 at 6:26 PM
Want a good example of weather vs. climate? It's outside your window right now! 🪟
🥶 It's fair to say that for many in the U.S. it's quite cold out.
🔥 And yet, not only is winter warming quickly as a season but it's the fastest warming season for the central and eastern U.S.
🥶 It's fair to say that for many in the U.S. it's quite cold out.
🔥 And yet, not only is winter warming quickly as a season but it's the fastest warming season for the central and eastern U.S.
🌡️ #ThisisClimateChange Human-caused climate change significantly increased the likelihood of recent extreme heat across southeastern Australia:
MORE DETAILS + EXPLORE THE DATA ⬇️⬇️ : www.climatecentral.org/climate-shif...
MORE DETAILS + EXPLORE THE DATA ⬇️⬇️ : www.climatecentral.org/climate-shif...
January 28, 2026 at 12:07 AM
🌡️ #ThisisClimateChange Human-caused climate change significantly increased the likelihood of recent extreme heat across southeastern Australia:
MORE DETAILS + EXPLORE THE DATA ⬇️⬇️ : www.climatecentral.org/climate-shif...
MORE DETAILS + EXPLORE THE DATA ⬇️⬇️ : www.climatecentral.org/climate-shif...
Interested in the 2025 Texas Floods and science policy? Check out the events below, featuring Climate Central, on January 28-29 at #AMS2026.

January 27, 2026 at 11:01 PM
Interested in the 2025 Texas Floods and science policy? Check out the events below, featuring Climate Central, on January 28-29 at #AMS2026.
⛷️ 📣 Press briefing: Join Climate Central experts and @coveringclimatenow.org tomorrow, January 28, at 12pm US Eastern Time, to learn about how climate change has been impacting the Winter Olympic Games, which begin Friday, February 6.
🖋️ Register: buff.ly/DSbAERM
🖋️ Register: buff.ly/DSbAERM

January 27, 2026 at 6:30 PM
⛷️ 📣 Press briefing: Join Climate Central experts and @coveringclimatenow.org tomorrow, January 28, at 12pm US Eastern Time, to learn about how climate change has been impacting the Winter Olympic Games, which begin Friday, February 6.
🖋️ Register: buff.ly/DSbAERM
🖋️ Register: buff.ly/DSbAERM
♨️Heatwave warnings across Australia:
Tuesday brought sweltering 110–115°F+ (43–46°C) highs, ~17°C (30°F) above average for this time of year.
Attribution science of the Climate Shift Index shows heat this extreme would be rare, if not nearly impossible, without human-caused climate change.
Tuesday brought sweltering 110–115°F+ (43–46°C) highs, ~17°C (30°F) above average for this time of year.
Attribution science of the Climate Shift Index shows heat this extreme would be rare, if not nearly impossible, without human-caused climate change.


January 27, 2026 at 3:52 PM
♨️Heatwave warnings across Australia:
Tuesday brought sweltering 110–115°F+ (43–46°C) highs, ~17°C (30°F) above average for this time of year.
Attribution science of the Climate Shift Index shows heat this extreme would be rare, if not nearly impossible, without human-caused climate change.
Tuesday brought sweltering 110–115°F+ (43–46°C) highs, ~17°C (30°F) above average for this time of year.
Attribution science of the Climate Shift Index shows heat this extreme would be rare, if not nearly impossible, without human-caused climate change.
Reposted by Climate Central

Join CCNow and @climatecentral.org for a Press Briefing on climate change's olympic impacts at 12pm ET on Wednesday, Jan 28:

Welcome! You are invited to join a webinar: Press Briefing: Climate Change's Olympic Impacts. After registering, you will receive a confirmation email about joining the webinar.
Millions of people around the world will soon be cheering on their favorite teams and athletes during the 2026 Winter Olympics. Besides being one of the best-loved sporting events on Earth, both the W...
us02web.zoom.us
January 26, 2026 at 10:16 PM
Join CCNow and @climatecentral.org for a Press Briefing on climate change's olympic impacts at 12pm ET on Wednesday, Jan 28:
Reposted by Climate Central
Millions of people around the world will soon be cheering on their favorite teams and athletes during the 2026 Winter Olympics.
Besides being one of the best-loved sporting events on Earth, both the Winter and Summer Olympics are deeply impacted by climate change.
Besides being one of the best-loved sporting events on Earth, both the Winter and Summer Olympics are deeply impacted by climate change.

January 26, 2026 at 10:16 PM
Millions of people around the world will soon be cheering on their favorite teams and athletes during the 2026 Winter Olympics.
Besides being one of the best-loved sporting events on Earth, both the Winter and Summer Olympics are deeply impacted by climate change.
Besides being one of the best-loved sporting events on Earth, both the Winter and Summer Olympics are deeply impacted by climate change.
What's in store tomorrow, January 27, at #AMS2026 from Climate Central?
Talks on💲Billion dollar disasters, climate change + ER visits, Urban Heat Islands, Precipitation attribution, and climate visualizations.
🗣️ Reach out to us if you'd like to connect!
Talks on💲Billion dollar disasters, climate change + ER visits, Urban Heat Islands, Precipitation attribution, and climate visualizations.
🗣️ Reach out to us if you'd like to connect!

January 26, 2026 at 11:00 PM
What's in store tomorrow, January 27, at #AMS2026 from Climate Central?
Talks on💲Billion dollar disasters, climate change + ER visits, Urban Heat Islands, Precipitation attribution, and climate visualizations.
🗣️ Reach out to us if you'd like to connect!
Talks on💲Billion dollar disasters, climate change + ER visits, Urban Heat Islands, Precipitation attribution, and climate visualizations.
🗣️ Reach out to us if you'd like to connect!
Reposted by Climate Central
If you are #AMS2026, stop by our presentation tomorrow about the new work in climate services at @climatecentral.org (ams.confex.com/ams/106ANNUA...) - focusing on preserving critical climate data and improving the tools and communication of the local risks.
🌐 go.climatecentral.org/climate-serv...
🌐 go.climatecentral.org/climate-serv...

January 25, 2026 at 10:01 PM
If you are #AMS2026, stop by our presentation tomorrow about the new work in climate services at @climatecentral.org (ams.confex.com/ams/106ANNUA...) - focusing on preserving critical climate data and improving the tools and communication of the local risks.
🌐 go.climatecentral.org/climate-serv...
🌐 go.climatecentral.org/climate-serv...
January 26 is a busy day at #AMS2026 for the Climate Central team!
We'll be talking about climate communication, attribution science, climate resilient infrastructure and how our work is used by those across the Weather, Water, and Climate enterprise to make key decisions.
Come say hi!
We'll be talking about climate communication, attribution science, climate resilient infrastructure and how our work is used by those across the Weather, Water, and Climate enterprise to make key decisions.
Come say hi!

January 26, 2026 at 2:01 PM
January 26 is a busy day at #AMS2026 for the Climate Central team!
We'll be talking about climate communication, attribution science, climate resilient infrastructure and how our work is used by those across the Weather, Water, and Climate enterprise to make key decisions.
Come say hi!
We'll be talking about climate communication, attribution science, climate resilient infrastructure and how our work is used by those across the Weather, Water, and Climate enterprise to make key decisions.
Come say hi!
Reposted by Climate Central
Carbon dioxide (CO₂) surpassed 430 ppm last year. How high will it go for the seasonal maximum in 2026?
➡️ Check out @climatecentral.org's latest monthly and year-in-review report at www.climatecentral.org/climate-brie..., which is part of our new climate services initiative.
➡️ Check out @climatecentral.org's latest monthly and year-in-review report at www.climatecentral.org/climate-brie..., which is part of our new climate services initiative.

January 24, 2026 at 4:20 PM
Carbon dioxide (CO₂) surpassed 430 ppm last year. How high will it go for the seasonal maximum in 2026?
➡️ Check out @climatecentral.org's latest monthly and year-in-review report at www.climatecentral.org/climate-brie..., which is part of our new climate services initiative.
➡️ Check out @climatecentral.org's latest monthly and year-in-review report at www.climatecentral.org/climate-brie..., which is part of our new climate services initiative.
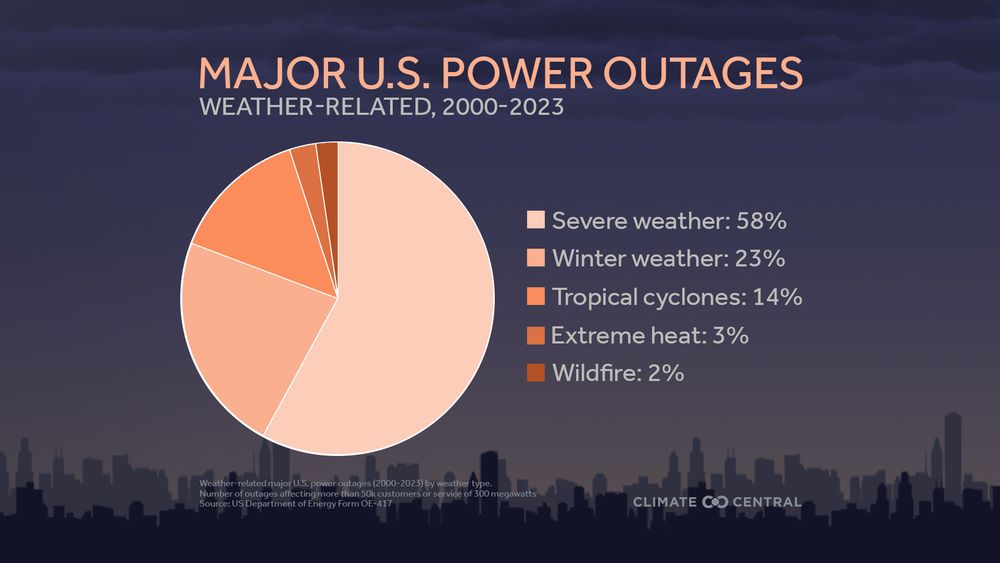
⚡Winter weather: 2nd biggest cause of U.S. power disruptions
From 2000–2023, 80% of major U.S. power outages (affecting 50k+ customers or 300+ MW) were weather-related.
Of 1,755 outages reported, 398 (23%) were caused by winter weather — including ice, snow, and freezing rain.
From 2000–2023, 80% of major U.S. power outages (affecting 50k+ customers or 300+ MW) were weather-related.
Of 1,755 outages reported, 398 (23%) were caused by winter weather — including ice, snow, and freezing rain.
January 23, 2026 at 5:22 PM
⚡Winter weather: 2nd biggest cause of U.S. power disruptions
From 2000–2023, 80% of major U.S. power outages (affecting 50k+ customers or 300+ MW) were weather-related.
Of 1,755 outages reported, 398 (23%) were caused by winter weather — including ice, snow, and freezing rain.
From 2000–2023, 80% of major U.S. power outages (affecting 50k+ customers or 300+ MW) were weather-related.
Of 1,755 outages reported, 398 (23%) were caused by winter weather — including ice, snow, and freezing rain.
A major winter storm is set to grip the U.S. this last January weekend -- and climate change is playing a bigger role than you might think.
Here's how warmer oceans are actually loading this storm with extra moisture, leading to higher ice and snow totals.⤵️
youtube.com/shorts/8brlf...
Here's how warmer oceans are actually loading this storm with extra moisture, leading to higher ice and snow totals.⤵️
youtube.com/shorts/8brlf...

Warmer Planet, Bigger Snowstorms? Climate connection to January 2026's #WinterStorm
YouTube video by climatecentral
youtube.com
January 23, 2026 at 5:01 PM
A major winter storm is set to grip the U.S. this last January weekend -- and climate change is playing a bigger role than you might think.
Here's how warmer oceans are actually loading this storm with extra moisture, leading to higher ice and snow totals.⤵️
youtube.com/shorts/8brlf...
Here's how warmer oceans are actually loading this storm with extra moisture, leading to higher ice and snow totals.⤵️
youtube.com/shorts/8brlf...
No Winter Olympics in Salt Lake City in 2034? It's possible says Rocky Anderson, former Salt Lake City Mayor during the 2002 Winter Games.
youtube.com/shorts/w2uhr...
youtube.com/shorts/w2uhr...

No winter games in Salt Lake City in 2034? Not out of the realm of possibility.
YouTube video by climatecentral
youtube.com
January 23, 2026 at 4:04 PM
No Winter Olympics in Salt Lake City in 2034? It's possible says Rocky Anderson, former Salt Lake City Mayor during the 2002 Winter Games.
youtube.com/shorts/w2uhr...
youtube.com/shorts/w2uhr...
Frigid air and an impactful, disruptive winter storm are in the works for the weekend.
These kinds of events don’t happen despite a warming climate...they’re connected to it, especially when it comes to ice and snow totals.
A short 🧵to walk through the science together ⬇️
These kinds of events don’t happen despite a warming climate...they’re connected to it, especially when it comes to ice and snow totals.
A short 🧵to walk through the science together ⬇️


January 22, 2026 at 10:14 PM
Frigid air and an impactful, disruptive winter storm are in the works for the weekend.
These kinds of events don’t happen despite a warming climate...they’re connected to it, especially when it comes to ice and snow totals.
A short 🧵to walk through the science together ⬇️
These kinds of events don’t happen despite a warming climate...they’re connected to it, especially when it comes to ice and snow totals.
A short 🧵to walk through the science together ⬇️
⛷️ Warming winters are changing the face of winter sports.
At Bogus Basin, see the engineering behind the blanket that saved 70% of its stash for opening day, and find out why the Winter Olympics might need more than tech to survive by 2050.
buff.ly/iKvFsif
At Bogus Basin, see the engineering behind the blanket that saved 70% of its stash for opening day, and find out why the Winter Olympics might need more than tech to survive by 2050.
buff.ly/iKvFsif

The Giant "Snow Cooler": Storing Snow to Save the Ski Industry
How do you keep a 30-foot pile of snow from melting in the July sun? Bogus Basin is betting on a massive insulated storage system to "hibernate" their snow.
See the engineering behind the blanket…
buff.ly
January 21, 2026 at 7:51 PM
⛷️ Warming winters are changing the face of winter sports.
At Bogus Basin, see the engineering behind the blanket that saved 70% of its stash for opening day, and find out why the Winter Olympics might need more than tech to survive by 2050.
buff.ly/iKvFsif
At Bogus Basin, see the engineering behind the blanket that saved 70% of its stash for opening day, and find out why the Winter Olympics might need more than tech to survive by 2050.
buff.ly/iKvFsif