


Tony Chu
@tonyhschu.bsky.social
Designer working with data visualization and machine learning.
Reposted by Tony Chu

A book from the 19th century that depicts the Rhine Valley by creating an impression of three-dimensionality and spatial distance.
@MasayukiTsuda2 #globalmuseum #books #travel #19thcentury
@MasayukiTsuda2 #globalmuseum #books #travel #19thcentury
December 2, 2025 at 7:02 PM
A book from the 19th century that depicts the Rhine Valley by creating an impression of three-dimensionality and spatial distance.
@MasayukiTsuda2 #globalmuseum #books #travel #19thcentury
@MasayukiTsuda2 #globalmuseum #books #travel #19thcentury
Reposted by Tony Chu


December 6, 2025 at 11:43 AM

Reposted by Tony Chu

Imagine a browser where you type in “Taylor Swift” and it doesn’t even admit that her website exists. I write about Atlas, ChatGPT’s new anti-web browser that should come with a warning label. www.anildash.com/2025/10/22/a...

ChatGPT's Atlas: The Browser That's Anti-Web - Anil Dash
A blog about making culture. Since 1999.
www.anildash.com
October 22, 2025 at 9:13 PM
Imagine a browser where you type in “Taylor Swift” and it doesn’t even admit that her website exists. I write about Atlas, ChatGPT’s new anti-web browser that should come with a warning label. www.anildash.com/2025/10/22/a...
Reposted by Tony Chu

Leadership Hack #7: Build a list of your favorite humans. Check in with them frequently.
July 30, 2025 at 3:05 PM
Leadership Hack #7: Build a list of your favorite humans. Check in with them frequently.
Reposted by Tony Chu

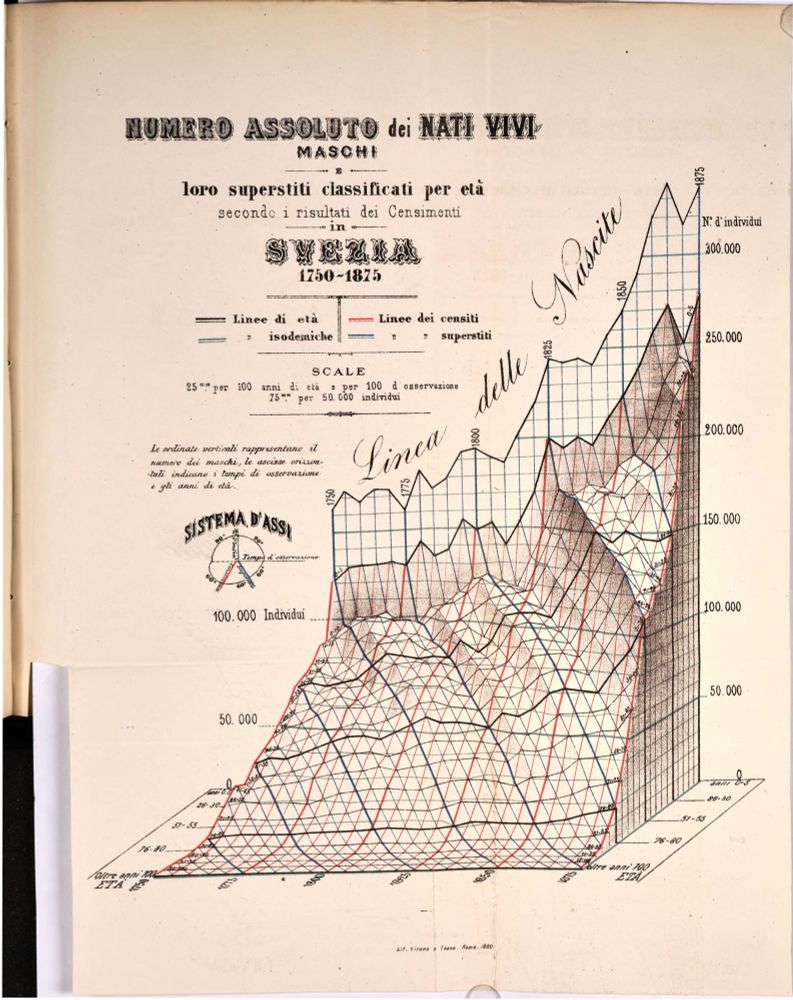
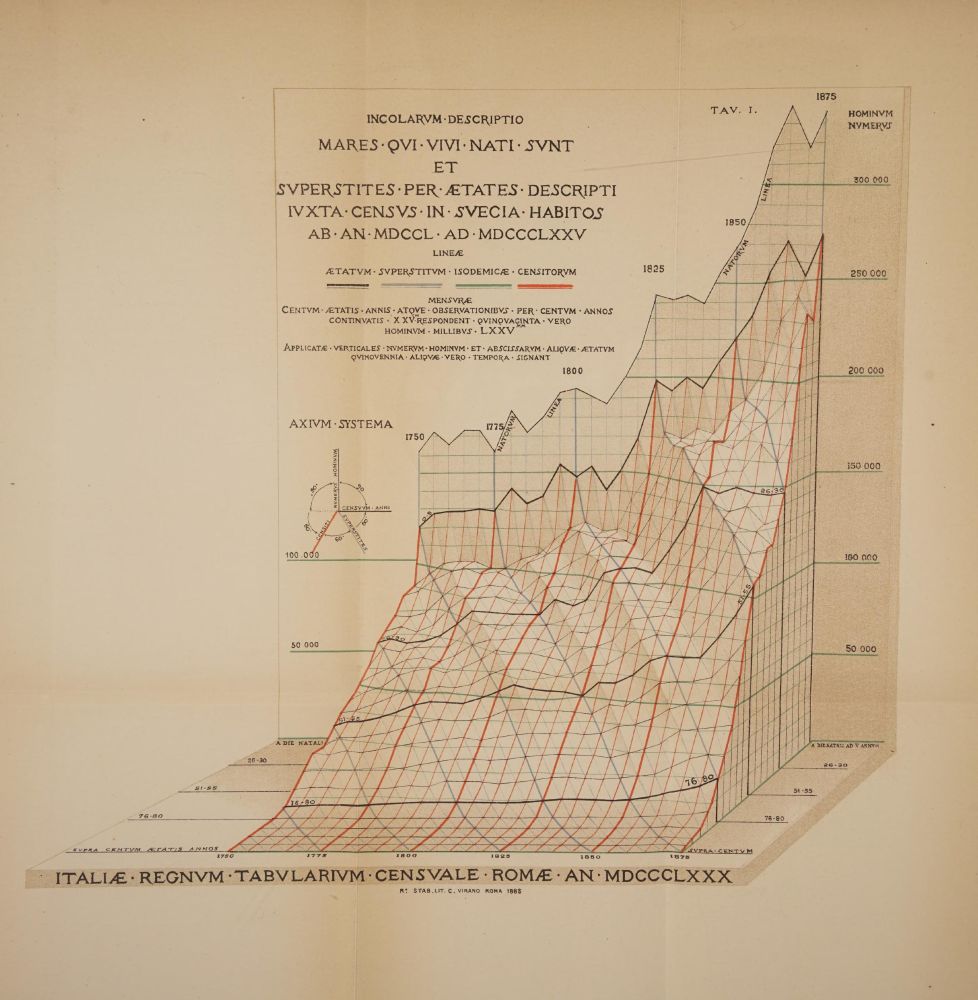
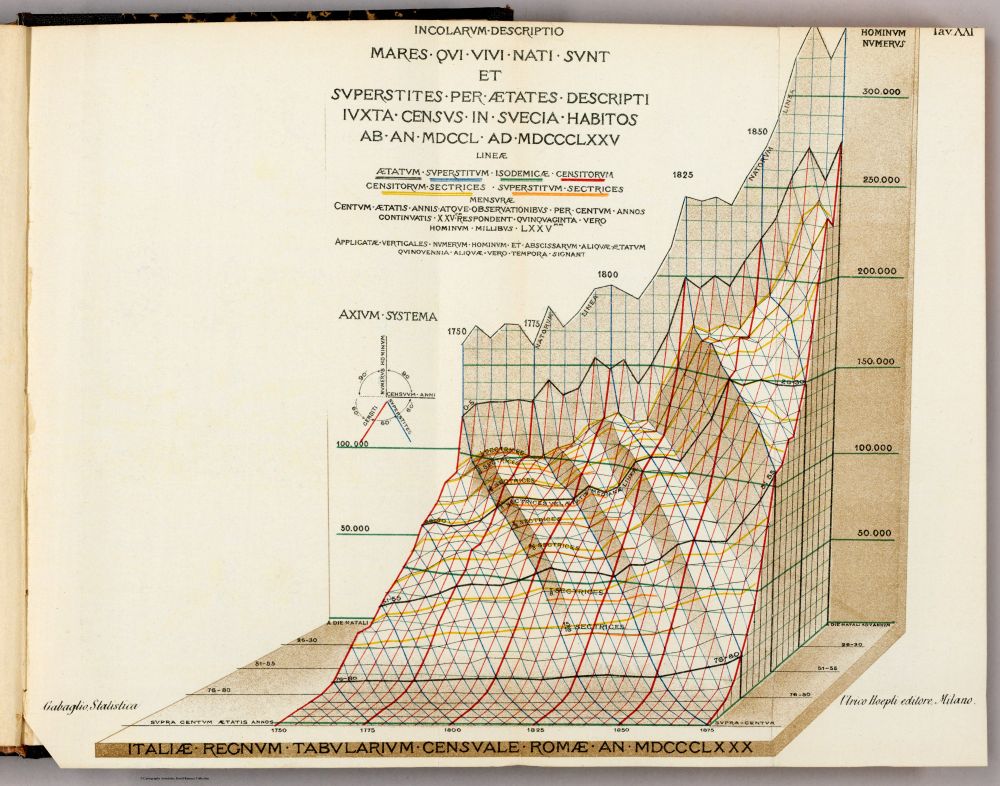
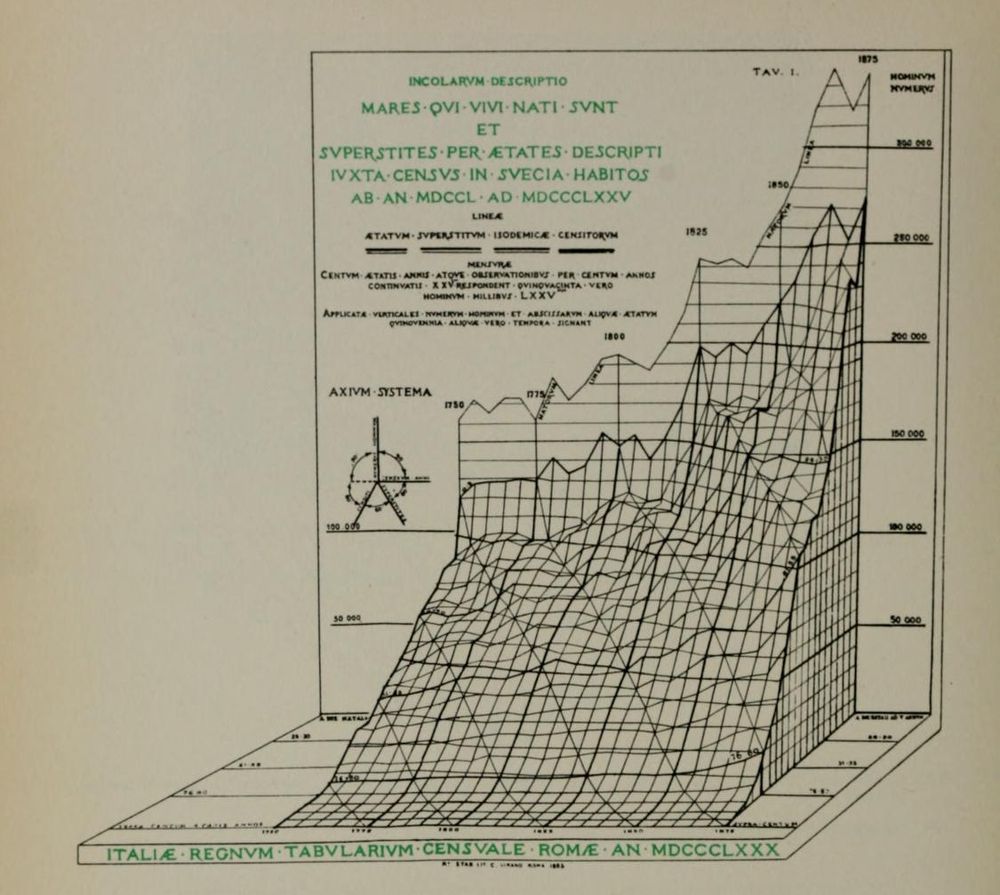
Perozzo's stereogram over the years:
1880 Annali di Statistica (Perozzo)
1885 Statistical Society Jubilee (Levasseur)
1888 Teoria generale della statistica (Gabaglio)
1939 Graphic Presentation (Brinton)
1880 Annali di Statistica (Perozzo)
1885 Statistical Society Jubilee (Levasseur)
1888 Teoria generale della statistica (Gabaglio)
1939 Graphic Presentation (Brinton)
June 4, 2025 at 8:51 PM
Perozzo's stereogram over the years:
1880 Annali di Statistica (Perozzo)
1885 Statistical Society Jubilee (Levasseur)
1888 Teoria generale della statistica (Gabaglio)
1939 Graphic Presentation (Brinton)
1880 Annali di Statistica (Perozzo)
1885 Statistical Society Jubilee (Levasseur)
1888 Teoria generale della statistica (Gabaglio)
1939 Graphic Presentation (Brinton)
Reposted by Tony Chu

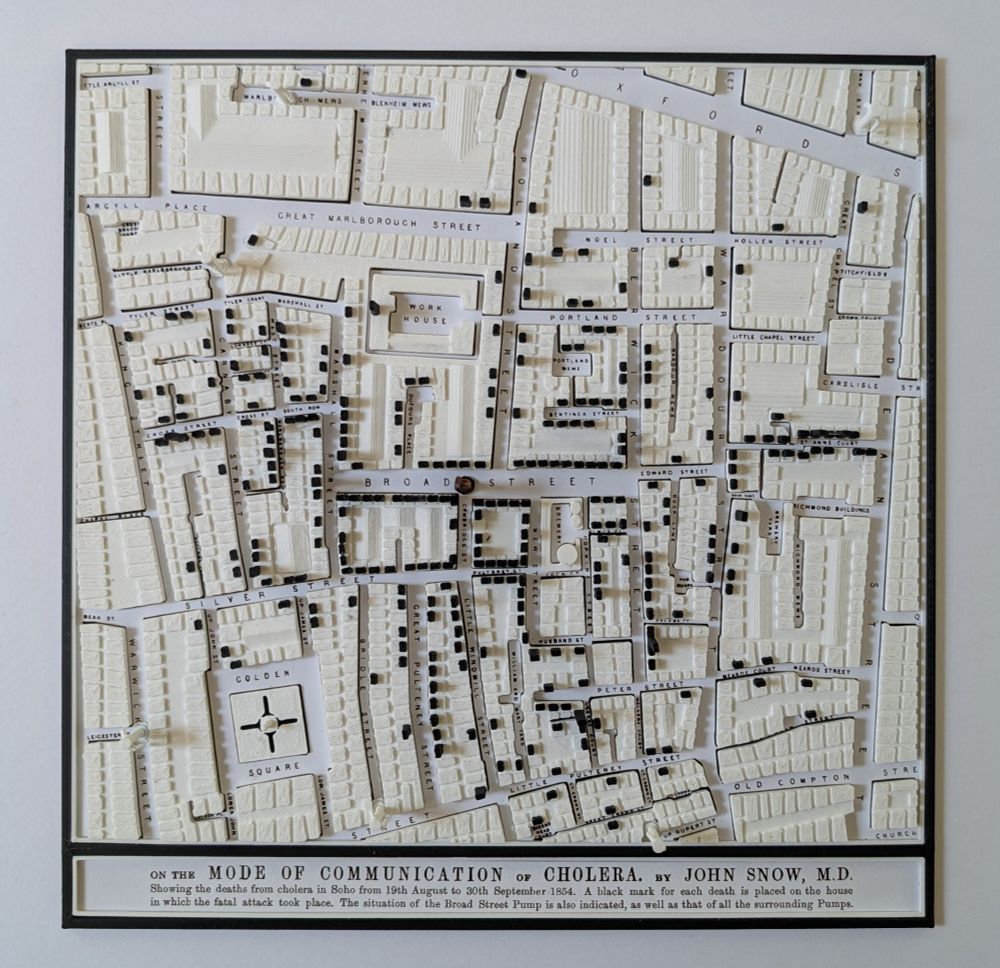
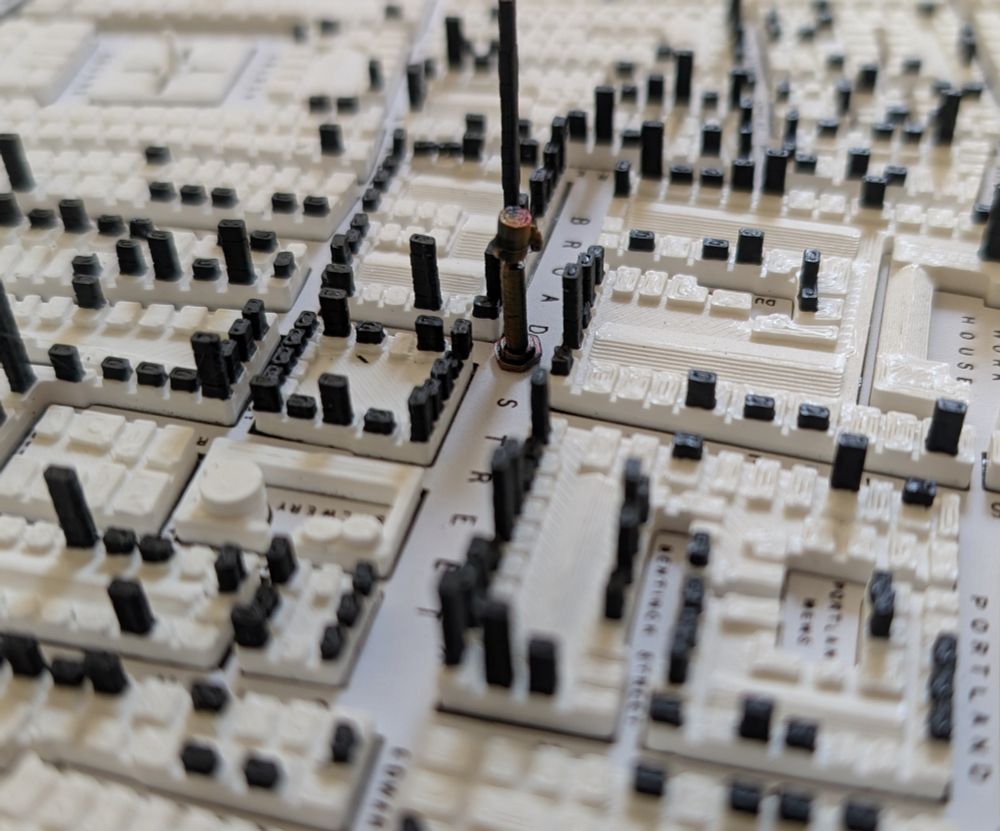
Wonderful to receive this utterly beautiful 3D printed diorama of "Snow's map of cholera" by @alexselbyb.bsky.social. Exceptional attention to detail. Simply stunning. Dare I say better than the original! Thanks Alex.
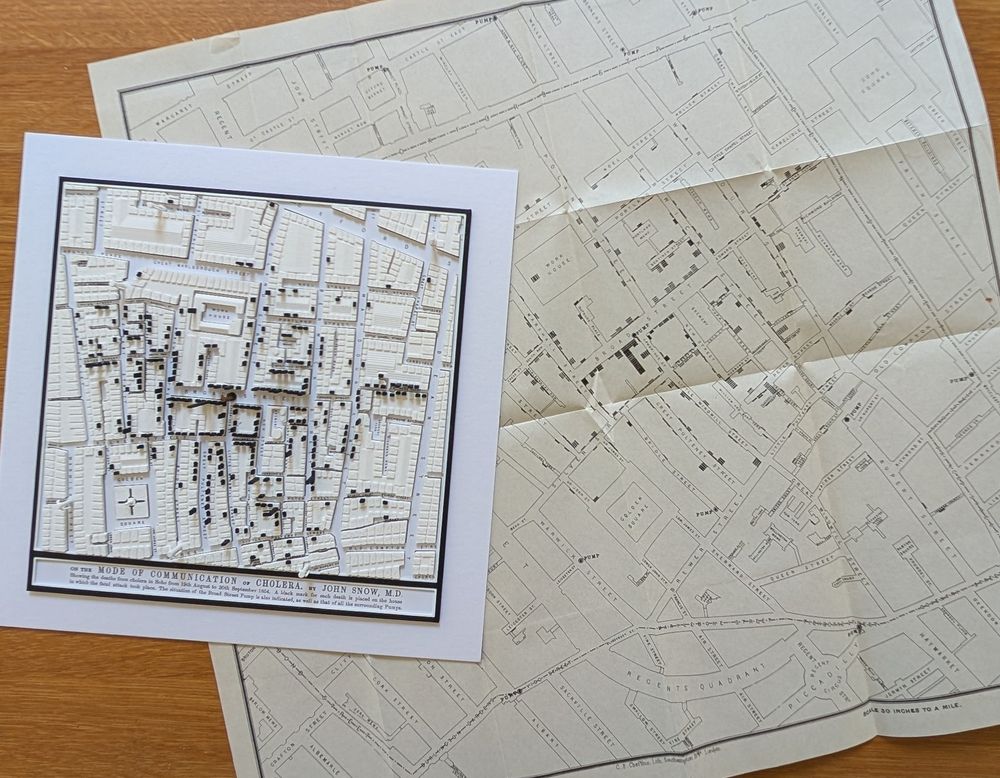
May 15, 2025 at 8:45 PM
Wonderful to receive this utterly beautiful 3D printed diorama of "Snow's map of cholera" by @alexselbyb.bsky.social. Exceptional attention to detail. Simply stunning. Dare I say better than the original! Thanks Alex.
Reposted by Tony Chu

✨ It's new samwho visual essay o'clock! ✨
Reservoir sampling is one of my favourite algorithms. It allows you to sample from a set without knowing the size of that set.
I try to assume no prior knowledge, and use no scary math notation. Just beautiful visuals.
Let me know what you think! ❤️
Reservoir sampling is one of my favourite algorithms. It allows you to sample from a set without knowing the size of that set.
I try to assume no prior knowledge, and use no scary math notation. Just beautiful visuals.
Let me know what you think! ❤️
May 8, 2025 at 3:27 PM
✨ It's new samwho visual essay o'clock! ✨
Reservoir sampling is one of my favourite algorithms. It allows you to sample from a set without knowing the size of that set.
I try to assume no prior knowledge, and use no scary math notation. Just beautiful visuals.
Let me know what you think! ❤️
Reservoir sampling is one of my favourite algorithms. It allows you to sample from a set without knowing the size of that set.
I try to assume no prior knowledge, and use no scary math notation. Just beautiful visuals.
Let me know what you think! ❤️
I’ve been really into these “deep structure” readings on history lately, so it was a delight when this popped up this morning open.substack.com/pub/uncharte...
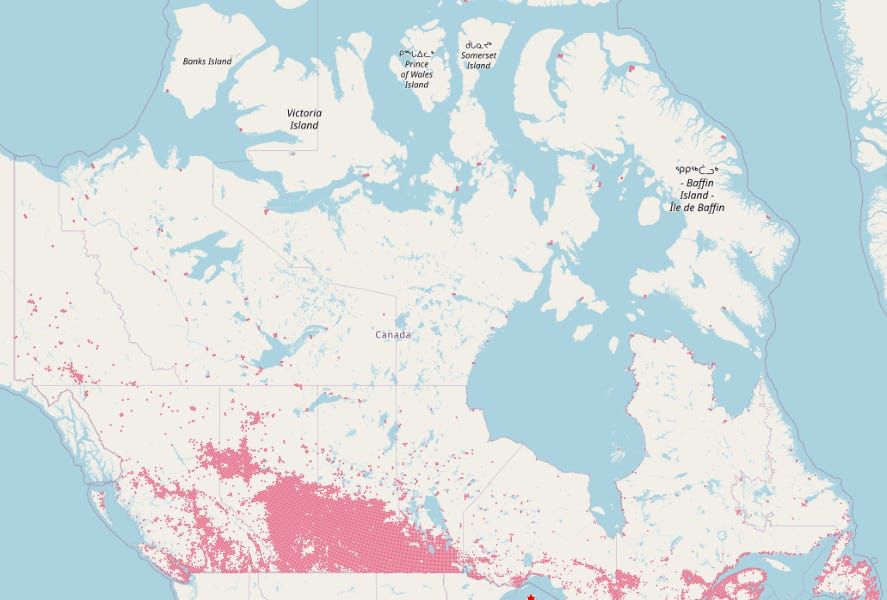
Why Is Canada’s Population so Concentrated?
In three spots that are disconnected?
open.substack.com
April 27, 2025 at 3:38 PM
I’ve been really into these “deep structure” readings on history lately, so it was a delight when this popped up this morning open.substack.com/pub/uncharte...
A little typographical joy in a kickstarter project www.kickstarter.com/projects/gle... - they are *almost* there with about 2 days to go!
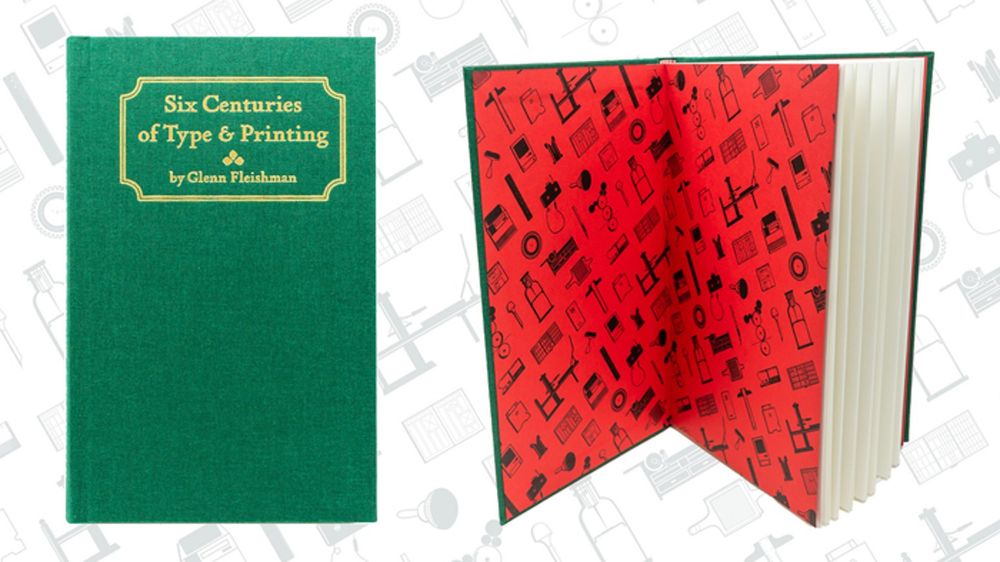
Six Centuries of Type & Printing: New Edition
Help create an affordably priced version of this book that spans 600 years of the history of typography, type casting, and printing
www.kickstarter.com
April 15, 2025 at 5:42 PM
A little typographical joy in a kickstarter project www.kickstarter.com/projects/gle... - they are *almost* there with about 2 days to go!
Reposted by Tony Chu

April 10, 2025 at 4:38 AM
Reposted by Tony Chu

A tricky thing about modern society is that no one has any idea when they don’t die.
Like, the number of lives saved by controlling air pollution in America is probably over 200,000 per year, but the number of people who think their life was saved by controlling air pollution is zero.
Like, the number of lives saved by controlling air pollution in America is probably over 200,000 per year, but the number of people who think their life was saved by controlling air pollution is zero.
April 7, 2025 at 4:13 AM
A tricky thing about modern society is that no one has any idea when they don’t die.
Like, the number of lives saved by controlling air pollution in America is probably over 200,000 per year, but the number of people who think their life was saved by controlling air pollution is zero.
Like, the number of lives saved by controlling air pollution in America is probably over 200,000 per year, but the number of people who think their life was saved by controlling air pollution is zero.
Reposted by Tony Chu

I wrote a short interactive article👆
It uses simulations to demonstrate how different cardiac arrhythmias can develop.
Try it out! (It has defibrillators ⚡️)
jenevoldsen.com/posts/excitable-cells
#medsky #cardiosky #cccsky #emimcc
It uses simulations to demonstrate how different cardiac arrhythmias can develop.
Try it out! (It has defibrillators ⚡️)
jenevoldsen.com/posts/excitable-cells
#medsky #cardiosky #cccsky #emimcc
February 20, 2025 at 12:23 PM
I wrote a short interactive article👆
It uses simulations to demonstrate how different cardiac arrhythmias can develop.
Try it out! (It has defibrillators ⚡️)
jenevoldsen.com/posts/excitable-cells
#medsky #cardiosky #cccsky #emimcc
It uses simulations to demonstrate how different cardiac arrhythmias can develop.
Try it out! (It has defibrillators ⚡️)
jenevoldsen.com/posts/excitable-cells
#medsky #cardiosky #cccsky #emimcc
Reposted by Tony Chu

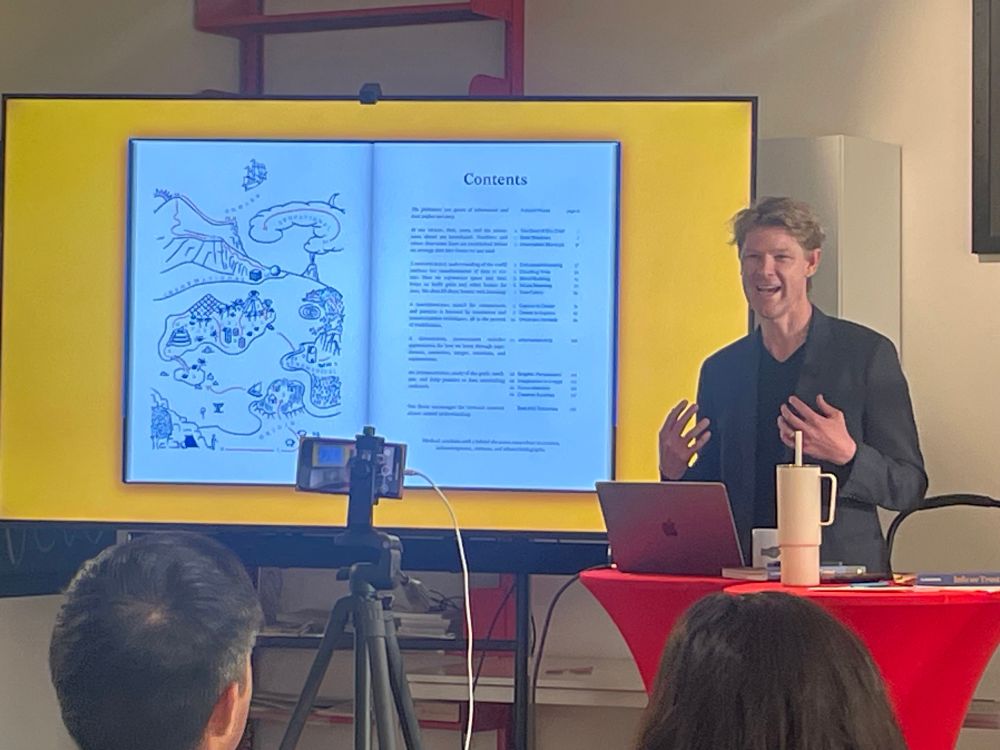
Geeked to see RJ Andrews @infowetrust.com talk about his work and celebrate the launch of his remastered book Info We Trust at @letterformarchive.org! An essential read for thinking about data storytelling (and recommended for you too, comics peeps!)
March 21, 2025 at 1:42 AM
Geeked to see RJ Andrews @infowetrust.com talk about his work and celebrate the launch of his remastered book Info We Trust at @letterformarchive.org! An essential read for thinking about data storytelling (and recommended for you too, comics peeps!)
Reposted by Tony Chu

I'm releasing a new latent space explorer 🧭🎨 — a creative tool for generating and evolving images.
It's tree-based and designed for creative flow and open-ended discovery, using image mixing, branching, and editing.
You can try it out now!
www.artbreeder.com/tools/splicer2
It's tree-based and designed for creative flow and open-ended discovery, using image mixing, branching, and editing.
You can try it out now!
www.artbreeder.com/tools/splicer2
February 4, 2025 at 6:01 PM
I'm releasing a new latent space explorer 🧭🎨 — a creative tool for generating and evolving images.
It's tree-based and designed for creative flow and open-ended discovery, using image mixing, branching, and editing.
You can try it out now!
www.artbreeder.com/tools/splicer2
It's tree-based and designed for creative flow and open-ended discovery, using image mixing, branching, and editing.
You can try it out now!
www.artbreeder.com/tools/splicer2
Reposted by Tony Chu

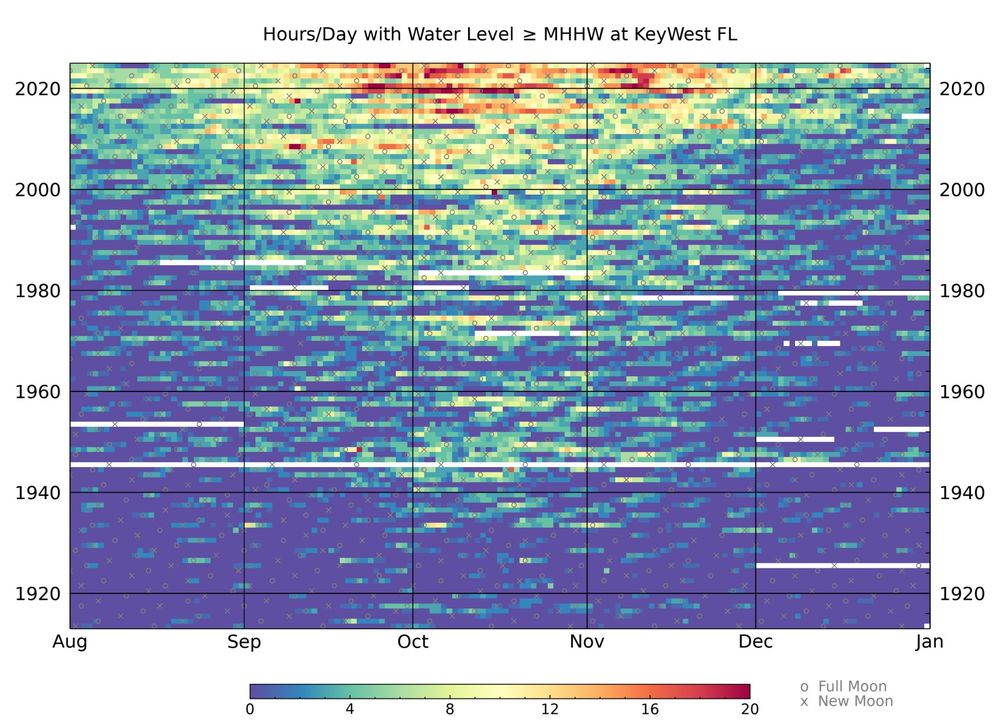
Here's a striking visualization of sea level rise that I just made for Key West FL, which has a 112-year history.
The colors indicate the number of hours each day that the water level was above the mean high tide (1983-2001 mean).
I show five months of the year, centered on "King Tide season". 🌊
The colors indicate the number of hours each day that the water level was above the mean high tide (1983-2001 mean).
I show five months of the year, centered on "King Tide season". 🌊
January 31, 2025 at 7:47 PM
Here's a striking visualization of sea level rise that I just made for Key West FL, which has a 112-year history.
The colors indicate the number of hours each day that the water level was above the mean high tide (1983-2001 mean).
I show five months of the year, centered on "King Tide season". 🌊
The colors indicate the number of hours each day that the water level was above the mean high tide (1983-2001 mean).
I show five months of the year, centered on "King Tide season". 🌊
Reposted by Tony Chu

"The spectre of AI does nothing for growth if it gives away what we own so that we can rent from it what it makes." - that's some extremely skilled political rhetoric, really great speech writing
(Prior to the Lords she had a long career as a film director in the UK, which I think shows)
(Prior to the Lords she had a long career as a film director in the UK, which I think shows)
January 29, 2025 at 5:33 PM
"The spectre of AI does nothing for growth if it gives away what we own so that we can rent from it what it makes." - that's some extremely skilled political rhetoric, really great speech writing
(Prior to the Lords she had a long career as a film director in the UK, which I think shows)
(Prior to the Lords she had a long career as a film director in the UK, which I think shows)
@almossawi.bsky.social in case you haven’t seen this www.mcsweeneys.net/articles/a-m... - I thought of you immediately

A Marriage Proposal Spoken Entirely in Office Jargon
GARY: Hey Cindy, remember the other day when we were talking about optimizations?
CINDY: Yeah, I wanted to circle back on that.
GARY: Me too. You s...
www.mcsweeneys.net
January 15, 2025 at 7:13 PM
@almossawi.bsky.social in case you haven’t seen this www.mcsweeneys.net/articles/a-m... - I thought of you immediately
Reposted by Tony Chu

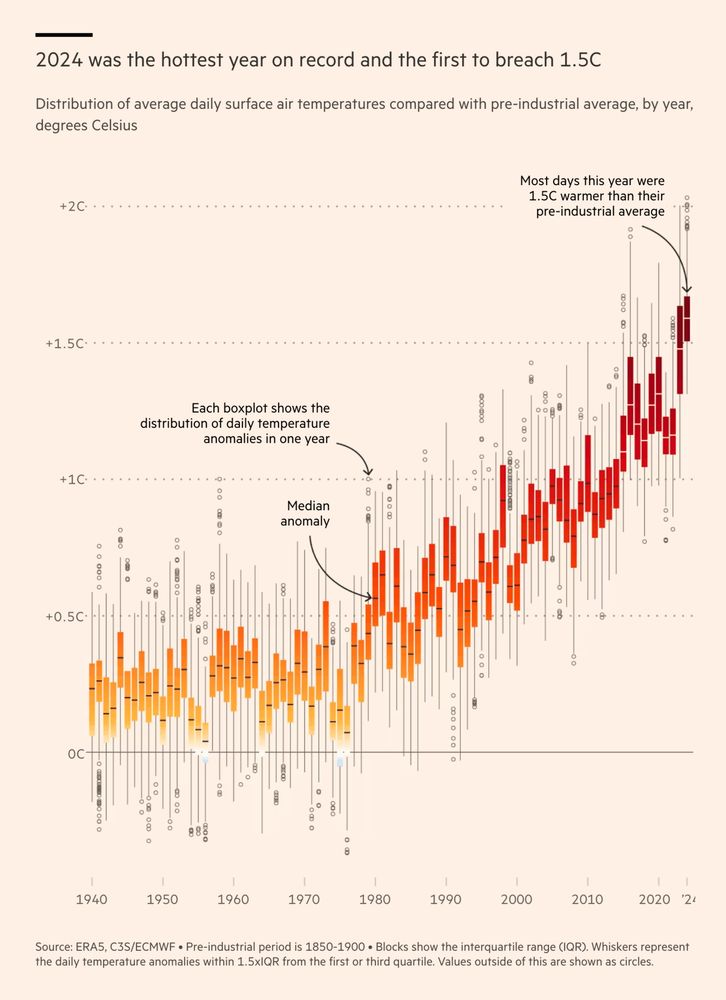
Remarkable chart by @data.ft.com
Many readers won't fully understand boxplots. At a quick glance, they don't add much information here. But then, look at the lower end of the 2024 whisker (or 2015 for the previous El Niño)!
Also: I just love the aesthetic 🤩 #dataviz
www.ft.com/content/fd91...
Many readers won't fully understand boxplots. At a quick glance, they don't add much information here. But then, look at the lower end of the 2024 whisker (or 2015 for the previous El Niño)!
Also: I just love the aesthetic 🤩 #dataviz
www.ft.com/content/fd91...
January 14, 2025 at 9:07 PM
Remarkable chart by @data.ft.com
Many readers won't fully understand boxplots. At a quick glance, they don't add much information here. But then, look at the lower end of the 2024 whisker (or 2015 for the previous El Niño)!
Also: I just love the aesthetic 🤩 #dataviz
www.ft.com/content/fd91...
Many readers won't fully understand boxplots. At a quick glance, they don't add much information here. But then, look at the lower end of the 2024 whisker (or 2015 for the previous El Niño)!
Also: I just love the aesthetic 🤩 #dataviz
www.ft.com/content/fd91...
Reposted by Tony Chu

On some of my pages, I'll share state between interactive diagrams. Here's an example: the position of the square in the first diagram is the same as the position in the second diagram.
www.redblobgames.com/x/1730-spati...
I do this when I want to compare two computations with the same input.
www.redblobgames.com/x/1730-spati...
I do this when I want to compare two computations with the same input.
January 8, 2025 at 5:40 PM
On some of my pages, I'll share state between interactive diagrams. Here's an example: the position of the square in the first diagram is the same as the position in the second diagram.
www.redblobgames.com/x/1730-spati...
I do this when I want to compare two computations with the same input.
www.redblobgames.com/x/1730-spati...
I do this when I want to compare two computations with the same input.
Reposted by Tony Chu

Exciting news! 🎉 I’m pressing pause on my work at CBC News for the next three months to focus on a passion project: www.code-like-a-journalist.com.
It’s a free, open-source online course designed to teach data analysis and visualization using TypeScript. 🚀
Stay tuned!
It’s a free, open-source online course designed to teach data analysis and visualization using TypeScript. 🚀
Stay tuned!

Code Like a Journalist
A free online data analysis and data visualization course using TypeScript by computational journalist Nael Shiab.
www.code-like-a-journalist.com
January 7, 2025 at 5:21 PM
Exciting news! 🎉 I’m pressing pause on my work at CBC News for the next three months to focus on a passion project: www.code-like-a-journalist.com.
It’s a free, open-source online course designed to teach data analysis and visualization using TypeScript. 🚀
Stay tuned!
It’s a free, open-source online course designed to teach data analysis and visualization using TypeScript. 🚀
Stay tuned!
Reposted by Tony Chu
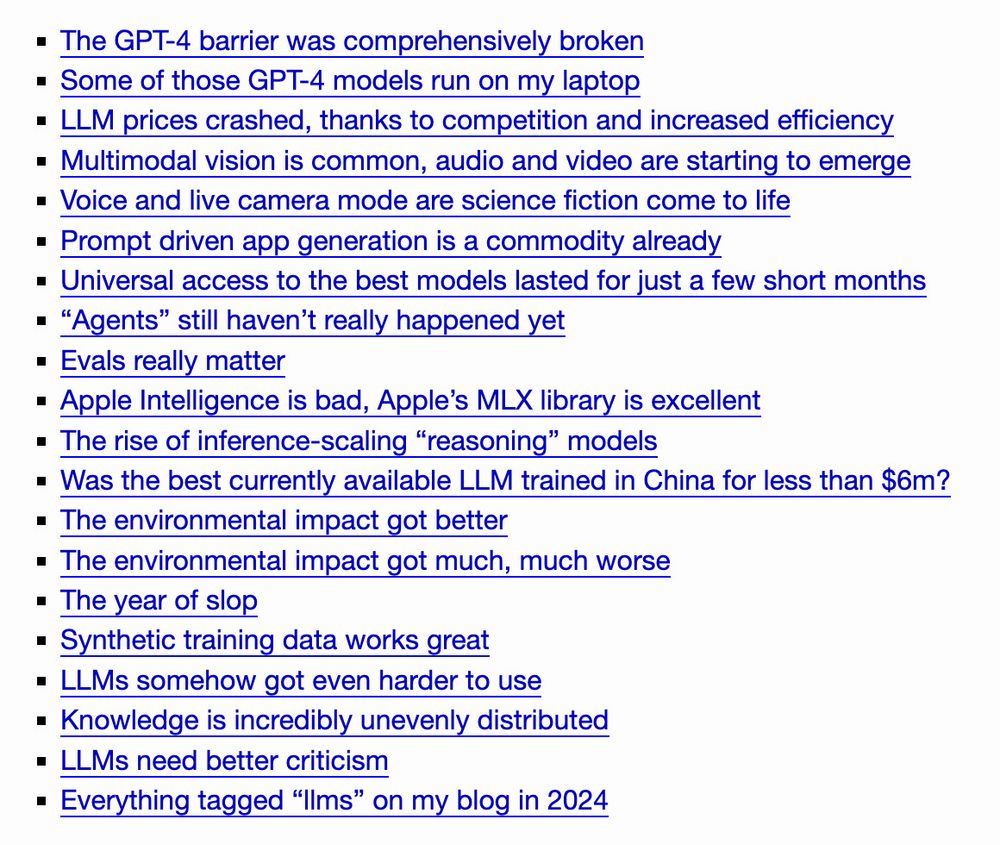
Here's my end-of-year review of things we learned out about LLMs in 2024 - we learned a LOT of things simonwillison.net/2024/Dec/31/...
Table of contents:
Table of contents:
December 31, 2024 at 6:10 PM
Here's my end-of-year review of things we learned out about LLMs in 2024 - we learned a LOT of things simonwillison.net/2024/Dec/31/...
Table of contents:
Table of contents:
Reposted by Tony Chu
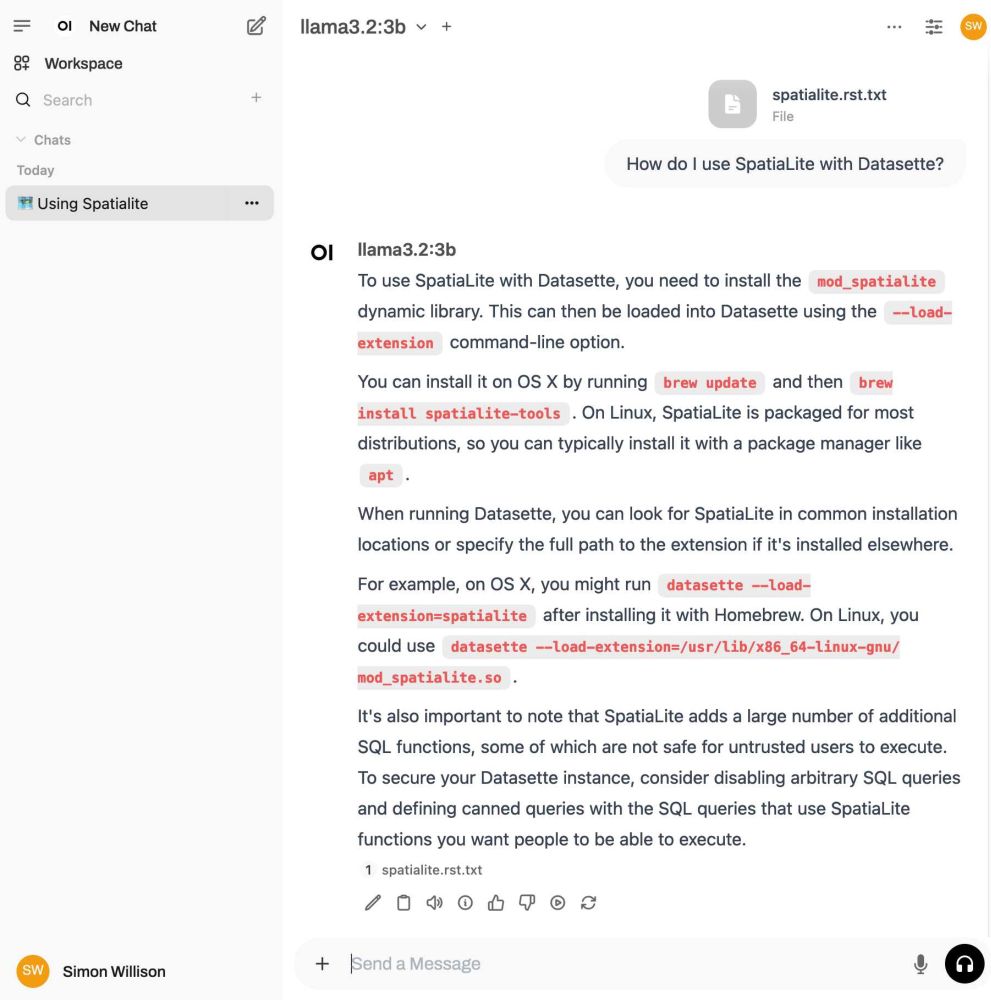
Just got a great first impression running Open WebUI - took one command to get it up and running (uvx --python 3.11 open-webui serve) and it noticed I had Ollama running and automatically gave me a UI to interact with those models simonwillison.net/2024/Dec/27/...
Open WebUI
I tried out this open source (MIT licensed, JavaScript and Python) localhost UI for accessing LLMs today for the first time. It's very nicely done. I ran it with [uvx](https://docs.astral.sh/uv/guides...
simonwillison.net
December 27, 2024 at 1:40 AM
Just got a great first impression running Open WebUI - took one command to get it up and running (uvx --python 3.11 open-webui serve) and it noticed I had Ollama running and automatically gave me a UI to interact with those models simonwillison.net/2024/Dec/27/...
Finally getting time to dabble with code... and immediately got sidetracked into building a tool for AI-assisted code dabbling.
Spent the evening building a #ModelContextProtocol server that allows Claude to run vitest and tsc ... so that it can do that in another project I'm working on 😂
Spent the evening building a #ModelContextProtocol server that allows Claude to run vitest and tsc ... so that it can do that in another project I'm working on 😂
December 22, 2024 at 6:48 AM
Finally getting time to dabble with code... and immediately got sidetracked into building a tool for AI-assisted code dabbling.
Spent the evening building a #ModelContextProtocol server that allows Claude to run vitest and tsc ... so that it can do that in another project I'm working on 😂
Spent the evening building a #ModelContextProtocol server that allows Claude to run vitest and tsc ... so that it can do that in another project I'm working on 😂