


Robert Simmon
@rsimmon.bsky.social
Data Visualization. Ex-Planet & NASA Earth Observatory. Blue Marble, Earth at Night, color, cartography, occasionally skewed views of Earth. Looking for a job.
The science of global warming/climate change, and how we know it’s caused by burning fossil fuels, is absolutely fascinating.
If you know who’d be receptive to that message, here’s an article I worked on for NASA that helps explain the research: science.nasa.gov/earth/climat...
🌍🌡️
If you know who’d be receptive to that message, here’s an article I worked on for NASA that helps explain the research: science.nasa.gov/earth/climat...
🌍🌡️

Global Warming - NASA Science
It is necessary to understand what global warming is, how scientists know it's happening, and how they predict future climate.
science.nasa.gov
February 12, 2026 at 9:08 PM
The science of global warming/climate change, and how we know it’s caused by burning fossil fuels, is absolutely fascinating.
If you know who’d be receptive to that message, here’s an article I worked on for NASA that helps explain the research: science.nasa.gov/earth/climat...
🌍🌡️
If you know who’d be receptive to that message, here’s an article I worked on for NASA that helps explain the research: science.nasa.gov/earth/climat...
🌍🌡️
“Led by a president who refers to climate change as a “hoax,” the administration is essentially saying that the vast majority of scientists around the world are wrong and that a hotter planet is not the menace that decades of research shows it to be.”
🤬
www.nytimes.com/2026/02/12/c...
🤬
www.nytimes.com/2026/02/12/c...

Trump Administration Erases the Government’s Power to Fight Climate Change
www.nytimes.com
February 12, 2026 at 8:53 PM
“Led by a president who refers to climate change as a “hoax,” the administration is essentially saying that the vast majority of scientists around the world are wrong and that a hotter planet is not the menace that decades of research shows it to be.”
🤬
www.nytimes.com/2026/02/12/c...
🤬
www.nytimes.com/2026/02/12/c...
Reposted by Robert Simmon

📚 Hey, I noticed @geology.bsky.social 's book is a staff pick of the month at Pegasus books, and I had to share the staff members' comments:
⚒️🧪 #booksky #oakland
⚒️🧪 #booksky #oakland


February 12, 2026 at 8:39 PM
📚 Hey, I noticed @geology.bsky.social 's book is a staff pick of the month at Pegasus books, and I had to share the staff members' comments:
⚒️🧪 #booksky #oakland
⚒️🧪 #booksky #oakland
Reposted by Robert Simmon
I made another set of maps for @climate.us with final polish by @annamaps.bsky.social
These show snow cover & snow cover difference for the past two months.
Data from the Rutgers Global Snow Lab: climate.rutgers.edu/snowcover/do...
#climate #cartography
These show snow cover & snow cover difference for the past two months.
Data from the Rutgers Global Snow Lab: climate.rutgers.edu/snowcover/do...
#climate #cartography

February 11, 2026 at 6:36 PM
I made another set of maps for @climate.us with final polish by @annamaps.bsky.social
These show snow cover & snow cover difference for the past two months.
Data from the Rutgers Global Snow Lab: climate.rutgers.edu/snowcover/do...
#climate #cartography
These show snow cover & snow cover difference for the past two months.
Data from the Rutgers Global Snow Lab: climate.rutgers.edu/snowcover/do...
#climate #cartography
Reposted by Robert Simmon

Here's the full story:
www.bas.ac.uk/media-post/m...
www.bas.ac.uk/media-post/m...

Major earthquakes don't run to timetable, 6,000-year study reveals - British Antarctic Survey
"Overdue earthquake" myth busted: large earthquakes arrive in unpredictable bursts and lulls, overturning existing prediction models.
www.bas.ac.uk
February 11, 2026 at 8:04 PM
Here's the full story:
www.bas.ac.uk/media-post/m...
www.bas.ac.uk/media-post/m...
Reposted by Robert Simmon
This is a real timelapse video of the Moon transiting in front of the Earth.
It was captured by the Artemis 1 Orion spacecraft in November 2022 while flying at it's furthest point from the Earth.
The video covers about 3.75 hours of real time. 🔭🧪
It was captured by the Artemis 1 Orion spacecraft in November 2022 while flying at it's furthest point from the Earth.
The video covers about 3.75 hours of real time. 🔭🧪
February 11, 2026 at 3:43 PM
This is a real timelapse video of the Moon transiting in front of the Earth.
It was captured by the Artemis 1 Orion spacecraft in November 2022 while flying at it's furthest point from the Earth.
The video covers about 3.75 hours of real time. 🔭🧪
It was captured by the Artemis 1 Orion spacecraft in November 2022 while flying at it's furthest point from the Earth.
The video covers about 3.75 hours of real time. 🔭🧪
TIL: The term “sine illusion“.
“provides an example where human perception leads to systematic bias in the assessment of the optical stimulus, with a particularly notable impact on perception of time-series data with a seasonal component.“
#dataviz
www.researchgate.net/publication/...
“provides an example where human perception leads to systematic bias in the assessment of the optical stimulus, with a particularly notable impact on perception of time-series data with a seasonal component.“
#dataviz
www.researchgate.net/publication/...
February 11, 2026 at 7:13 PM
TIL: The term “sine illusion“.
“provides an example where human perception leads to systematic bias in the assessment of the optical stimulus, with a particularly notable impact on perception of time-series data with a seasonal component.“
#dataviz
www.researchgate.net/publication/...
“provides an example where human perception leads to systematic bias in the assessment of the optical stimulus, with a particularly notable impact on perception of time-series data with a seasonal component.“
#dataviz
www.researchgate.net/publication/...
I made another set of maps for @climate.us with final polish by @annamaps.bsky.social
These show snow cover & snow cover difference for the past two months.
Data from the Rutgers Global Snow Lab: climate.rutgers.edu/snowcover/do...
#climate #cartography
These show snow cover & snow cover difference for the past two months.
Data from the Rutgers Global Snow Lab: climate.rutgers.edu/snowcover/do...
#climate #cartography
February 11, 2026 at 6:36 PM
I made another set of maps for @climate.us with final polish by @annamaps.bsky.social
These show snow cover & snow cover difference for the past two months.
Data from the Rutgers Global Snow Lab: climate.rutgers.edu/snowcover/do...
#climate #cartography
These show snow cover & snow cover difference for the past two months.
Data from the Rutgers Global Snow Lab: climate.rutgers.edu/snowcover/do...
#climate #cartography
mood: youtu.be/fKts5sczKEw?...

Fazerdaze - Break! (Official Video)
YouTube video by Fazerdaze
youtu.be
February 11, 2026 at 5:58 PM
mood: youtu.be/fKts5sczKEw?...
Reposted by Robert Simmon

Academics, do any of you feel like your institution has done an excellent (or even "pretty good") job at instituting policies to manage Generative "AI"? I'm on a committee looking to craft a framework for our school to guide faculty & students.
February 9, 2026 at 11:02 PM
Academics, do any of you feel like your institution has done an excellent (or even "pretty good") job at instituting policies to manage Generative "AI"? I'm on a committee looking to craft a framework for our school to guide faculty & students.
February 11, 2026 at 3:12 AM
mood: youtu.be/plGW1Drlrkg?...

Ellen and Ben
YouTube video by Dismemberment Plan - Topic
youtu.be
February 10, 2026 at 4:51 PM
mood: youtu.be/plGW1Drlrkg?...
Reposted by Robert Simmon

Three winter storms — Kristin, Leonardo and Marta — soaked the Iberian Peninsula in early 2026.
🌧️ Rainfall maps show areas in Portugal and Spain receiving 250+ mm in a week.
🌊 Copernicus Sentinel‑1 radar reveals major flooding along Portugal’s Tagus River, comparing Feb 2026 to pre‑storm conditions.
🌧️ Rainfall maps show areas in Portugal and Spain receiving 250+ mm in a week.
🌊 Copernicus Sentinel‑1 radar reveals major flooding along Portugal’s Tagus River, comparing Feb 2026 to pre‑storm conditions.


February 10, 2026 at 1:12 PM
Three winter storms — Kristin, Leonardo and Marta — soaked the Iberian Peninsula in early 2026.
🌧️ Rainfall maps show areas in Portugal and Spain receiving 250+ mm in a week.
🌊 Copernicus Sentinel‑1 radar reveals major flooding along Portugal’s Tagus River, comparing Feb 2026 to pre‑storm conditions.
🌧️ Rainfall maps show areas in Portugal and Spain receiving 250+ mm in a week.
🌊 Copernicus Sentinel‑1 radar reveals major flooding along Portugal’s Tagus River, comparing Feb 2026 to pre‑storm conditions.
mood: youtu.be/917AO_dm3Ks?...

Fischerspooner - Emerge 2020 Remastered [Official Audio]
YouTube video by Fischerspooner
youtu.be
February 10, 2026 at 1:38 AM
mood: youtu.be/917AO_dm3Ks?...
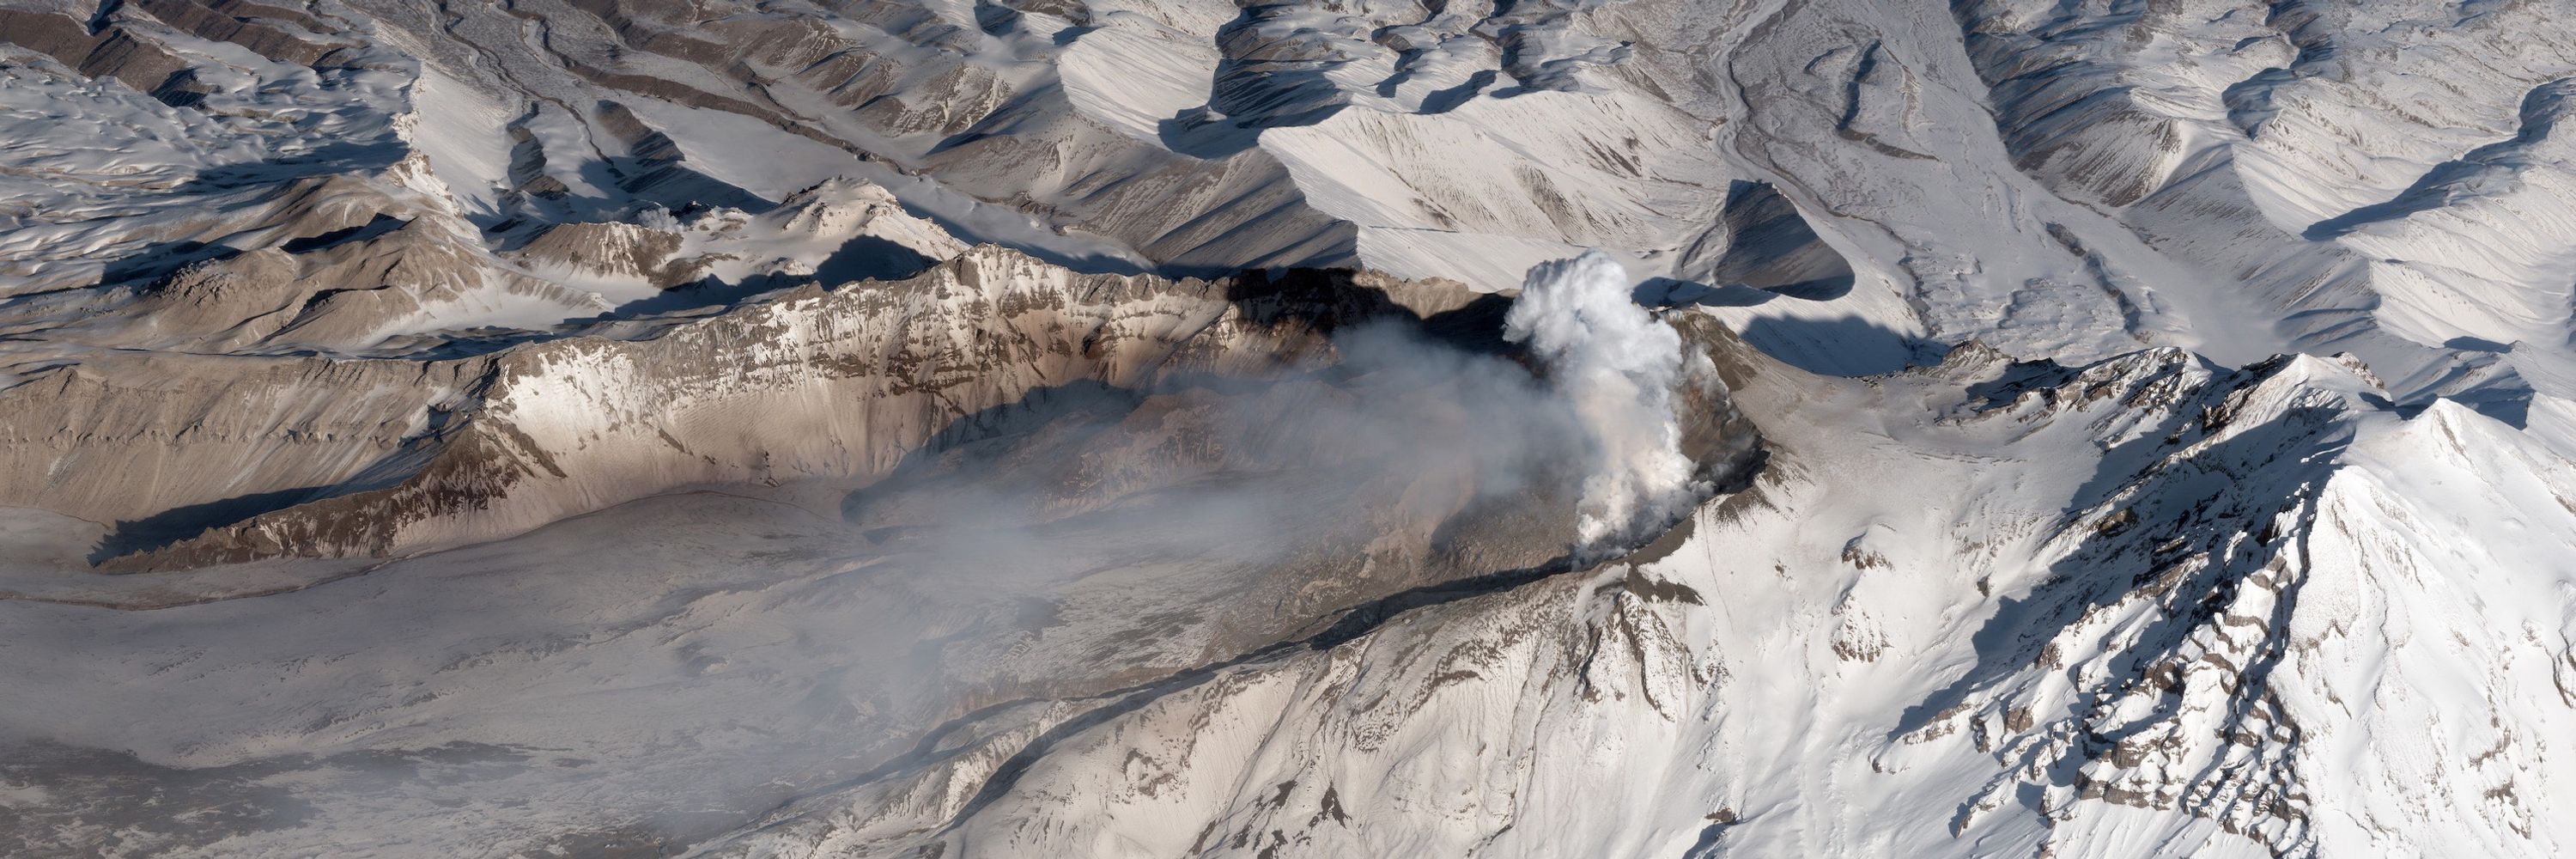
Winter landscapes of the Milano-Cortina 2026 #Olympics. Both Bormio, site of men’s alpine skiing (left), and Cortina, where the women will compete (right), had healthy snow cover on February 2nd.


February 9, 2026 at 8:20 PM
Winter landscapes of the Milano-Cortina 2026 #Olympics. Both Bormio, site of men’s alpine skiing (left), and Cortina, where the women will compete (right), had healthy snow cover on February 2nd.
I have mixed feeling about this cloud map I helped create appearing in William Rankin’s book *Radical Cartography*. On the one hand, it’s an honor. On the other hand it’s disappointing that the work we did as a small team (I think we had 5 people at the time?) gets subsumed into NASA as a whole.

February 9, 2026 at 7:24 PM
I have mixed feeling about this cloud map I helped create appearing in William Rankin’s book *Radical Cartography*. On the one hand, it’s an honor. On the other hand it’s disappointing that the work we did as a small team (I think we had 5 people at the time?) gets subsumed into NASA as a whole.
Looks like my full series on using color in #dataviz finally made the migration to the new NASA science website: science.nasa.gov/blogs/earth-...
If you’re new to visualization, or just want a refresher, it covers the basics of color theory, how to build a palette, plus some tips & tricks.
If you’re new to visualization, or just want a refresher, it covers the basics of color theory, how to build a palette, plus some tips & tricks.

Introduction (Subtleties of Color, Part 1 of 6) - NASA Science
The purpose of data visualization—any data visualization—is to illuminate data. To show patterns and relationships that are otherwise hidden in an impenetrable mass of numbers.
science.nasa.gov
February 9, 2026 at 5:42 PM
Looks like my full series on using color in #dataviz finally made the migration to the new NASA science website: science.nasa.gov/blogs/earth-...
If you’re new to visualization, or just want a refresher, it covers the basics of color theory, how to build a palette, plus some tips & tricks.
If you’re new to visualization, or just want a refresher, it covers the basics of color theory, how to build a palette, plus some tips & tricks.

February 7, 2026 at 12:43 AM
It’s all fun and games until you start getting quoted by flat-earthers!
Things got less scary when I realized that this is all just a curiosity to people, that they won't ask any hard questions, and that they'll happily accept whatever you say. (That said, the last radio interview was on air live, which was a little nerve-wracking!)
February 6, 2026 at 9:45 PM
It’s all fun and games until you start getting quoted by flat-earthers!
Reposted by Robert Simmon

Well, they put me on TV. youtu.be/vh1g-8HrUS4

Meet the cartographer turning data into stories
YouTube video by Chronicle 5 WCVB
youtu.be
February 6, 2026 at 5:08 PM
Well, they put me on TV. youtu.be/vh1g-8HrUS4
mood: youtu.be/IKOW2ZikGW8?...

BILLY BRAGG - CITY OF HEROES
YouTube video by Billy Bragg
youtu.be
February 6, 2026 at 4:49 PM
mood: youtu.be/IKOW2ZikGW8?...
Reposted by Robert Simmon

Iran IRGCN fast attack craft swarm spotted TODAY in Strait of Hormuz at
26.3253, 56.8145
40 vessels on international waters 14 nmi off Iran. Coming from Sirik´s Shahid Seyyed Majid Base at
26.3253, 56.8145
Note several high altitude drone contrail induced cirrus clouds.
26.3253, 56.8145
40 vessels on international waters 14 nmi off Iran. Coming from Sirik´s Shahid Seyyed Majid Base at
26.3253, 56.8145
Note several high altitude drone contrail induced cirrus clouds.

February 6, 2026 at 2:42 PM
Iran IRGCN fast attack craft swarm spotted TODAY in Strait of Hormuz at
26.3253, 56.8145
40 vessels on international waters 14 nmi off Iran. Coming from Sirik´s Shahid Seyyed Majid Base at
26.3253, 56.8145
Note several high altitude drone contrail induced cirrus clouds.
26.3253, 56.8145
40 vessels on international waters 14 nmi off Iran. Coming from Sirik´s Shahid Seyyed Majid Base at
26.3253, 56.8145
Note several high altitude drone contrail induced cirrus clouds.
Reposted by Robert Simmon

I was laid off from the Washington Post today, along with hundreds (!!!) of incredible colleagues. If you need a data journalist, chart designer, or wacky-idea-specialist, give me a shout!
February 4, 2026 at 5:33 PM
I was laid off from the Washington Post today, along with hundreds (!!!) of incredible colleagues. If you need a data journalist, chart designer, or wacky-idea-specialist, give me a shout!
Reposted by Robert Simmon

I'm not very active here, but given the news: I'm one of the hundreds of reporters laid off from the Post. I worked as a graphics reporter, mostly covering the U.S economy and politics.
My portfolio: www.lmelgar.me
My portfolio: www.lmelgar.me
You're in Luis' website.
www.lmelgar.me
February 4, 2026 at 9:32 PM
I'm not very active here, but given the news: I'm one of the hundreds of reporters laid off from the Post. I worked as a graphics reporter, mostly covering the U.S economy and politics.
My portfolio: www.lmelgar.me
My portfolio: www.lmelgar.me
You can tell when one of the San Ramon quakes is over M 3.0 because you can feel it on the other side of the hills in Oakland.

Even in a region used to regular shaking, it’s been a lot. (gift link) www.nytimes.com/2026/02/05/u...

People in This San Francisco Suburb Would Like the Earth to Just Stop Shaking, Please
www.nytimes.com
February 5, 2026 at 8:26 PM
You can tell when one of the San Ramon quakes is over M 3.0 because you can feel it on the other side of the hills in Oakland.