


Don C. Schmitz
@tallydon.bsky.social
Conservation Biologist (retired) -invasive species prevention, management, research, ecological impacts, government policy, and climate change wildlife adaptation and invasive species.
Pinned
Don C. Schmitz
@tallydon.bsky.social
· Oct 19

I served as the lead editor, author, and organizer for a state report on invasive species in Florida, which was later expanded into a book to reach a broader audience. I’m sharing this information to assure you that I am not a bot.
Reposted by Don C. Schmitz

Monday ice update - #Arctic sea ice extent is currently the *2nd* lowest on record (JAXA data)
• about 770,000 km² below the 2010s mean
• about 1,390,000 km² below the 2000s mean
• about 2,010,000 km² below the 1990s mean
• about 2,530,000 km² below the 1980s mean
More zacklabe.com/arctic-sea-i...
• about 770,000 km² below the 2010s mean
• about 1,390,000 km² below the 2000s mean
• about 2,010,000 km² below the 1990s mean
• about 2,530,000 km² below the 1980s mean
More zacklabe.com/arctic-sea-i...

November 25, 2025 at 12:00 AM
Monday ice update - #Arctic sea ice extent is currently the *2nd* lowest on record (JAXA data)
• about 770,000 km² below the 2010s mean
• about 1,390,000 km² below the 2000s mean
• about 2,010,000 km² below the 1990s mean
• about 2,530,000 km² below the 1980s mean
More zacklabe.com/arctic-sea-i...
• about 770,000 km² below the 2010s mean
• about 1,390,000 km² below the 2000s mean
• about 2,010,000 km² below the 1990s mean
• about 2,530,000 km² below the 1980s mean
More zacklabe.com/arctic-sea-i...
Reposted by Don C. Schmitz

www.dailymail.co.uk/real-estate/...
“Hail now causes more home-damage dollars nationwide than hurricanes in some years, and is driving insurance premiums in the Great Plains to the highest levels in America.” As predicted by scientists.
“Hail now causes more home-damage dollars nationwide than hurricanes in some years, and is driving insurance premiums in the Great Plains to the highest levels in America.” As predicted by scientists.

A new menace is blowing up home insurance costs
A tiny Nebraska town with less than 4,000 residents was left in ruins after softball-sized hail storm battered homes, shattered windows, and caused $100 million in property damage.
www.dailymail.co.uk
November 23, 2025 at 4:48 PM
www.dailymail.co.uk/real-estate/...
“Hail now causes more home-damage dollars nationwide than hurricanes in some years, and is driving insurance premiums in the Great Plains to the highest levels in America.” As predicted by scientists.
“Hail now causes more home-damage dollars nationwide than hurricanes in some years, and is driving insurance premiums in the Great Plains to the highest levels in America.” As predicted by scientists.
Reposted by Don C. Schmitz

And we warned them with our new 2025 State of the Climate Report which you can check out here: doi.org/10.1093/bios...

November 14, 2025 at 7:31 AM
And we warned them with our new 2025 State of the Climate Report which you can check out here: doi.org/10.1093/bios...
Reposted by Don C. Schmitz
In our Climate Report my coauthors and I say: We are hurtling toward climate chaos. The planet's vital signs are flashing red. Consequences of human-driven alterations of the climate are no longer future threats but are here now. Read report here doi.org/10.1093/bios...

The 2025 state of the climate report: a planet on the brink
We are hurtling toward climate chaos. The planet's vital signs are flashing red. The consequences of human-driven alterations of the climate are no longer
doi.org
November 22, 2025 at 11:10 PM
In our Climate Report my coauthors and I say: We are hurtling toward climate chaos. The planet's vital signs are flashing red. Consequences of human-driven alterations of the climate are no longer future threats but are here now. Read report here doi.org/10.1093/bios...
Reposted by Don C. Schmitz

Charts like this paint an overly optimistic picture
Many countries are off track for delivery & are unlikely to fully implement their current policy targets without greater action
E.g UKs Climate Change Commitee asseses that there is insufficient implementation to meet 40%of our emissions target!
Many countries are off track for delivery & are unlikely to fully implement their current policy targets without greater action
E.g UKs Climate Change Commitee asseses that there is insufficient implementation to meet 40%of our emissions target!

November 17, 2025 at 12:49 PM
Charts like this paint an overly optimistic picture
Many countries are off track for delivery & are unlikely to fully implement their current policy targets without greater action
E.g UKs Climate Change Commitee asseses that there is insufficient implementation to meet 40%of our emissions target!
Many countries are off track for delivery & are unlikely to fully implement their current policy targets without greater action
E.g UKs Climate Change Commitee asseses that there is insufficient implementation to meet 40%of our emissions target!
Reposted by Don C. Schmitz
Friday ice update - #Arctic sea ice extent is currently the *2nd* lowest on record (JAXA data)
• about 720,000 km² below the 2010s mean
• about 1,390,000 km² below the 2000s mean
• about 2,010,000 km² below the 1990s mean
• about 2,520,000 km² below the 1980s mean
More zacklabe.com/arctic-sea-i...
• about 720,000 km² below the 2010s mean
• about 1,390,000 km² below the 2000s mean
• about 2,010,000 km² below the 1990s mean
• about 2,520,000 km² below the 1980s mean
More zacklabe.com/arctic-sea-i...

November 21, 2025 at 1:28 PM
Friday ice update - #Arctic sea ice extent is currently the *2nd* lowest on record (JAXA data)
• about 720,000 km² below the 2010s mean
• about 1,390,000 km² below the 2000s mean
• about 2,010,000 km² below the 1990s mean
• about 2,520,000 km² below the 1980s mean
More zacklabe.com/arctic-sea-i...
• about 720,000 km² below the 2010s mean
• about 1,390,000 km² below the 2000s mean
• about 2,010,000 km² below the 1990s mean
• about 2,520,000 km² below the 1980s mean
More zacklabe.com/arctic-sea-i...
Reposted by Don C. Schmitz
A view of this year's extreme sea surface temperatures and recent warming across the North Pacific... 🌊
This graph shows the average for a band across the midlatitudes for every average January-October period from 1854-2025 using ERSSTv5 data.
This graph shows the average for a band across the midlatitudes for every average January-October period from 1854-2025 using ERSSTv5 data.

November 19, 2025 at 1:28 AM
A view of this year's extreme sea surface temperatures and recent warming across the North Pacific... 🌊
This graph shows the average for a band across the midlatitudes for every average January-October period from 1854-2025 using ERSSTv5 data.
This graph shows the average for a band across the midlatitudes for every average January-October period from 1854-2025 using ERSSTv5 data.
Reposted by Don C. Schmitz

A number of new estimates of current policy warming by 2100 have been released in recent months, including three prominent ones from UNEP, IEA, and CAT in the run-up to COP30.
I've got a new piece over at The Climate Brink digging into the details: www.theclimatebrink....
I've got a new piece over at The Climate Brink digging into the details: www.theclimatebrink....

November 14, 2025 at 6:52 PM
A number of new estimates of current policy warming by 2100 have been released in recent months, including three prominent ones from UNEP, IEA, and CAT in the run-up to COP30.
I've got a new piece over at The Climate Brink digging into the details: www.theclimatebrink....
I've got a new piece over at The Climate Brink digging into the details: www.theclimatebrink....
Reposted by Don C. Schmitz

“As the planet warms, so much ice has been erased from around Mount Everest that the elevation at base camp in Nepal, which sits on a melting glacier, has dropped more than 220 feet since the 1980s.” www.nytimes.com/interactive/...

Melting Glaciers in the Himalayas Feed Lakes That Threaten Towns Below
Melting ice from the Himalayas is creating thousands of unstable lakes, a growing menace to towns and cities below.
www.nytimes.com
November 14, 2025 at 2:07 PM
“As the planet warms, so much ice has been erased from around Mount Everest that the elevation at base camp in Nepal, which sits on a melting glacier, has dropped more than 220 feet since the 1980s.” www.nytimes.com/interactive/...
Reposted by Don C. Schmitz
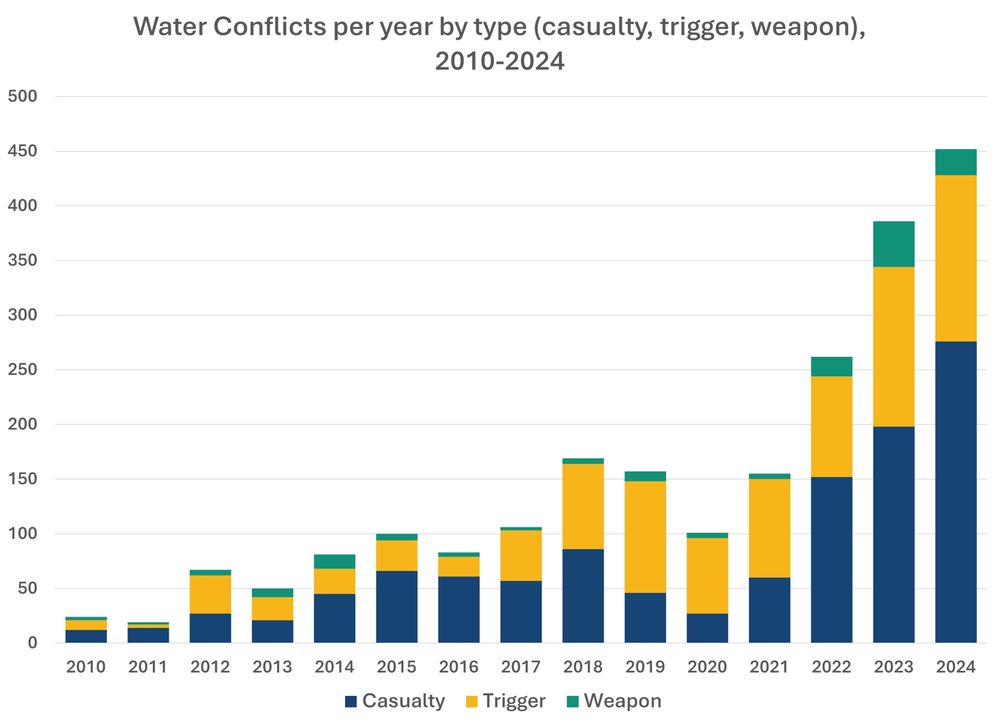
Dramatic increase in conflicts over #water in 2024 compared to previous years.
pacinst.org/announcement...
pacinst.org/announcement...
November 14, 2025 at 3:53 AM
Dramatic increase in conflicts over #water in 2024 compared to previous years.
pacinst.org/announcement...
pacinst.org/announcement...
Something to ponder.

November 14, 2025 at 2:17 AM
Something to ponder.
Reposted by Don C. Schmitz

Never forget: At breakneck speed we are leaving the stable Holocene climate in which human society developed and thrived. Weather extremes are outside historical experience. Sea-level rise is accelerating. Dangerous tipping points are ahead.
Graph: ed-hawkins.github.io/climate-visu...
Graph: ed-hawkins.github.io/climate-visu...

November 13, 2025 at 11:52 AM
Never forget: At breakneck speed we are leaving the stable Holocene climate in which human society developed and thrived. Weather extremes are outside historical experience. Sea-level rise is accelerating. Dangerous tipping points are ahead.
Graph: ed-hawkins.github.io/climate-visu...
Graph: ed-hawkins.github.io/climate-visu...
Reposted by Don C. Schmitz

"To achieve this through..... direct air capture, would require the construction of the world’s second biggest industry, after oil and gas, and require expenditures of about a trillion dollars a year"
Pie in the sky
www.theguardian.com/environment/...
Pie in the sky
www.theguardian.com/environment/...

Removing CO2 from atmosphere vital to avoid catastrophic tipping points, leading scientist says
10bn tonnes must be captured from the air every year to limit global heating to 1.7C, says Johan Rockström
www.theguardian.com
November 11, 2025 at 9:26 PM
"To achieve this through..... direct air capture, would require the construction of the world’s second biggest industry, after oil and gas, and require expenditures of about a trillion dollars a year"
Pie in the sky
www.theguardian.com/environment/...
Pie in the sky
www.theguardian.com/environment/...
Reposted by Don C. Schmitz

Relevant as #COP30 gets underway...
"As Trump abdicates U.S. leadership on climate change, Asia is filling the void" | New op-ed by Benjamin Horton & myself for the @sfchronicle.com: www.sfchronicle.com/opinion/open...

As Trump abdicates U.S. leadership on climate change, Asia is filling the void
OPINION: The U.S. once led the charge in confronting the planet’s most pressing challenges. But today, that leadership is eroding. Nowhere is this loss more visible than in climate science.
www.sfchronicle.com
November 11, 2025 at 5:44 PM
Relevant as #COP30 gets underway...
Global emissions are up 34% since the first COP conference in 1995.
The market for solar panels & EVs has grown - but so has fossil fuel use. However, without the COP process, world temperatures would be headed for a catastrophic 5C of heating, instead of the 3C+ increase that is now projected.
The market for solar panels & EVs has grown - but so has fossil fuel use. However, without the COP process, world temperatures would be headed for a catastrophic 5C of heating, instead of the 3C+ increase that is now projected.

November 8, 2025 at 6:07 PM
Global emissions are up 34% since the first COP conference in 1995.
The market for solar panels & EVs has grown - but so has fossil fuel use. However, without the COP process, world temperatures would be headed for a catastrophic 5C of heating, instead of the 3C+ increase that is now projected.
The market for solar panels & EVs has grown - but so has fossil fuel use. However, without the COP process, world temperatures would be headed for a catastrophic 5C of heating, instead of the 3C+ increase that is now projected.
Reposted by Don C. Schmitz
“These things came [to California] clearly from another region, another country — and that means all of our waterways are at risk,” Ransom said, calling the mussels a “serious emerging threat” to farms, water supplies, and recreation.
www.mercurynews.com/2025/11/06/e...
www.mercurynews.com/2025/11/06/e...

‘Emerging threat’: An invasive species is upending life in the Delta, with no help on the way
One year after the discovery that golden mussels had invaded the Delta, thick colonies coat boats and piers and threaten water supplies for cities and farms. Yet the state has no specific funding o…
www.mercurynews.com
November 7, 2025 at 4:25 AM
“These things came [to California] clearly from another region, another country — and that means all of our waterways are at risk,” Ransom said, calling the mussels a “serious emerging threat” to farms, water supplies, and recreation.
www.mercurynews.com/2025/11/06/e...
www.mercurynews.com/2025/11/06/e...
Reposted by Don C. Schmitz
I believe it’s time we adopt a universal symbol to represent humanity’s failure to heed scientists’ warnings about climate change—while we still have the power to prevent the worst outcomes. Symbols can work because they communicate powerful ideas instantly—without needing words.

November 6, 2025 at 3:03 PM
I believe it’s time we adopt a universal symbol to represent humanity’s failure to heed scientists’ warnings about climate change—while we still have the power to prevent the worst outcomes. Symbols can work because they communicate powerful ideas instantly—without needing words.
We still hold the power to prevent the worst outcomes of climate change if we act decisively to end our dependence on fossil fuels. But that window is closing fast. Humanity needs to get their heads out of the sand before it is too late to stop climate change!
November 6, 2025 at 2:00 PM
We still hold the power to prevent the worst outcomes of climate change if we act decisively to end our dependence on fossil fuels. But that window is closing fast. Humanity needs to get their heads out of the sand before it is too late to stop climate change!
Something timely and new for your Holiday tree this year?

November 1, 2025 at 2:12 AM
Something timely and new for your Holiday tree this year?
Reposted by Don C. Schmitz
Let me excerpt the concluding paragraph:

October 31, 2025 at 10:50 PM
Let me excerpt the concluding paragraph:
Let’s go back to the 1950s when children consumed Strontium 90 in their breakfast meals every morning. It was the breakfast of champions.

October 30, 2025 at 1:16 PM
Let’s go back to the 1950s when children consumed Strontium 90 in their breakfast meals every morning. It was the breakfast of champions.
Given the United States’ current trajectory of promoting fossil fuel use—and if future elections continue to reinforce this direction—our only remaining choice may soon be how we prefer humanity cooked: medium rare, medium, well done, or extra crispy. Just madness.
"It’s a scandal the U.S. is pulling back from efforts to address environmental challenges,” said Peter Gleick. “The rest of the world should ignore efforts by the US to delay progress on these problems… and I’m hopeful that other countries will continue to step up.”
www.latimes.com/environment/...
www.latimes.com/environment/...

Humanity is on path toward 'climate chaos,' scientists warn
Global use of fossil fuels rose to a new record last year, releasing even more greenhouse gases. Humanity is 'hurtling toward climate chaos,' scientists warn.
www.latimes.com
October 29, 2025 at 8:40 PM
Given the United States’ current trajectory of promoting fossil fuel use—and if future elections continue to reinforce this direction—our only remaining choice may soon be how we prefer humanity cooked: medium rare, medium, well done, or extra crispy. Just madness.
Stopping climate change has become a battle of communication—a struggle to win the hearts and minds of people around the world. Unfortunately, the fossil fuel industry is winning that battle with ease, as if taking candy from a baby.

October 24, 2025 at 3:50 PM
Stopping climate change has become a battle of communication—a struggle to win the hearts and minds of people around the world. Unfortunately, the fossil fuel industry is winning that battle with ease, as if taking candy from a baby.
Reposted by Don C. Schmitz

Climate disasters in first half of 2025 costliest ever on record, research shows.
LA wildfires and storms this year cost $101bn, new study by non-profit resurrecting work axed by Trump says.
www.theguardian.com/environment/...
LA wildfires and storms this year cost $101bn, new study by non-profit resurrecting work axed by Trump says.
www.theguardian.com/environment/...

Climate disasters in first half of 2025 costliest ever on record, research shows
LA wildfires and storms this year cost $101bn, new study by non-profit resurrecting work axed by Trump says
www.theguardian.com
October 22, 2025 at 4:17 PM
Climate disasters in first half of 2025 costliest ever on record, research shows.
LA wildfires and storms this year cost $101bn, new study by non-profit resurrecting work axed by Trump says.
www.theguardian.com/environment/...
LA wildfires and storms this year cost $101bn, new study by non-profit resurrecting work axed by Trump says.
www.theguardian.com/environment/...