


Antonia Hadjimichael
@hadjimichael.bsky.social
Assistant Prof. at Penn State Geosciences
Water | Deep Uncertainty | Data Analytics | Visualization
🇨🇾
https://www.hadjimichaelgroup.info/
Water | Deep Uncertainty | Data Analytics | Visualization
🇨🇾
https://www.hadjimichaelgroup.info/
Locally relevant and decision relevant climate information is indeed a lot harder to produce (even in advanced nations with strong data and scientific enterprises), but so much more useful and usable by communities and individuals.

I know this would be a lot harder, but I would want to see localized information – and things that people can relate to. Such as the number of days over a high temperature threshold, or number of days since an extreme weather disaster.
April 9, 2025 at 2:22 AM
Locally relevant and decision relevant climate information is indeed a lot harder to produce (even in advanced nations with strong data and scientific enterprises), but so much more useful and usable by communities and individuals.
Selling Bahn Mis to Pennsylvanians

March 24, 2025 at 4:57 PM
Selling Bahn Mis to Pennsylvanians
The Institute for Energy and the Environment here at Penn State worked with me on this Colorado River Q&A that just got published this week.
iee.psu.edu/news/blog/co...
Some pretty neat graphics too!
iee.psu.edu/news/blog/co...
Some pretty neat graphics too!

The Colorado River crisis: Water shortages, climate change, and sustainable management
The Colorado River faces challenges from overallocation, climate change, and rising demand, but ongoing conservation efforts, innovative management strategies, and collaboration are helping to ensure ...
iee.psu.edu
March 21, 2025 at 4:45 PM
The Institute for Energy and the Environment here at Penn State worked with me on this Colorado River Q&A that just got published this week.
iee.psu.edu/news/blog/co...
Some pretty neat graphics too!
iee.psu.edu/news/blog/co...
Some pretty neat graphics too!
Reposted by Antonia Hadjimichael

This is quite a comprehensive list. Some of the suggestions are terrible. Many are great (big ups to the famous @drjeffmasters.bsky.social flood risk assessment list).
This is also a 100% insane ask to put climate adaptation onus on individual homeowners when this is what is required.
🎁 link:
This is also a 100% insane ask to put climate adaptation onus on individual homeowners when this is what is required.
🎁 link:

How to Shop for a Home That Won’t Be Upended by Climate Change (Gift Article)
Deciding where to live has always been a high-stakes financial decision, but a changing climate makes it even more critical. This guide will get you started.
www.nytimes.com
March 19, 2025 at 12:28 PM
This is quite a comprehensive list. Some of the suggestions are terrible. Many are great (big ups to the famous @drjeffmasters.bsky.social flood risk assessment list).
This is also a 100% insane ask to put climate adaptation onus on individual homeowners when this is what is required.
🎁 link:
This is also a 100% insane ask to put climate adaptation onus on individual homeowners when this is what is required.
🎁 link:
Reposted by Antonia Hadjimichael

CSH's coolest #workshop is coming up! Join visualization pros Liuhuaying Yang and Paul Kahn, along with a talented team of experts from the worlds of art, #science, journalism, and #visualization. Don’t miss out—applications are open until March 20! 👉 vis.csh.ac.at/vis-workshop...
#dataviz
#dataviz


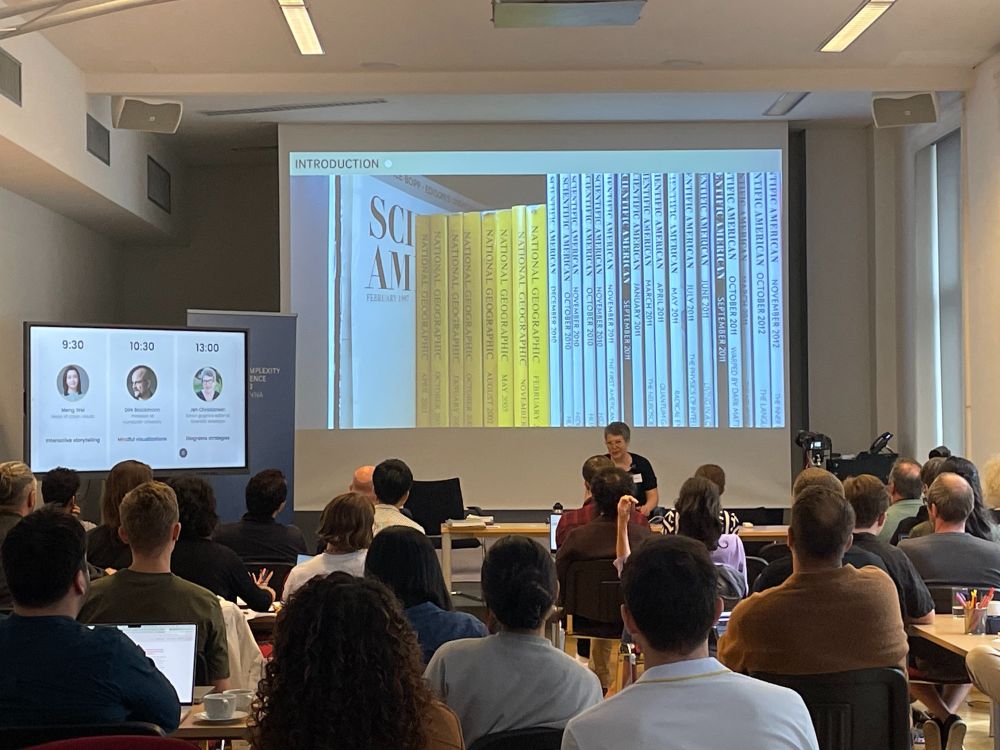

February 19, 2025 at 9:58 AM
CSH's coolest #workshop is coming up! Join visualization pros Liuhuaying Yang and Paul Kahn, along with a talented team of experts from the worlds of art, #science, journalism, and #visualization. Don’t miss out—applications are open until March 20! 👉 vis.csh.ac.at/vis-workshop...
#dataviz
#dataviz
Join us this Thursday on a joint webinar with Penelope Mitchell, organized under the Women Advancing River Research series. I will be talking about complex water resources systems, uncertainty, and using scenario storylines (you know, the usual!)
Registration info below ⬇️
Registration info below ⬇️

Happy Women + Girls in Science Day to all!
WARR talk, 2/20
Dr. Antonia Hadjimichael, Penn State
Dr. Penelope Mitchell, U. Alabama
on Climate, Water, Society, Science, Decision ...
Register: psu.zoom.us/meeting/regi...
Past talks: www.cee.psu.edu/events/women...
@waterbarnes.bsky.social
WARR talk, 2/20
Dr. Antonia Hadjimichael, Penn State
Dr. Penelope Mitchell, U. Alabama
on Climate, Water, Society, Science, Decision ...
Register: psu.zoom.us/meeting/regi...
Past talks: www.cee.psu.edu/events/women...
@waterbarnes.bsky.social

February 18, 2025 at 4:08 PM
Join us this Thursday on a joint webinar with Penelope Mitchell, organized under the Women Advancing River Research series. I will be talking about complex water resources systems, uncertainty, and using scenario storylines (you know, the usual!)
Registration info below ⬇️
Registration info below ⬇️
Reposted by Antonia Hadjimichael

with new Jan 2025 data, and by popular request, RICH MAN POOR MAN purchasing power re-visioned for eggs:
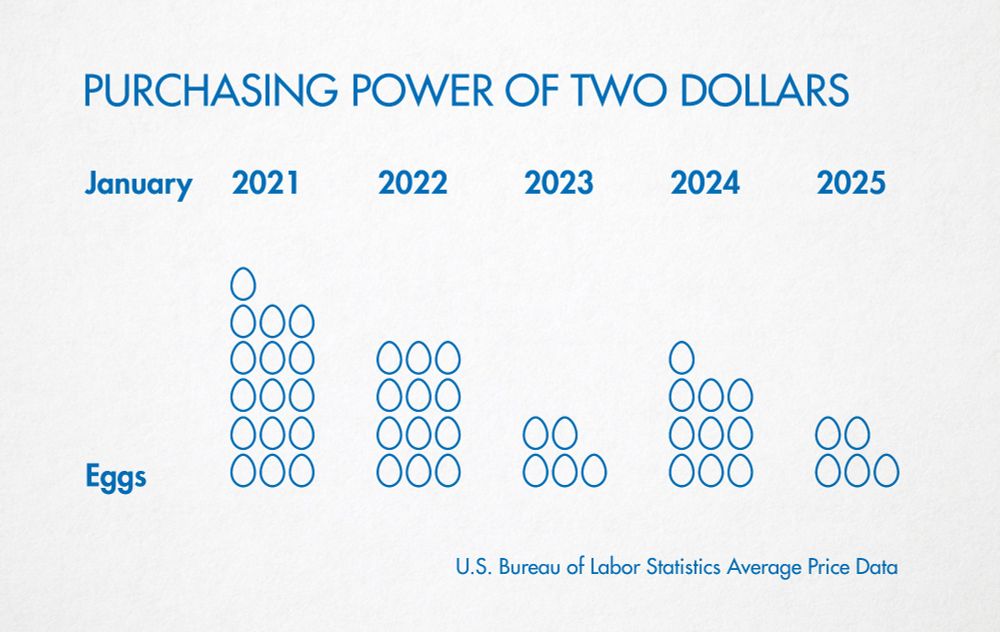
February 16, 2025 at 7:42 PM
with new Jan 2025 data, and by popular request, RICH MAN POOR MAN purchasing power re-visioned for eggs:
Reposted by Antonia Hadjimichael

Data visualization is challenging, especially when moving from exploratory purposes (i.e., to discover or understand the data) to explanatory purposes (i.e., communication with others).
In a paper led by @hadjimichael.bsky.social we discuss different visuals iopscience.iop.org/article/10.1...
In a paper led by @hadjimichael.bsky.social we discuss different visuals iopscience.iop.org/article/10.1...

December 19, 2024 at 12:18 PM
Data visualization is challenging, especially when moving from exploratory purposes (i.e., to discover or understand the data) to explanatory purposes (i.e., communication with others).
In a paper led by @hadjimichael.bsky.social we discuss different visuals iopscience.iop.org/article/10.1...
In a paper led by @hadjimichael.bsky.social we discuss different visuals iopscience.iop.org/article/10.1...
Reposted by Antonia Hadjimichael

A year ago today the IPCC published its #AR6 Synthesis Report: Climate Change 2023
Finally releasing my 4th & final #infographic explaining — at a super high level — what the olympics of climate science had to say.
eciu.net/analysis/inf...
@ketanjoshi.co @katharinehayhoe.com @davidho.bsky.social
Finally releasing my 4th & final #infographic explaining — at a super high level — what the olympics of climate science had to say.
eciu.net/analysis/inf...
@ketanjoshi.co @katharinehayhoe.com @davidho.bsky.social

IPCC Explainer: Climate change synthesis report
Informed debate on energy and climate change.
eciu.net
March 20, 2024 at 8:26 AM
A year ago today the IPCC published its #AR6 Synthesis Report: Climate Change 2023
Finally releasing my 4th & final #infographic explaining — at a super high level — what the olympics of climate science had to say.
eciu.net/analysis/inf...
@ketanjoshi.co @katharinehayhoe.com @davidho.bsky.social
Finally releasing my 4th & final #infographic explaining — at a super high level — what the olympics of climate science had to say.
eciu.net/analysis/inf...
@ketanjoshi.co @katharinehayhoe.com @davidho.bsky.social
Reposted by Antonia Hadjimichael
Sometimes I wonder if spring is coming much earlier because spring is coming much earlier.
www.washingtonpost.com/climate-envi...
www.washingtonpost.com/climate-envi...

Analysis | You’re not crazy. Spring is getting earlier. Find out how it’s changed in your town.
Readers told us how spring has changed where they live. Look up your town to see when leaves are sprouting and how spring’s arrival time has changed.
www.washingtonpost.com
March 13, 2024 at 1:37 PM
Sometimes I wonder if spring is coming much earlier because spring is coming much earlier.
www.washingtonpost.com/climate-envi...
www.washingtonpost.com/climate-envi...
Reposted by Antonia Hadjimichael
Graham et al. delve into market integration's uncertainty impact on virtual water trading and regional water demands. Virtual water trading could increase by over 500% by 2100. Check out the findings:
www.sciencedirect.com/science/arti...
www.sciencedirect.com/science/arti...

March 13, 2024 at 3:16 PM
Graham et al. delve into market integration's uncertainty impact on virtual water trading and regional water demands. Virtual water trading could increase by over 500% by 2100. Check out the findings:
www.sciencedirect.com/science/arti...
www.sciencedirect.com/science/arti...
Reposted by Antonia Hadjimichael

#WeAre hiring for a tenure-track faculty position in environmental engineering❗
CEE and IEEPennState are accepting applications for this new faculty position. For full consideration, apply by March 15.
Learn more and apply here ➡️ bit.ly/4bk0DgA
CEE and IEEPennState are accepting applications for this new faculty position. For full consideration, apply by March 15.
Learn more and apply here ➡️ bit.ly/4bk0DgA

Tenure-Track Faculty Position in Environmental Engineering
APPLICATION INSTRUCTIONS: CURRENT PENN STATE EMPLOYEE (faculty, staff, technical service, or student), please login to Workday to complete the internal application process. Please do not apply here, a...
bit.ly
February 28, 2024 at 3:38 PM
#WeAre hiring for a tenure-track faculty position in environmental engineering❗
CEE and IEEPennState are accepting applications for this new faculty position. For full consideration, apply by March 15.
Learn more and apply here ➡️ bit.ly/4bk0DgA
CEE and IEEPennState are accepting applications for this new faculty position. For full consideration, apply by March 15.
Learn more and apply here ➡️ bit.ly/4bk0DgA
Coolest short story you'll watch today ⬇️

Holy smokes, my colleague @christiansenjen.bsky.social just made the coolest TikTok about Joy Division’s Unknown Pleasures cover art. You and everyone you know should go see it.
TikTok - Make Your Day
www.tiktok.com
February 29, 2024 at 5:41 AM
Coolest short story you'll watch today ⬇️
Reposted by Antonia Hadjimichael

Exciting update! @copernicusecmwf.bsky.social - launch the Interactive Climate Atlas
atlas.climate.copernicus.eu/atlas
This new tool builds on the data of the IPCC Climate Atlas and enables exploration of CMIP6 climate projections and other datasets including observations and reanalysis.
atlas.climate.copernicus.eu/atlas
This new tool builds on the data of the IPCC Climate Atlas and enables exploration of CMIP6 climate projections and other datasets including observations and reanalysis.


February 20, 2024 at 12:17 PM
Exciting update! @copernicusecmwf.bsky.social - launch the Interactive Climate Atlas
atlas.climate.copernicus.eu/atlas
This new tool builds on the data of the IPCC Climate Atlas and enables exploration of CMIP6 climate projections and other datasets including observations and reanalysis.
atlas.climate.copernicus.eu/atlas
This new tool builds on the data of the IPCC Climate Atlas and enables exploration of CMIP6 climate projections and other datasets including observations and reanalysis.
We're looking to hire an Environmental Data Analytics Postdoc to join our team at Penn State and closely collaborate with Michael Waring (at Drexel) in a DOE-funded project and other opportunities. For more info and to apply: psu.wd1.myworkdayjobs.com/PSU_Academic...
Please share with your networks!
Please share with your networks!

February 20, 2024 at 3:07 PM
We're looking to hire an Environmental Data Analytics Postdoc to join our team at Penn State and closely collaborate with Michael Waring (at Drexel) in a DOE-funded project and other opportunities. For more info and to apply: psu.wd1.myworkdayjobs.com/PSU_Academic...
Please share with your networks!
Please share with your networks!
This paper is a fantastic resource on scientific data visualization best practice, especially if you, like me, dislike blunt visualization rules like "pie charts are bad".

I keep returning to this long paper by Steve Franconeri, Lace Padilla, Jessica Hullman, and others; it's a good summary of recommendations in visualization design based on the limited evidence we have: www2.econ.iastate.edu/tesfatsi/Sci...

February 19, 2024 at 6:37 PM
This paper is a fantastic resource on scientific data visualization best practice, especially if you, like me, dislike blunt visualization rules like "pie charts are bad".
Reposted by Antonia Hadjimichael

Ways that researchers can improve the likelihood their outputs will have policy impact include but are not limited to:
• Don’t publish in a predatory/low-quality journal
• Make work open access or otherwise available
• Summarize findings in the title and abstract (please!)
• Talk about the work
• Don’t publish in a predatory/low-quality journal
• Make work open access or otherwise available
• Summarize findings in the title and abstract (please!)
• Talk about the work
February 18, 2024 at 2:16 PM
Ways that researchers can improve the likelihood their outputs will have policy impact include but are not limited to:
• Don’t publish in a predatory/low-quality journal
• Make work open access or otherwise available
• Summarize findings in the title and abstract (please!)
• Talk about the work
• Don’t publish in a predatory/low-quality journal
• Make work open access or otherwise available
• Summarize findings in the title and abstract (please!)
• Talk about the work
Hello, I am here!
February 13, 2024 at 11:19 PM
Hello, I am here!