


Christoph Kinkeldey
@geovisual.bsky.social
visualization lecturer, researcher, developer. datavis, geovis, uncertainty vis. professor of media informatics and data visualization at university of applied sciences hamburg.
Reposted by Christoph Kinkeldey

#VISRocks @ieeevis.bsky.social Great evening at #westcoastsocial @aappi.bsky.social truly rocked on base and @geovisual.bsky.social on vocals.


November 5, 2025 at 6:55 AM
#VISRocks @ieeevis.bsky.social Great evening at #westcoastsocial @aappi.bsky.social truly rocked on base and @geovisual.bsky.social on vocals.
Reposted by Christoph Kinkeldey

Met @geovisual.bsky.social‘s data journalism class at HAW Hamburg yesterday. Amazing projects coming soon via fink.hamburg!

July 10, 2025 at 3:57 PM
Met @geovisual.bsky.social‘s data journalism class at HAW Hamburg yesterday. Amazing projects coming soon via fink.hamburg!
our workshop "uncertainty visualization in data journalism" at univ. of applied sciences hamburg brought together data journalists to reflect on how uncertainty is handled in journalistic work and how it can be communicated more effectively.
🚀 thanks to all who contributed their time and insights!
🚀 thanks to all who contributed their time and insights!


May 19, 2025 at 3:56 PM
our workshop "uncertainty visualization in data journalism" at univ. of applied sciences hamburg brought together data journalists to reflect on how uncertainty is handled in journalistic work and how it can be communicated more effectively.
🚀 thanks to all who contributed their time and insights!
🚀 thanks to all who contributed their time and insights!
i took musk’s call not to donate to wikipedia as an opportunity to donate for wikipedia again. how about you? donate.wikimedia.org
January 6, 2025 at 10:19 AM
i took musk’s call not to donate to wikipedia as an opportunity to donate for wikipedia again. how about you? donate.wikimedia.org
thrilled to have you join forces with us for this exciting course on data visualization and storytelling! 🚀🚀🚀
🗞️Small life update:
I'm feeling honored to serve as a guest lecturer at the University of Applied Sciences Hamburg.
I'm teaching data journalism and data visualization together with @geovisual.bsky.social in our course Playful Data Stories. 🪄🧪
I'm feeling honored to serve as a guest lecturer at the University of Applied Sciences Hamburg.
I'm teaching data journalism and data visualization together with @geovisual.bsky.social in our course Playful Data Stories. 🪄🧪

December 12, 2024 at 4:21 PM
thrilled to have you join forces with us for this exciting course on data visualization and storytelling! 🚀🚀🚀
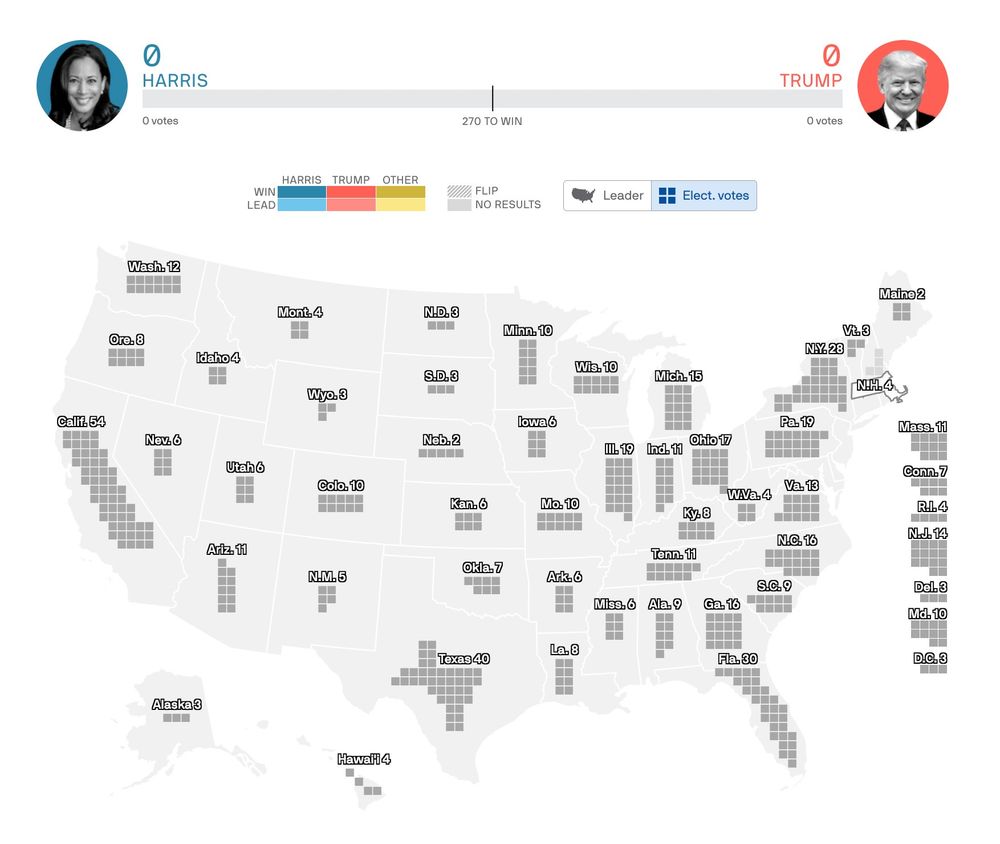
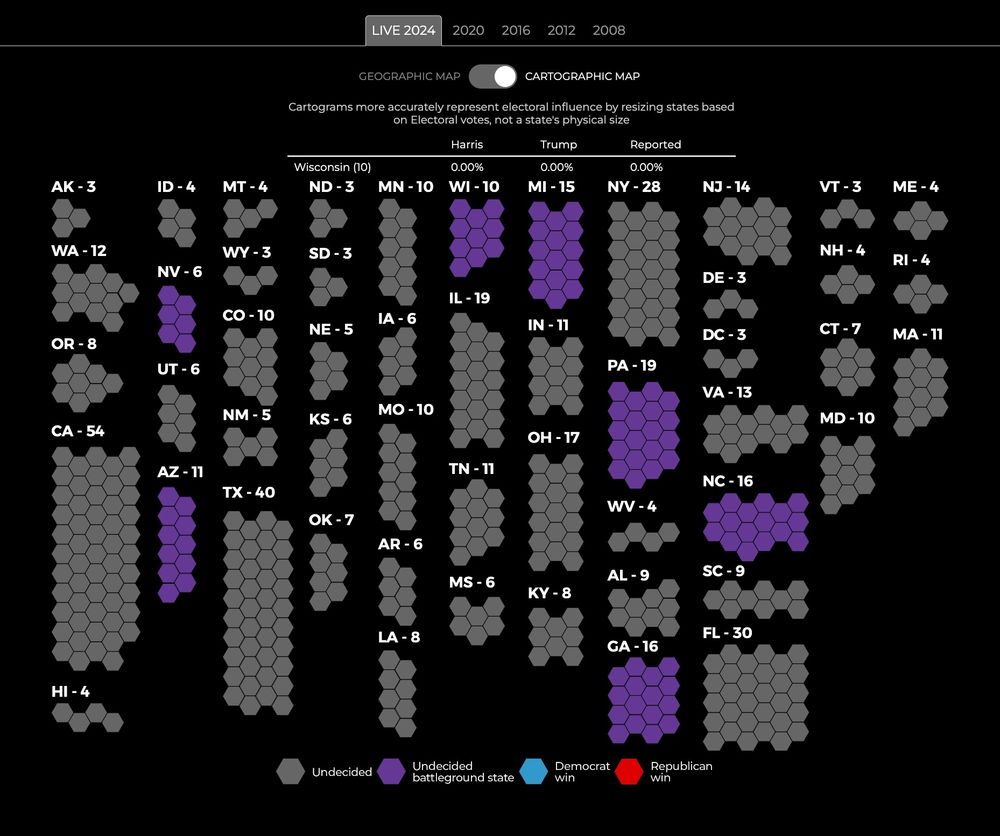
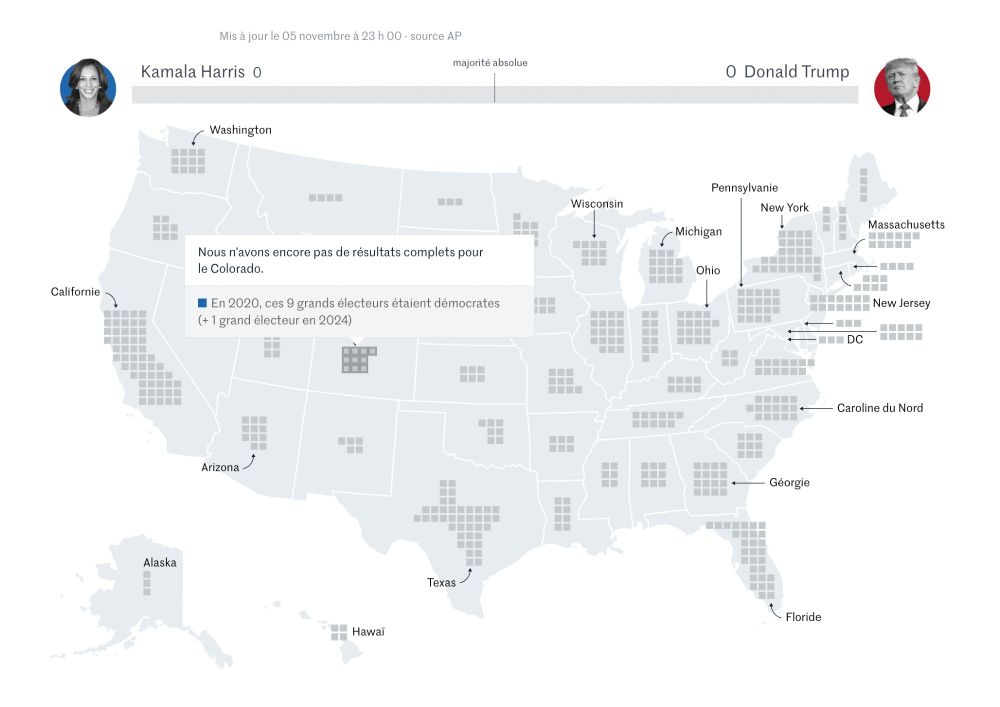
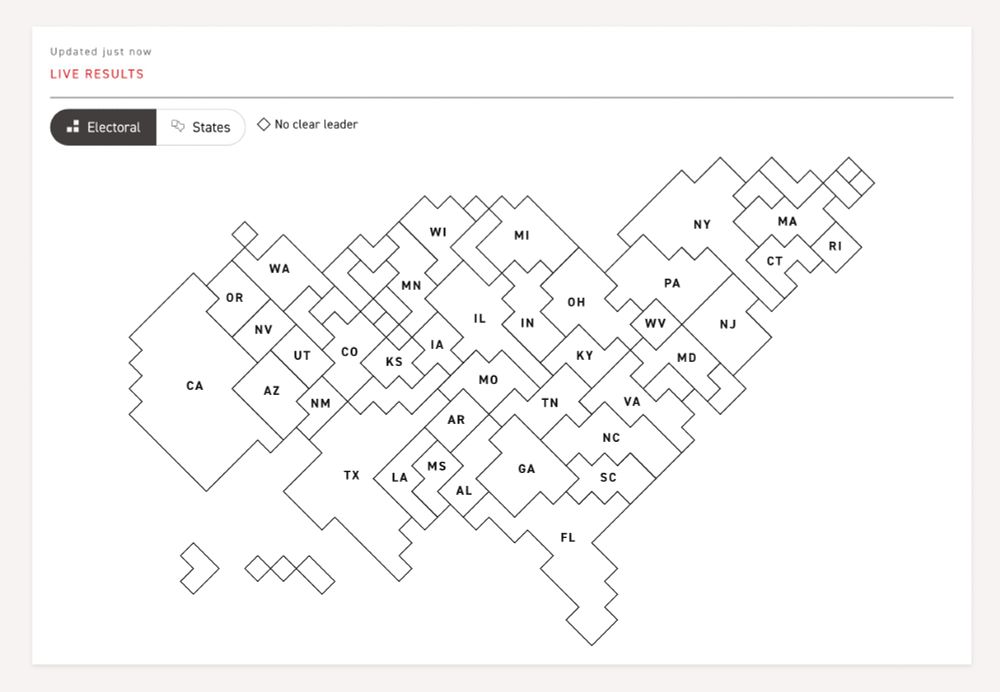
what a great collection of us election maps from various international news sites - thanks for sharing, lisa!

Curious how different news sites visualize U.S. election results? Here are 25+ links — let me know in the comments which ones I missed!
U.S. news sites
===============
→ The New York Times: www.nytimes.com/interactive/...
→ The Washington Post: www.washingtonpost.com/elections/re...
U.S. news sites
===============
→ The New York Times: www.nytimes.com/interactive/...
→ The Washington Post: www.washingtonpost.com/elections/re...
November 26, 2024 at 9:03 AM
what a great collection of us election maps from various international news sites - thanks for sharing, lisa!
see you next wednesday at our research and transfer center (ftz) "digital reality" for a cool evening about #dataviz in #xr ! 📈📊🥽
The next Dataviz meetup Hamburg is coming next week!
Join us there and register quickly.
www.meetup.com/data-visuali...
Join us there and register quickly.
www.meetup.com/data-visuali...

November 1, 2024 at 6:03 PM
Reposted by Christoph Kinkeldey


great work! i esp. appreciate the pointer to alternative map-like vis.

Excited to share some work I'll be presenting at @ieeevis.bsky.social 📊 I developed a cheat sheet of strategies for responsive thematic mapping based on interviews & design workshops with visualization/mapping practitioners. Find the cheat sheet here: responsive-vis.github.io/map-cheat-sh...

September 4, 2024 at 1:57 PM
great work! i esp. appreciate the pointer to alternative map-like vis.
haha, not bad. 📈📉

A daily game like wordle but for charts www.graphs.world

Graphs
Guess the graph's data set!
www.graphs.world
September 3, 2024 at 12:57 PM
haha, not bad. 📈📉
🚨 Job-Alert 🚨 Angewandte Forschung im Bereich Datenvisualisierung / Datenjournalismus
📊 📈 1. Stelle: Schwerpunkt Design (50 % E13 TV-L)
🧮 💾 2. Stelle: Schwerpunkt Data Science (50 % E13 TV-L)
(oder in Personalunion als 100%-Stelle)
Ping me: www.haw-hamburg.de/hochschule/b...
📊 📈 1. Stelle: Schwerpunkt Design (50 % E13 TV-L)
🧮 💾 2. Stelle: Schwerpunkt Data Science (50 % E13 TV-L)
(oder in Personalunion als 100%-Stelle)
Ping me: www.haw-hamburg.de/hochschule/b...
Prof. Dr.-Ing. Christoph Kinkeldey, HAW Hamburg
www.haw-hamburg.de
August 26, 2024 at 2:12 PM
🚨 Job-Alert 🚨 Angewandte Forschung im Bereich Datenvisualisierung / Datenjournalismus
📊 📈 1. Stelle: Schwerpunkt Design (50 % E13 TV-L)
🧮 💾 2. Stelle: Schwerpunkt Data Science (50 % E13 TV-L)
(oder in Personalunion als 100%-Stelle)
Ping me: www.haw-hamburg.de/hochschule/b...
📊 📈 1. Stelle: Schwerpunkt Design (50 % E13 TV-L)
🧮 💾 2. Stelle: Schwerpunkt Data Science (50 % E13 TV-L)
(oder in Personalunion als 100%-Stelle)
Ping me: www.haw-hamburg.de/hochschule/b...
🎉 new paper 🎉 at “computer graphics & visual computing (cgvc)” conference, delving into how data analysts in epidemiology handle data uncertainty and how we, as visualization designers, can better support them. preprint and supplemental material here: osf.io/preprints/os... (1/x)

August 15, 2024 at 3:37 PM
🎉 new paper 🎉 at “computer graphics & visual computing (cgvc)” conference, delving into how data analysts in epidemiology handle data uncertainty and how we, as visualization designers, can better support them. preprint and supplemental material here: osf.io/preprints/os... (1/x)
Reposted by Christoph Kinkeldey

Still obsessed with this German stats textbook explaining that linear regression is like fitting a large sheet of paper through a swarm of bees.

June 29, 2024 at 3:53 AM
Still obsessed with this German stats textbook explaining that linear regression is like fitting a large sheet of paper through a swarm of bees.

Happy to present Science Communication Lab projects and sharing insights into design research of #KielSCN at the first #Hamburg Data Visualization #MeeptUp @spiegelmagazin.bsky.social today, 20th June 24 at 6:30 pm. Many thanks for the invitation to
@higsch.com ! lnkd.in/eqnr2rMq #scicomm, #dataviz
@higsch.com ! lnkd.in/eqnr2rMq #scicomm, #dataviz

June 20, 2024 at 10:07 AM
Reposted by Christoph Kinkeldey

Nach dem Totalversagen in Sachen #WissZeitVG versucht das BMBF jetzt auch noch die Wissenschaftsfreiheit abzuräumen. Wie viel Schaden wollt Ihr dem Wissenschaftsstandort D eigentlich noch zufügen? 🤯 Und all das in Zeiten, in denen wissenschaftsfeindliche Kräfte weiter an Boden gewinnen. Unglaublich.

Das BMBF hat geprüft, ob es Hochschulangestellten der FU Berlin, die politische Erklärungen unterschrieben haben, deshalb Fördermittel entziehen kann. Der Mailwechsel dazu ist dokumentiert. Falls noch jemand Illusionen darüber hatte, was das Ministerium unter Wissenschaftsfreiheit versteht.
Als Reaktion auf Kritik: Bildungsministerium wollte Fördermittel streichen
Dem NDR liegen Unterlagen vor, wonach das Bundesministerium für Bildung prüfen wollte, ob kritischen Hochschullehrenden ihre Fördermittel gestrichen werden können. Grundlage der Prüfung ist ein offene...
daserste.ndr.de
June 11, 2024 at 7:47 AM
Nach dem Totalversagen in Sachen #WissZeitVG versucht das BMBF jetzt auch noch die Wissenschaftsfreiheit abzuräumen. Wie viel Schaden wollt Ihr dem Wissenschaftsstandort D eigentlich noch zufügen? 🤯 Und all das in Zeiten, in denen wissenschaftsfeindliche Kräfte weiter an Boden gewinnen. Unglaublich.
*the tension rises* 🥁

June 3, 2024 at 9:19 AM
*the tension rises* 🥁
Reposted by Christoph Kinkeldey

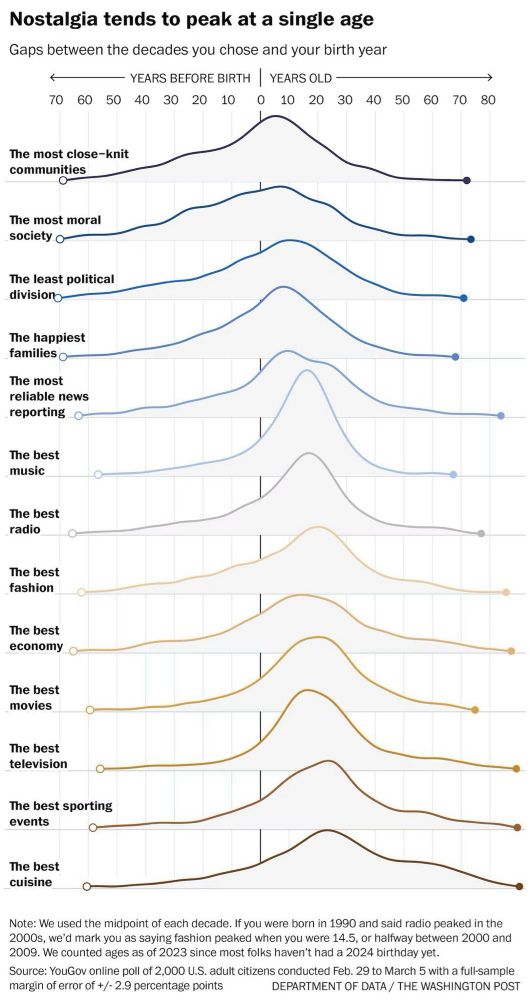
Things were not better before, they were better when you were young, no matter when you were born.
Fantastic chart 📊 with such depth and attention to detail by @andrewvandam.bsky.social
Fantastic chart 📊 with such depth and attention to detail by @andrewvandam.bsky.social
May 26, 2024 at 3:39 AM
Things were not better before, they were better when you were young, no matter when you were born.
Fantastic chart 📊 with such depth and attention to detail by @andrewvandam.bsky.social
Fantastic chart 📊 with such depth and attention to detail by @andrewvandam.bsky.social
Reposted by Christoph Kinkeldey
🚨 We are hiring!🚨
We, the data & visualizations team at
@spiegelmagazin.bsky.social, are looking for a German speaking data visualization developer! 📊
➡️ That's what we do: spiegel.de/thema/daten-...
➡️ Apply here: jobs.spiegelgruppe.de/Vacancies/11...
💬 matthias.stahl@spiegel.de for questions
We, the data & visualizations team at
@spiegelmagazin.bsky.social, are looking for a German speaking data visualization developer! 📊
➡️ That's what we do: spiegel.de/thema/daten-...
➡️ Apply here: jobs.spiegelgruppe.de/Vacancies/11...
💬 matthias.stahl@spiegel.de for questions
Daten und Visualisierungen - DER SPIEGEL
Von Datenanalysen über interaktive Rechner und visuelle Storys bis zu Dashboards und Dauerformaten – hier finden Sie alle Beiträge des Ressorts Daten & Visualisierungen.
spiegel.de
April 30, 2024 at 12:52 PM
🚨 We are hiring!🚨
We, the data & visualizations team at
@spiegelmagazin.bsky.social, are looking for a German speaking data visualization developer! 📊
➡️ That's what we do: spiegel.de/thema/daten-...
➡️ Apply here: jobs.spiegelgruppe.de/Vacancies/11...
💬 matthias.stahl@spiegel.de for questions
We, the data & visualizations team at
@spiegelmagazin.bsky.social, are looking for a German speaking data visualization developer! 📊
➡️ That's what we do: spiegel.de/thema/daten-...
➡️ Apply here: jobs.spiegelgruppe.de/Vacancies/11...
💬 matthias.stahl@spiegel.de for questions
thrilled to announce my success with the #DATIpilot pitch for the federal ministry of education and research (BMBF)! got funding for my applied research project developing a toolkit for intuitive #uncertainty #visualization for data journalists #ddj


March 13, 2024 at 8:50 PM
thrilled to announce my success with the #DATIpilot pitch for the federal ministry of education and research (BMBF)! got funding for my applied research project developing a toolkit for intuitive #uncertainty #visualization for data journalists #ddj
Reposted by Christoph Kinkeldey

Exciting update! @copernicusecmwf.bsky.social - launch the Interactive Climate Atlas
atlas.climate.copernicus.eu/atlas
This new tool builds on the data of the IPCC Climate Atlas and enables exploration of CMIP6 climate projections and other datasets including observations and reanalysis.
atlas.climate.copernicus.eu/atlas
This new tool builds on the data of the IPCC Climate Atlas and enables exploration of CMIP6 climate projections and other datasets including observations and reanalysis.


February 20, 2024 at 12:17 PM
Exciting update! @copernicusecmwf.bsky.social - launch the Interactive Climate Atlas
atlas.climate.copernicus.eu/atlas
This new tool builds on the data of the IPCC Climate Atlas and enables exploration of CMIP6 climate projections and other datasets including observations and reanalysis.
atlas.climate.copernicus.eu/atlas
This new tool builds on the data of the IPCC Climate Atlas and enables exploration of CMIP6 climate projections and other datasets including observations and reanalysis.
Reposted by Christoph Kinkeldey

📣📊 We’re excited to announce the first speakers for our Datawrapper conference on March 13-15!
👉 Amanda Cox, on making better simple charts
👉 @juliustroeger.bsky.social, on animations & scroll formats
👉 C.J. Sinner, on creating scatterplot awesomeness
Register here: www.datawrapper.de/unwrapped
👉 Amanda Cox, on making better simple charts
👉 @juliustroeger.bsky.social, on animations & scroll formats
👉 C.J. Sinner, on creating scatterplot awesomeness
Register here: www.datawrapper.de/unwrapped

Join us for Unwrapped, March 13-15
Learn how others are making the most of Datawrapper at our free, virtual conference.
www.datawrapper.de
January 29, 2024 at 4:40 PM
📣📊 We’re excited to announce the first speakers for our Datawrapper conference on March 13-15!
👉 Amanda Cox, on making better simple charts
👉 @juliustroeger.bsky.social, on animations & scroll formats
👉 C.J. Sinner, on creating scatterplot awesomeness
Register here: www.datawrapper.de/unwrapped
👉 Amanda Cox, on making better simple charts
👉 @juliustroeger.bsky.social, on animations & scroll formats
👉 C.J. Sinner, on creating scatterplot awesomeness
Register here: www.datawrapper.de/unwrapped
Reposted by Christoph Kinkeldey

This is a soft launch just for Bluesky people!
In Feb I'm launching the 'Visualising Data Newsletter' offering a monthly chronicle of the most insightful and delightful data viz content, straight to your inbox.
More info soon but you can sign up here...
visualisingdata.ck.page/b9efcf751f
In Feb I'm launching the 'Visualising Data Newsletter' offering a monthly chronicle of the most insightful and delightful data viz content, straight to your inbox.
More info soon but you can sign up here...
visualisingdata.ck.page/b9efcf751f
January 2, 2024 at 11:58 AM
This is a soft launch just for Bluesky people!
In Feb I'm launching the 'Visualising Data Newsletter' offering a monthly chronicle of the most insightful and delightful data viz content, straight to your inbox.
More info soon but you can sign up here...
visualisingdata.ck.page/b9efcf751f
In Feb I'm launching the 'Visualising Data Newsletter' offering a monthly chronicle of the most insightful and delightful data viz content, straight to your inbox.
More info soon but you can sign up here...
visualisingdata.ck.page/b9efcf751f
Reposted by Christoph Kinkeldey

2023 was the warmest year on record globally by a large margin. Another dark red stripe gets added, though I think I need a new colour.
#ShowYourStripes
#ShowYourStripes

January 1, 2024 at 9:09 PM
2023 was the warmest year on record globally by a large margin. Another dark red stripe gets added, though I think I need a new colour.
#ShowYourStripes
#ShowYourStripes
yay, the timeviz browser 2.0 is out!

the 2nd edition of the book Visualization of Time-Oriented Data is published, and the The TimeViz Browser has gotten an update too: browser.timeviz.net #dataviz #time

December 23, 2023 at 2:08 PM
yay, the timeviz browser 2.0 is out!
Reposted by Christoph Kinkeldey
Week 6 🧑🎄
Dataviz accounts to follow because they post and engage
@jasonforrest.bsky.social
@deepali.bsky.social
@domoritz.de
@thomasp85.com
@jerthorp.bsky.social
@helenajambor.bsky.social
@geovisual.bsky.social
Dataviz accounts to follow because they post and engage
@jasonforrest.bsky.social
@deepali.bsky.social
@domoritz.de
@thomasp85.com
@jerthorp.bsky.social
@helenajambor.bsky.social
@geovisual.bsky.social
December 23, 2023 at 1:54 PM
Week 6 🧑🎄
Dataviz accounts to follow because they post and engage
@jasonforrest.bsky.social
@deepali.bsky.social
@domoritz.de
@thomasp85.com
@jerthorp.bsky.social
@helenajambor.bsky.social
@geovisual.bsky.social
Dataviz accounts to follow because they post and engage
@jasonforrest.bsky.social
@deepali.bsky.social
@domoritz.de
@thomasp85.com
@jerthorp.bsky.social
@helenajambor.bsky.social
@geovisual.bsky.social