


Irving Morales
@moaimx.bsky.social
Director de Datos Abiertos en @AgenciaGobMx. Construyo cosas con datos. Los datos no son recurso para generar valor, son herramienta para entender nuestro mundo
Reposted by Irving Morales

Archaeologist here. For 99.5% of human history (ca 300-400,000 years), we were peaceful (no war). There was conflict and smaller scale violence, but countless studies on the 119 known modern hunter gatherer groups show cooperation, negotiation, and peace instead of conflict. Please read books.

Revenge/physical combat was how people settled things for literally millions of years, it's normal human behavior, we're wolves not sheep, the government project trying to social engineer us and domesticate us into sheep has been unsuccessful
November 17, 2025 at 10:46 PM
Archaeologist here. For 99.5% of human history (ca 300-400,000 years), we were peaceful (no war). There was conflict and smaller scale violence, but countless studies on the 119 known modern hunter gatherer groups show cooperation, negotiation, and peace instead of conflict. Please read books.
Reposted by Irving Morales

1/
¿Olvidaste la contraseña de tu #LlaveMX🔑?
Te damos el paso a paso para recuperarla:
1️⃣ Entra a 👉 llave.gob.mx
2️⃣ Da clic en “Olvidé mi contraseña”
3️⃣ Ingresa tu correo y recibe el enlace para restablecerla
¿Olvidaste la contraseña de tu #LlaveMX🔑?
Te damos el paso a paso para recuperarla:
1️⃣ Entra a 👉 llave.gob.mx
2️⃣ Da clic en “Olvidé mi contraseña”
3️⃣ Ingresa tu correo y recibe el enlace para restablecerla

September 23, 2025 at 1:58 AM
1/
¿Olvidaste la contraseña de tu #LlaveMX🔑?
Te damos el paso a paso para recuperarla:
1️⃣ Entra a 👉 llave.gob.mx
2️⃣ Da clic en “Olvidé mi contraseña”
3️⃣ Ingresa tu correo y recibe el enlace para restablecerla
¿Olvidaste la contraseña de tu #LlaveMX🔑?
Te damos el paso a paso para recuperarla:
1️⃣ Entra a 👉 llave.gob.mx
2️⃣ Da clic en “Olvidé mi contraseña”
3️⃣ Ingresa tu correo y recibe el enlace para restablecerla
Reposted by Irving Morales

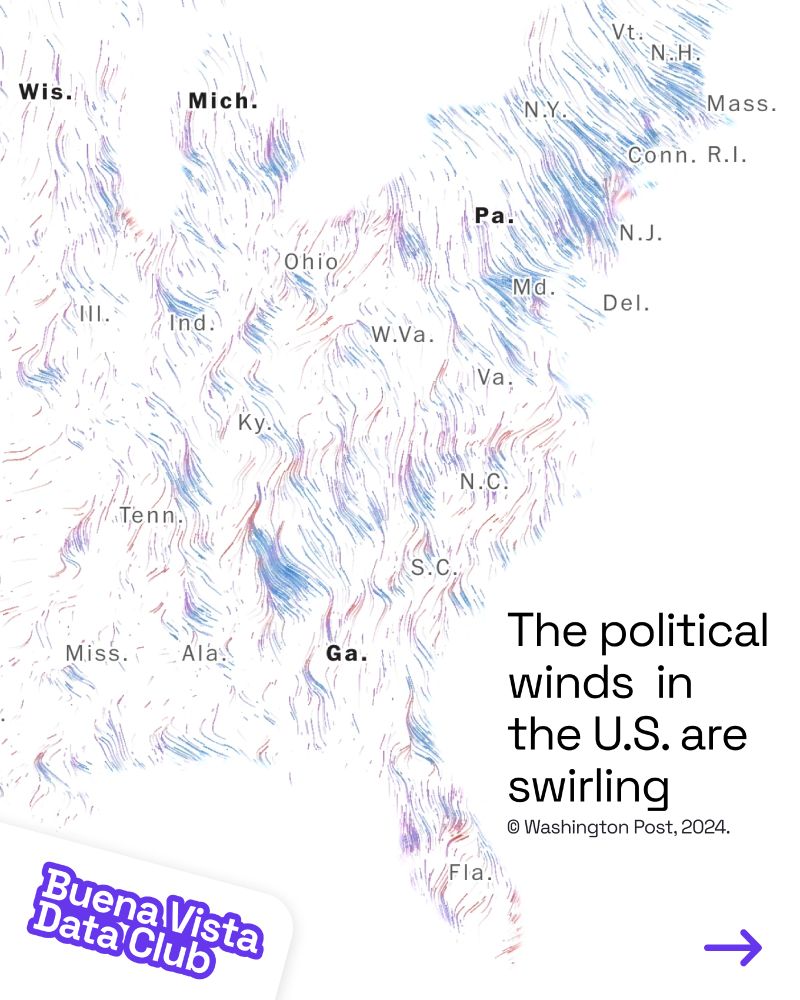
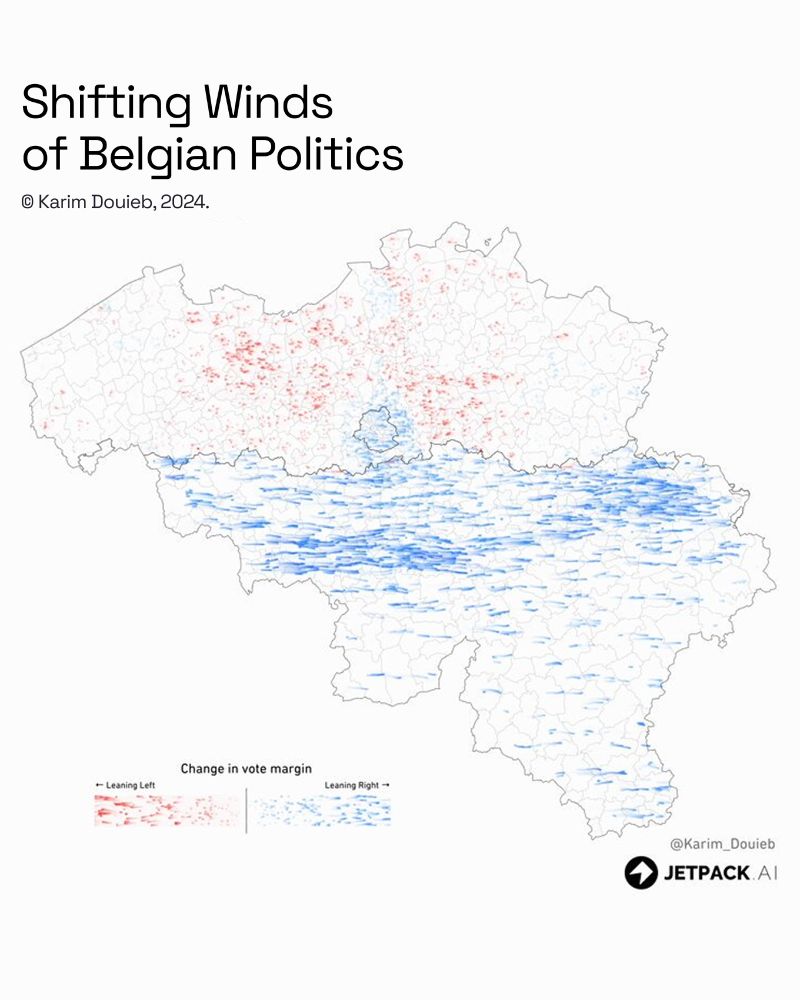
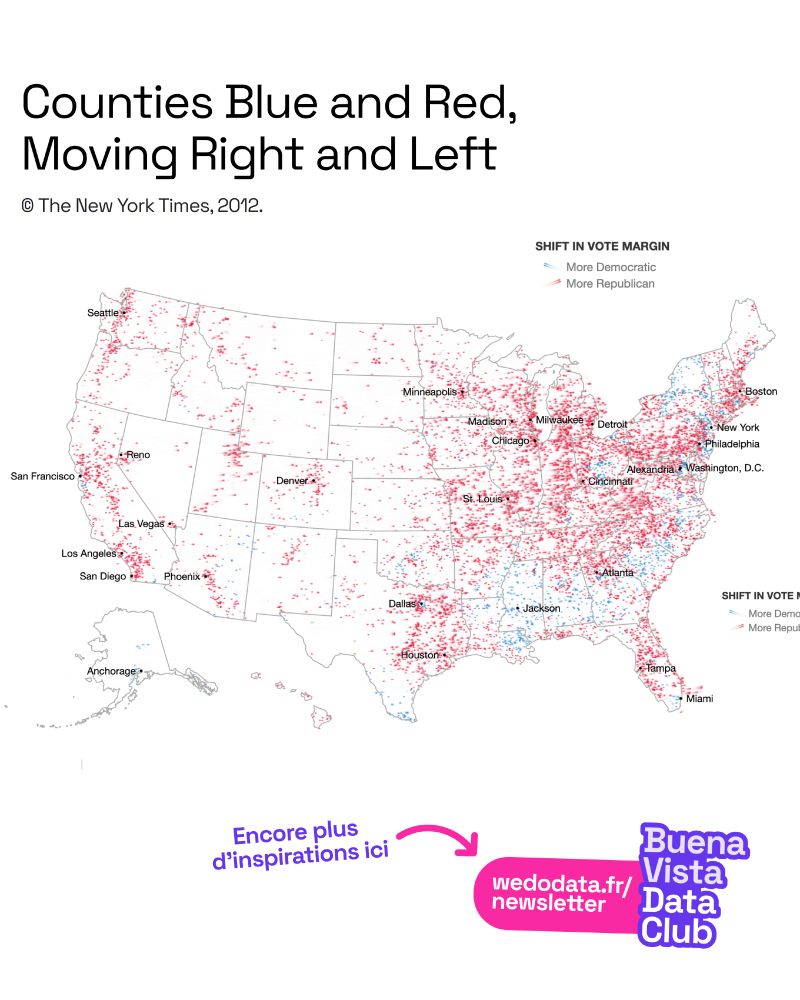
Des cartes inspirantes ! Voici des cartes qui utilisent la métaphore du vent pour illustrer la dynamique électorale entre deux dates. La direction et la couleur montrent le changement du vote sur une période donnée, la longueur du trait son intensité.
#dataviz #data #cartographie #map #carte
#dataviz #data #cartographie #map #carte
July 28, 2025 at 8:37 AM
Des cartes inspirantes ! Voici des cartes qui utilisent la métaphore du vent pour illustrer la dynamique électorale entre deux dates. La direction et la couleur montrent le changement du vote sur une période donnée, la longueur du trait son intensité.
#dataviz #data #cartographie #map #carte
#dataviz #data #cartographie #map #carte
Reposted by Irving Morales

History requires deep, extensive research a lot of that research will end up not being directly relevant. You won't know that until you get in it. Research isn't just pulling a doc with all the answers, it's finding connections, it's understanding what's *not* being said, it's knowing context.
June 16, 2025 at 2:27 PM
History requires deep, extensive research a lot of that research will end up not being directly relevant. You won't know that until you get in it. Research isn't just pulling a doc with all the answers, it's finding connections, it's understanding what's *not* being said, it's knowing context.
Reposted by Irving Morales

We do not invite the fae into the house and that now includes generative AI. We do not give them our full names and we do not, under any circumstances, make any sort of deal with them.

Humanity has had folktales about the enchanting others for as long as we’ve existed, across cultures and times. We do understand that we have dangerously vulnerable “Persuade” & “Compel” buttons that don’t have much armor or protection. Chatbots are this generation’s iteration of charming treachery.
July 15, 2025 at 1:44 AM
We do not invite the fae into the house and that now includes generative AI. We do not give them our full names and we do not, under any circumstances, make any sort of deal with them.
Reposted by Irving Morales

So much to love in the scrollytelling — the ternary plot, the depth of the data, the findings — but my favourite part is the explanation and the text in general. 📊
Remember, a chart doesn't have to be understood in 3 seconds. It should reward the effort you put into understanding it.
Remember, a chart doesn't have to be understood in 3 seconds. It should reward the effort you put into understanding it.
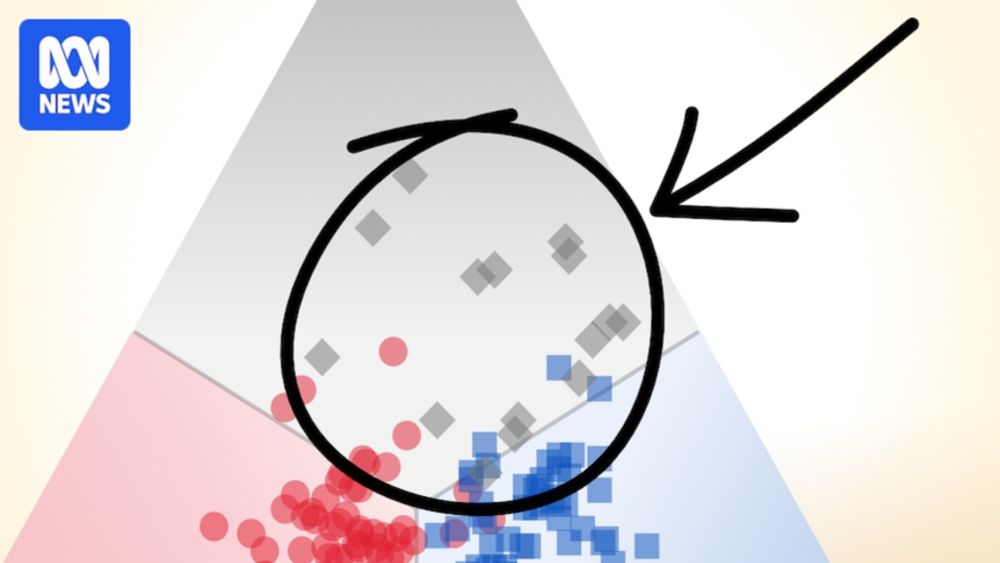
This triangle helps explain a titanic shift in how Australia votes
This triangle is going to help us explain how Australian politics has fundamentally changed over the past five decades.
www.abc.net.au
April 26, 2025 at 8:17 PM
So much to love in the scrollytelling — the ternary plot, the depth of the data, the findings — but my favourite part is the explanation and the text in general. 📊
Remember, a chart doesn't have to be understood in 3 seconds. It should reward the effort you put into understanding it.
Remember, a chart doesn't have to be understood in 3 seconds. It should reward the effort you put into understanding it.
Reposted by Irving Morales

Valentina D'Efilippo www.poppyfield.org vibes too

Poppy Field
The Great War did not 'end all wars' - Poppy Field visualises war fatalities from the beginning of the 20th Century. Credits: http://poppyfield.org by Valentina D'Efilippo and Nicolas Pigelet
www.poppyfield.org
April 26, 2025 at 3:00 PM
Valentina D'Efilippo www.poppyfield.org vibes too
Reposted by Irving Morales

Just realised what this Trump chart reminds me of


April 25, 2025 at 8:07 PM
Just realised what this Trump chart reminds me of
Reposted by Irving Morales
You can serve PMTiles directly from a cloud object storage but sometimes, you want to control who accesses data and how often—and you need a server for that. Craig Kochis wrote examples of how to serve PMTiles using a NodeJS server application.
ckochis.com/serve-protom...
ckochis.com/serve-protom...

Serve Protomaps Tiles with NodeJS | Craig Kochis
Serve Protomaps Tiles with NodeJS
ckochis.com
January 9, 2024 at 5:58 AM
You can serve PMTiles directly from a cloud object storage but sometimes, you want to control who accesses data and how often—and you need a server for that. Craig Kochis wrote examples of how to serve PMTiles using a NodeJS server application.
ckochis.com/serve-protom...
ckochis.com/serve-protom...
Que maravilla...

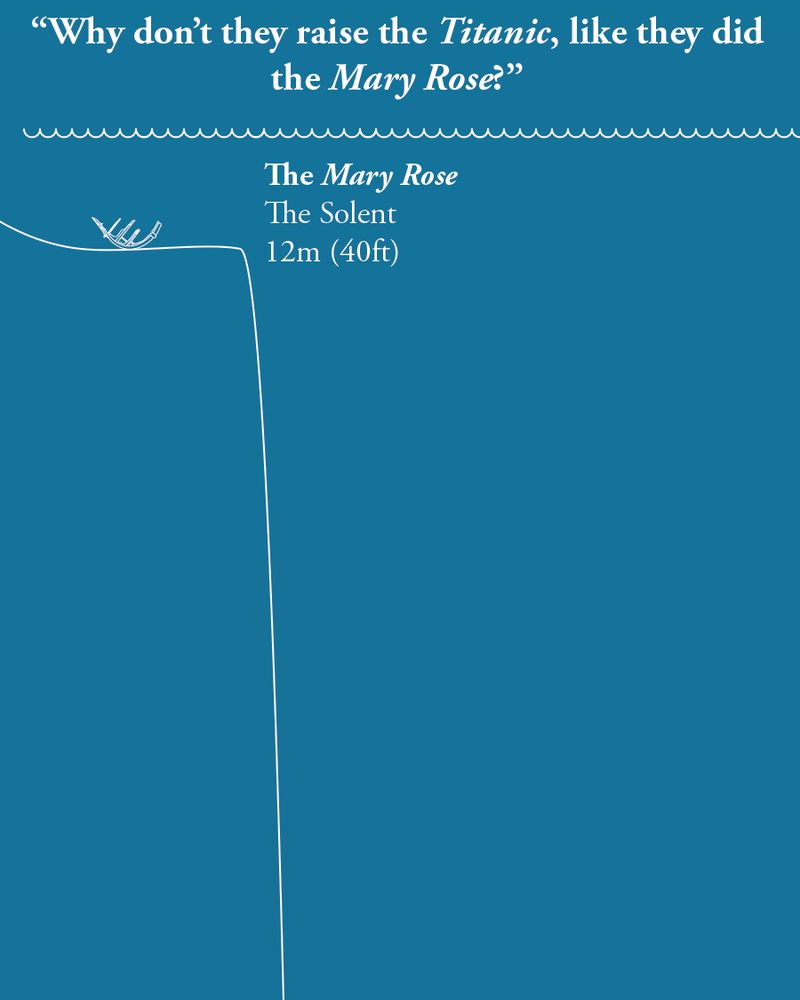
On the anniversary of the sinking of the Titanic, we thought we'd answer a question that's often asked,
"If they raised the Mary Rose, why not raise the Titanic?"
Allow our scaled diagram to explain...
"If they raised the Mary Rose, why not raise the Titanic?"
Allow our scaled diagram to explain...
April 15, 2025 at 2:37 PM
Que maravilla...
Reposted by Irving Morales

All projections are "good" and all projections are "bad". Just depends on your map's purpose and audience

Mercator projection is soooo bad!
April 14, 2025 at 12:36 PM
All projections are "good" and all projections are "bad". Just depends on your map's purpose and audience
Reposted by Irving Morales

NEW: We simulated a disease outbreak to show how vaccines can stop the spread of a contagious disease. With @fparis.bsky.social @upshot.nytimes.com (Paywall-free gift link) 🎁

How Much Vaccination Stops a Measles Outbreak? (Gift Article)
An interactive explanation of outbreaks, vaccines and herd immunity.
www.nytimes.com
April 13, 2025 at 9:14 PM
NEW: We simulated a disease outbreak to show how vaccines can stop the spread of a contagious disease. With @fparis.bsky.social @upshot.nytimes.com (Paywall-free gift link) 🎁
Reposted by Irving Morales

Large language models (LLMs) and AI tools have proven to be very useful for programming, but how do they do when writing D3 code? In this blog post, we explore Claude's ability to create and modify some basic charts from time series data.
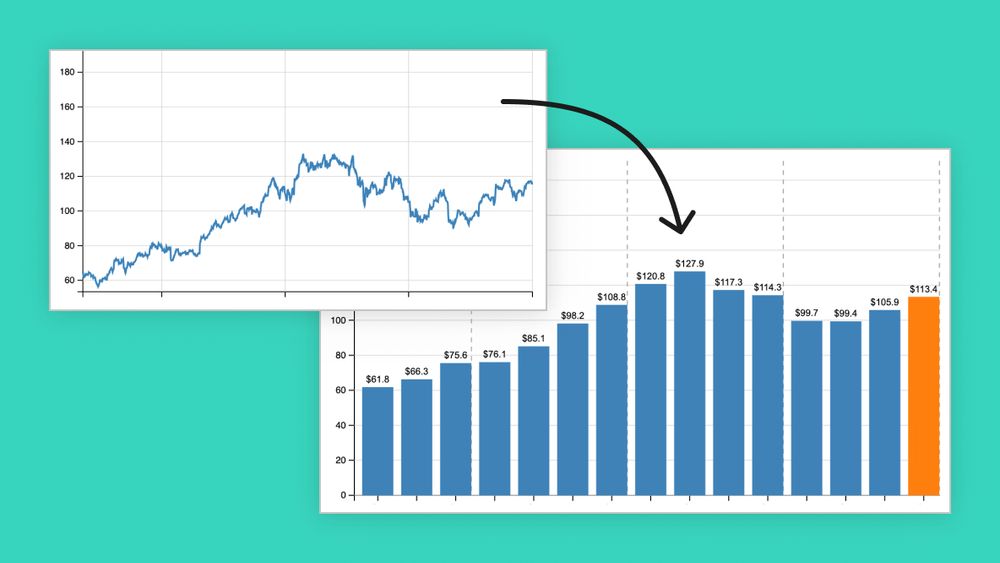
How effective are AI tools for writing D3 code?
An exploration of using Claude to help write basic D3 code for time series data
buff.ly
April 3, 2025 at 11:00 PM
Large language models (LLMs) and AI tools have proven to be very useful for programming, but how do they do when writing D3 code? In this blog post, we explore Claude's ability to create and modify some basic charts from time series data.
Reposted by Irving Morales

🚨 JOURNALISM JOB ALERT 🚨
@propublica.org is hiring a Graphics Editor to help bring our investigations to life through charts, graphs and all manner of visuals.
Apply and get all the details, including salary range, here 👇👇
@propublica.org is hiring a Graphics Editor to help bring our investigations to life through charts, graphs and all manner of visuals.
Apply and get all the details, including salary range, here 👇👇

Graphics Editor
New York City, United States; Remote, United States
job-boards.greenhouse.io
April 1, 2025 at 9:28 PM
🚨 JOURNALISM JOB ALERT 🚨
@propublica.org is hiring a Graphics Editor to help bring our investigations to life through charts, graphs and all manner of visuals.
Apply and get all the details, including salary range, here 👇👇
@propublica.org is hiring a Graphics Editor to help bring our investigations to life through charts, graphs and all manner of visuals.
Apply and get all the details, including salary range, here 👇👇
Reposted by Irving Morales


April 2, 2025 at 1:01 AM
Reposted by Irving Morales

New video tutorials! You don't need to be a developer to make cool charts — here's how to recreate some of our latest graphics without using any code.
pudding.cool/process/no-c...
pudding.cool/process/no-c...
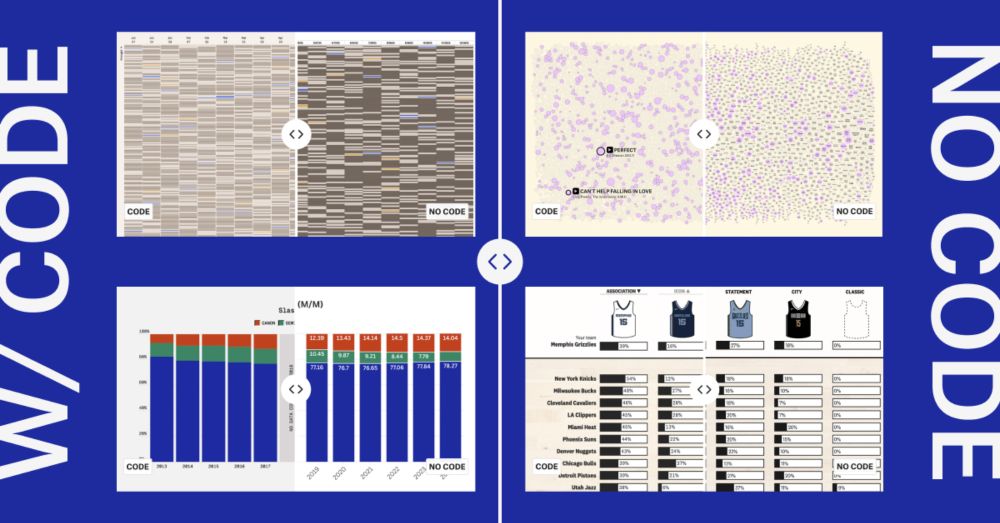
How to recreate our charts without code
Video tutorials: You don't need to know how to code to make cool charts! Here's how to do it.
pudding.cool
January 29, 2025 at 8:03 PM
New video tutorials! You don't need to be a developer to make cool charts — here's how to recreate some of our latest graphics without using any code.
pudding.cool/process/no-c...
pudding.cool/process/no-c...
Reposted by Irving Morales

last spring, after a 2 year pause in client work, I noticed a significant uptick in clients asking for line+bar+pie charts 📈📊 even tho they come to me (I thought) for bespoke #dataviz. I wrote about it here: www.shirleywu.studio/notebook/202...
fellow #dataviz friends have you experienced the same?
fellow #dataviz friends have you experienced the same?

Outside a client's comfort zone - Shirley Wu
What happens when your creative work pushes a client’s boundaries? Reflecting on a data visualization project, I share lessons on navigating feedback, balancing bold ideas with clarity, and designing ...
www.shirleywu.studio
February 12, 2025 at 10:37 PM
last spring, after a 2 year pause in client work, I noticed a significant uptick in clients asking for line+bar+pie charts 📈📊 even tho they come to me (I thought) for bespoke #dataviz. I wrote about it here: www.shirleywu.studio/notebook/202...
fellow #dataviz friends have you experienced the same?
fellow #dataviz friends have you experienced the same?


Reposted by Irving Morales

IRE’s Phil Meyer Award recognizes the best use of social science research methods in journalism.
This year’s second-place prize went to @alexiafernandezcam.bsky.social, @pratheekrebala.bsky.social, April Simpson, @jlaf.bsky.social, Nadia Hamdan, Cynthia Rodriguez and Roy Hurst: 40acresandalie.com
This year’s second-place prize went to @alexiafernandezcam.bsky.social, @pratheekrebala.bsky.social, April Simpson, @jlaf.bsky.social, Nadia Hamdan, Cynthia Rodriguez and Roy Hurst: 40acresandalie.com

40 Acres and a Lie
40acresandalie.com
March 1, 2025 at 8:00 PM
IRE’s Phil Meyer Award recognizes the best use of social science research methods in journalism.
This year’s second-place prize went to @alexiafernandezcam.bsky.social, @pratheekrebala.bsky.social, April Simpson, @jlaf.bsky.social, Nadia Hamdan, Cynthia Rodriguez and Roy Hurst: 40acresandalie.com
This year’s second-place prize went to @alexiafernandezcam.bsky.social, @pratheekrebala.bsky.social, April Simpson, @jlaf.bsky.social, Nadia Hamdan, Cynthia Rodriguez and Roy Hurst: 40acresandalie.com
Reposted by Irving Morales
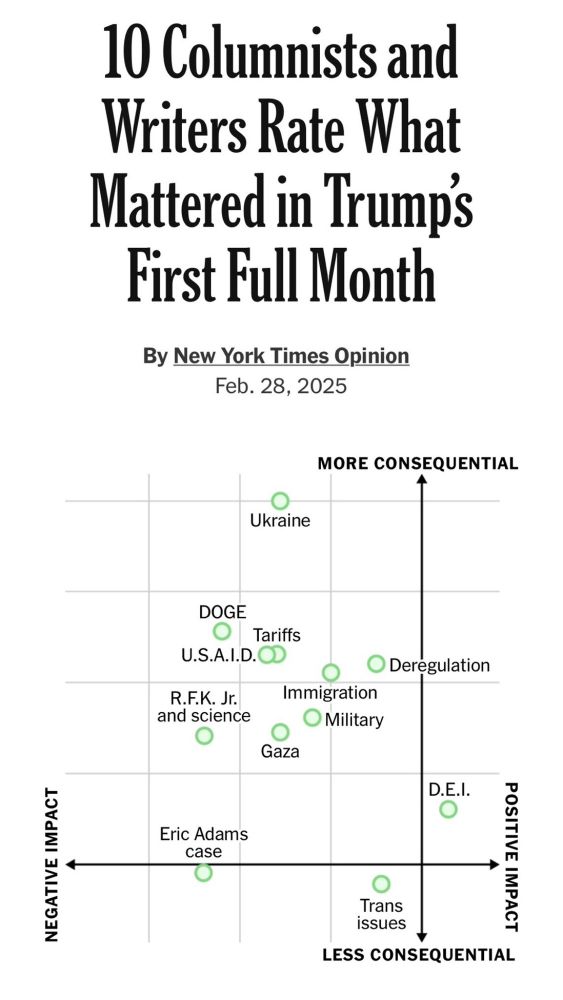
Once again, the New York Times gives the dataviz community an opportunity to reflect on its purpose.
Can everything be quantified and turned into a chart?
Most important: what are the consequences of a chart?
If words matter, charts matter too.
Can everything be quantified and turned into a chart?
Most important: what are the consequences of a chart?
If words matter, charts matter too.

Of course the NYT sees the "DEI" stuff positively & is neutral on anti-trans discrimination
March 1, 2025 at 11:33 PM
Once again, the New York Times gives the dataviz community an opportunity to reflect on its purpose.
Can everything be quantified and turned into a chart?
Most important: what are the consequences of a chart?
If words matter, charts matter too.
Can everything be quantified and turned into a chart?
Most important: what are the consequences of a chart?
If words matter, charts matter too.
Reposted by Irving Morales
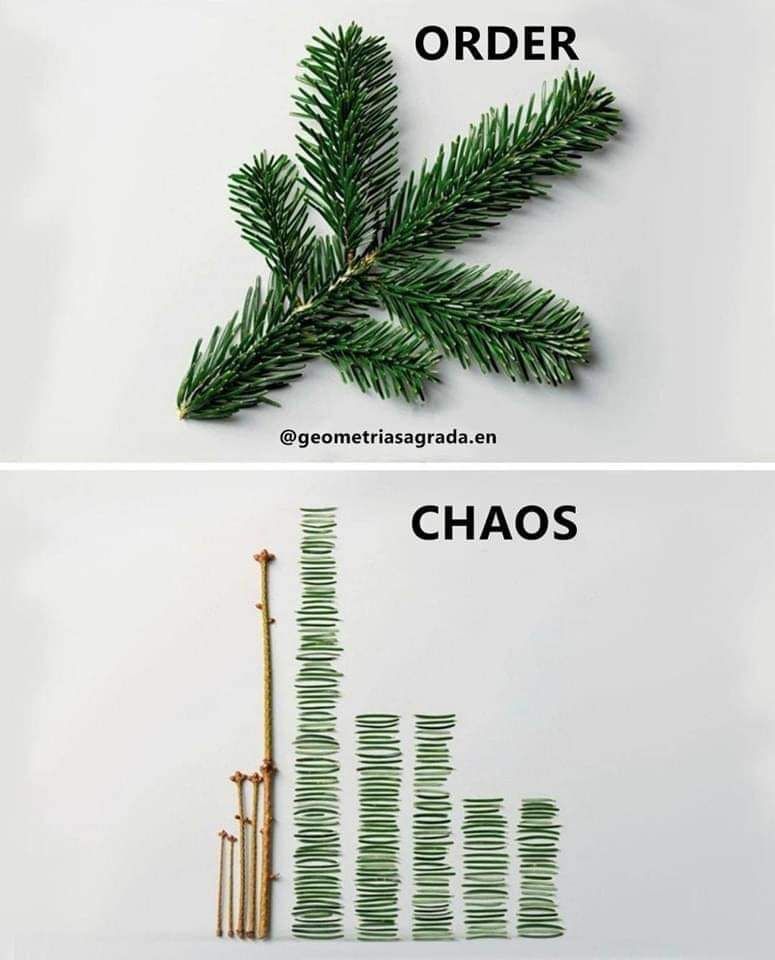
When we visualize data, we reorganize the world, grouping and degrouping people and things across categories and time.
We remove a certain order as much as we create one. 📊
We remove a certain order as much as we create one. 📊
February 25, 2025 at 1:44 PM
When we visualize data, we reorganize the world, grouping and degrouping people and things across categories and time.
We remove a certain order as much as we create one. 📊
We remove a certain order as much as we create one. 📊
Reposted by Irving Morales

Closeread Prize winners are here! 🏆
Want to create engaging, scroll-based stories with your data? See stunning scrollytelling examples made with Quarto: posit.co/blog/closere...
Learn more about Closeread and its power to create dynamic narratives. Congrats winners! #Quarto #RStats #Python
Want to create engaging, scroll-based stories with your data? See stunning scrollytelling examples made with Quarto: posit.co/blog/closere...
Learn more about Closeread and its power to create dynamic narratives. Congrats winners! #Quarto #RStats #Python
February 24, 2025 at 3:14 PM
Closeread Prize winners are here! 🏆
Want to create engaging, scroll-based stories with your data? See stunning scrollytelling examples made with Quarto: posit.co/blog/closere...
Learn more about Closeread and its power to create dynamic narratives. Congrats winners! #Quarto #RStats #Python
Want to create engaging, scroll-based stories with your data? See stunning scrollytelling examples made with Quarto: posit.co/blog/closere...
Learn more about Closeread and its power to create dynamic narratives. Congrats winners! #Quarto #RStats #Python
Reposted by Irving Morales

Every industry AI sets its evil eye lasers on says the same thing: we don't lack ideas, thanks, we lack time and money.
It's almost like AI was cooked up by people with time and money, but lacking ideas.
It's almost like AI was cooked up by people with time and money, but lacking ideas.

If you need help coming up with a 'hypotheses' you shouldn't be a scientist. Every scientist I know has 100 project ideas and lack time to get to them. No on is sitting around twiddling thumbs without an interesting question to ask.
We are in the dumbest timeline.
We are in the dumbest timeline.

Need some help with your research? Google's 'AI co-scientist' will come up with hypotheses and research plans for you 🧪
The key to it is "self-play" - a bunch of AI agents arguing among themselves - and the few scientists who've tried it so far seem impressed
www.newscientist.com/article/2469...
The key to it is "self-play" - a bunch of AI agents arguing among themselves - and the few scientists who've tried it so far seem impressed
www.newscientist.com/article/2469...
February 21, 2025 at 11:17 AM
Every industry AI sets its evil eye lasers on says the same thing: we don't lack ideas, thanks, we lack time and money.
It's almost like AI was cooked up by people with time and money, but lacking ideas.
It's almost like AI was cooked up by people with time and money, but lacking ideas.
Reposted by Irving Morales

On the communication side of dataviz — what would you say, were the "hits" in the last few years? Pieces that went viral, found wide adoption, opened new audiences, were shared a lot.
February 21, 2025 at 9:54 AM
On the communication side of dataviz — what would you say, were the "hits" in the last few years? Pieces that went viral, found wide adoption, opened new audiences, were shared a lot.
Reposted by Irving Morales
"…there’s one nut we have not been able to crack: anchoring bespoke data visualization as a full fledged profession in corporate settings."
Re-reading this article from 2017 (medium.com/visualizing-...), I wonder — where are we at 8 years on?
Re-reading this article from 2017 (medium.com/visualizing-...), I wonder — where are we at 8 years on?

There be dragons: dataviz in the industry
I started being serious about data visualization around 2005, when the field was still pretty niche and people like Martin Wattenberg, Ben…
medium.com
February 14, 2025 at 11:11 AM
"…there’s one nut we have not been able to crack: anchoring bespoke data visualization as a full fledged profession in corporate settings."
Re-reading this article from 2017 (medium.com/visualizing-...), I wonder — where are we at 8 years on?
Re-reading this article from 2017 (medium.com/visualizing-...), I wonder — where are we at 8 years on?