


Gabriel Agostini
@gsagostini.bsky.social
PhD student at Cornell Tech | he/him | cities + equity + spatial everything | fan of cats and Taylor Swift | gsagostini.github.io
Pinned
Gabriel Agostini
@gsagostini.bsky.social
· Mar 28
Migration data lets us study responses to environmental disasters, social change patterns, policy impacts, etc. But public data is too coarse, obscuring these important phenomena!
We build MIGRATE: a dataset of yearly flows between 47 billion pairs of US Census Block Groups. 1/5
We build MIGRATE: a dataset of yearly flows between 47 billion pairs of US Census Block Groups. 1/5
Reposted by Gabriel Agostini

#30DayMapChallenge 15: Fire
@sylviaimani.bsky.social visualized how Uganda’s transition toward electric cooking aligns with the reach of the national grid. Regions with denser grid networks show a strong correlation with higher household adoption of electric cooking technologies.
@sylviaimani.bsky.social visualized how Uganda’s transition toward electric cooking aligns with the reach of the national grid. Regions with denser grid networks show a strong correlation with higher household adoption of electric cooking technologies.

November 21, 2025 at 6:35 PM
#30DayMapChallenge 15: Fire
@sylviaimani.bsky.social visualized how Uganda’s transition toward electric cooking aligns with the reach of the national grid. Regions with denser grid networks show a strong correlation with higher household adoption of electric cooking technologies.
@sylviaimani.bsky.social visualized how Uganda’s transition toward electric cooking aligns with the reach of the national grid. Regions with denser grid networks show a strong correlation with higher household adoption of electric cooking technologies.
Reposted by Gabriel Agostini

For #30DayMapChallenge Day 18: Out of this world, use the `fill_z_offset` param in mapgl to "elevate" your data.
Just be careful - if you choose a value too high, you might lose your data in the sky!
#rstats
Just be careful - if you choose a value too high, you might lose your data in the sky!
#rstats
November 18, 2025 at 7:03 PM
For #30DayMapChallenge Day 18: Out of this world, use the `fill_z_offset` param in mapgl to "elevate" your data.
Just be careful - if you choose a value too high, you might lose your data in the sky!
#rstats
Just be careful - if you choose a value too high, you might lose your data in the sky!
#rstats
I took me too long to accept that "Amsterdam is just 10th Ave"
For #30DayMapChallenge day 11, a minimal map from @kennypeng.bsky.social.
Kenny extracts minimal elements from a not-as-minimal-as-it-seems object: the Manhattan street grid. "I show how Manhattan’s numbered grid of streets and avenues is more complicated than you might realize," he says.
Kenny extracts minimal elements from a not-as-minimal-as-it-seems object: the Manhattan street grid. "I show how Manhattan’s numbered grid of streets and avenues is more complicated than you might realize," he says.

November 17, 2025 at 2:47 PM
I took me too long to accept that "Amsterdam is just 10th Ave"
Reposted by Gabriel Agostini
#30DayMapChallenge day 10: Air
@jessiefin.bsky.social + Francisco Marmolejo-Cossío visualize the presence of ladrilleras, or brick kilns, which emit pollution across the state. Data cleaned by Jacqueline Calderón and Lizet Jarquin at UASLP.
Full interactive map: tinyurl.com/map10-air
@jessiefin.bsky.social + Francisco Marmolejo-Cossío visualize the presence of ladrilleras, or brick kilns, which emit pollution across the state. Data cleaned by Jacqueline Calderón and Lizet Jarquin at UASLP.
Full interactive map: tinyurl.com/map10-air

November 15, 2025 at 5:19 PM
#30DayMapChallenge day 10: Air
@jessiefin.bsky.social + Francisco Marmolejo-Cossío visualize the presence of ladrilleras, or brick kilns, which emit pollution across the state. Data cleaned by Jacqueline Calderón and Lizet Jarquin at UASLP.
Full interactive map: tinyurl.com/map10-air
@jessiefin.bsky.social + Francisco Marmolejo-Cossío visualize the presence of ladrilleras, or brick kilns, which emit pollution across the state. Data cleaned by Jacqueline Calderón and Lizet Jarquin at UASLP.
Full interactive map: tinyurl.com/map10-air
Reposted by Gabriel Agostini
#30DayMapChallenge day 9 asked us to get off our screens. @annaloganmc.bsky.social's "analog" map is a hand-painted postcard! 📫
"I chose to paint a postcard of a map of Ann Arbor where I currently live showing the Huron River!" she says
"I chose to paint a postcard of a map of Ann Arbor where I currently live showing the Huron River!" she says

November 14, 2025 at 8:42 PM
#30DayMapChallenge day 9 asked us to get off our screens. @annaloganmc.bsky.social's "analog" map is a hand-painted postcard! 📫
"I chose to paint a postcard of a map of Ann Arbor where I currently live showing the Huron River!" she says
"I chose to paint a postcard of a map of Ann Arbor where I currently live showing the Huron River!" she says
Proposing the Subway-subway (🥪-🚇) index
Day 7 of #30DayMapChallenge asked us to think about accessibility. @gsagostini.bsky.social considers two metrics of access simultaneously: distance to a Subway and distance to the subway.

November 13, 2025 at 4:37 PM
Proposing the Subway-subway (🥪-🚇) index
Great map(s) by @jennahgosciak.bsky.social ---can we count that for 6 days of mapping??---that show both the permanence and the vulnerability of ecological concepts in our urban landscapes!
#30DayMapChallenge
#30DayMapChallenge
We might be a few days delayed on the #30DayMapChallenge, but our day 5 submission spans almost 250 years of history! Our "Earth" map comes from @jennahgosciak.bsky.social, who compared the original ecology of New York City to present day variables.

November 11, 2025 at 7:03 PM
Great map(s) by @jennahgosciak.bsky.social ---can we count that for 6 days of mapping??---that show both the permanence and the vulnerability of ecological concepts in our urban landscapes!
#30DayMapChallenge
#30DayMapChallenge
Reposted by Gabriel Agostini
We are slowly catching up to the #30DayMapChallenge!
In our day 3: polygons submission, @zhixuanqi.bsky.social questioned the boundaries and fuzziness of polygons with an animated map that invites us to think about the (not-so-well-defined) idea of neighborhoods.
In our day 3: polygons submission, @zhixuanqi.bsky.social questioned the boundaries and fuzziness of polygons with an animated map that invites us to think about the (not-so-well-defined) idea of neighborhoods.
November 7, 2025 at 5:20 PM
We are slowly catching up to the #30DayMapChallenge!
In our day 3: polygons submission, @zhixuanqi.bsky.social questioned the boundaries and fuzziness of polygons with an animated map that invites us to think about the (not-so-well-defined) idea of neighborhoods.
In our day 3: polygons submission, @zhixuanqi.bsky.social questioned the boundaries and fuzziness of polygons with an animated map that invites us to think about the (not-so-well-defined) idea of neighborhoods.
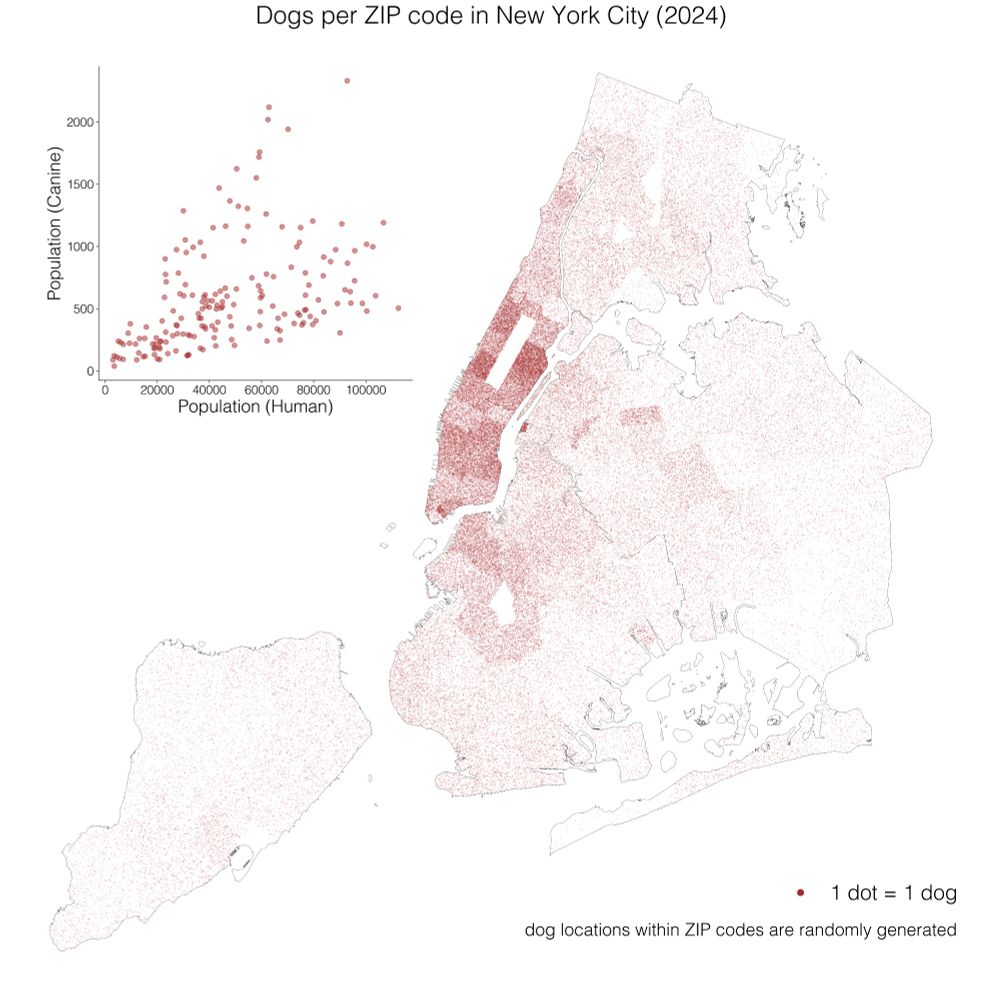
Another dog map, this is 1 dog = 1 dot. And hopefully 1 day = 1 map for the next 30 days in our working group page 🗺️
#30daymapchallenge day 1: Points
For our first map, we had to visualize spatial data as dots. @gsagostini.bsky.social worked on a dot density map showing dog density in New York City.
1 dot = 1 dog 🐕🐩
For our first map, we had to visualize spatial data as dots. @gsagostini.bsky.social worked on a dot density map showing dog density in New York City.
1 dot = 1 dog 🐕🐩
November 6, 2025 at 7:59 PM
Another dog map, this is 1 dog = 1 dot. And hopefully 1 day = 1 map for the next 30 days in our working group page 🗺️
Reposted by Gabriel Agostini

N-gram novelty is widely used as a measure of creativity and generalization. But if LLMs produce highly n-gram novel expressions that don’t make sense or sound awkward, should they still be called creative? In a new paper, we investigate how n-gram novelty relates to creativity.

November 4, 2025 at 3:08 PM
N-gram novelty is widely used as a measure of creativity and generalization. But if LLMs produce highly n-gram novel expressions that don’t make sense or sound awkward, should they still be called creative? In a new paper, we investigate how n-gram novelty relates to creativity.
Reposted by Gabriel Agostini
New #NeurIPS2025 paper: how should we evaluate machine learning models without a large, labeled dataset? We introduce Semi-Supervised Model Evaluation (SSME), which uses labeled and unlabeled data to estimate performance! We find SSME is far more accurate than standard methods.

October 17, 2025 at 4:29 PM
New #NeurIPS2025 paper: how should we evaluate machine learning models without a large, labeled dataset? We introduce Semi-Supervised Model Evaluation (SSME), which uses labeled and unlabeled data to estimate performance! We find SSME is far more accurate than standard methods.
Very happy Divya has been around during my PhD. I might be deep into maps and she might be deep into health (...and so much more!) but I could always count on learning something from her. She's such a kind researcher and great science communicator!
I am on the job market this year! My research advances methods for reliable machine learning from real-world data, with a focus on healthcare. Happy to chat if this is of interest to you or your department/team.
October 14, 2025 at 6:08 PM
Very happy Divya has been around during my PhD. I might be deep into maps and she might be deep into health (...and so much more!) but I could always count on learning something from her. She's such a kind researcher and great science communicator!
New version of our preprint! More about the project and data access on our website migrate.tech.cornell.edu
September 23, 2025 at 8:25 PM
New version of our preprint! More about the project and data access on our website migrate.tech.cornell.edu
Are you a researcher using computational methods to understand cities?
@mfranchi.bsky.social @jennahgosciak.bsky.social and I organize an EAAMO Bridges working group on Urban Data Science and we are looking for new members!
Fill the interest form on our page: urban-data-science-eaamo.github.io
@mfranchi.bsky.social @jennahgosciak.bsky.social and I organize an EAAMO Bridges working group on Urban Data Science and we are looking for new members!
Fill the interest form on our page: urban-data-science-eaamo.github.io
Urban Data Science & Equitable Cities | EAAMO Bridges
EAAMO Bridges Urban Data Science & Equitable Cities working group: biweekly talks, paper studies, and workshops on computational urban data analysis to explore and address inequities.
urban-data-science-eaamo.github.io
September 3, 2025 at 3:05 PM
Are you a researcher using computational methods to understand cities?
@mfranchi.bsky.social @jennahgosciak.bsky.social and I organize an EAAMO Bridges working group on Urban Data Science and we are looking for new members!
Fill the interest form on our page: urban-data-science-eaamo.github.io
@mfranchi.bsky.social @jennahgosciak.bsky.social and I organize an EAAMO Bridges working group on Urban Data Science and we are looking for new members!
Fill the interest form on our page: urban-data-science-eaamo.github.io
Reposted by Gabriel Agostini

*Proud advisor moment* My (first) PhD student Zhi Liu (zhiliu724.github.io) is 1 of 4 finalists for the INFORMS Dantzig Dissertation Award, the premier dissertation award for the OR community. His dissertation spanned work with 2 NYC govt agencies, on measuring and mitigating operational inequities
Zhi Liu
About me
zhiliu724.github.io
August 28, 2025 at 4:58 PM
*Proud advisor moment* My (first) PhD student Zhi Liu (zhiliu724.github.io) is 1 of 4 finalists for the INFORMS Dantzig Dissertation Award, the premier dissertation award for the OR community. His dissertation spanned work with 2 NYC govt agencies, on measuring and mitigating operational inequities
Reposted by Gabriel Agostini

"Removing the protected bike lane won’t remove cyclists — it will only make the street less safe," the Department of Transportation said in new testimony.
"The city risks legal liability for knowingly reducing safety on a Vision Zero priority corridor."
buff.ly/QNgRyts
"The city risks legal liability for knowingly reducing safety on a Vision Zero priority corridor."
buff.ly/QNgRyts

DOT Testimony: Removing Bedford Ave. Bike Lane Will 'Reduce Safety' - Streetsblog New York City
"Removing the protected bike lane won’t remove cyclists — it will only make the street less safe," the DOT said. "The city risks legal liability for knowingly reducing safety on a Vision Zero…
nyc.streetsblog.org
June 30, 2025 at 6:09 PM
"Removing the protected bike lane won’t remove cyclists — it will only make the street less safe," the Department of Transportation said in new testimony.
"The city risks legal liability for knowingly reducing safety on a Vision Zero priority corridor."
buff.ly/QNgRyts
"The city risks legal liability for knowingly reducing safety on a Vision Zero priority corridor."
buff.ly/QNgRyts
Reposted by Gabriel Agostini
New work 🎉: conformal classifiers return sets of classes for each example, with a probabilistic guarantee the true class is included. But these sets can be too large to be useful.
In our #CVPR2025 paper, we propose a method to make them more compact without sacrificing coverage.
In our #CVPR2025 paper, we propose a method to make them more compact without sacrificing coverage.

June 14, 2025 at 3:00 PM
New work 🎉: conformal classifiers return sets of classes for each example, with a probabilistic guarantee the true class is included. But these sets can be too large to be useful.
In our #CVPR2025 paper, we propose a method to make them more compact without sacrificing coverage.
In our #CVPR2025 paper, we propose a method to make them more compact without sacrificing coverage.
Reposted by Gabriel Agostini

I’m really excited to share the first paper of my PhD, “Learning Disease Progression Models That Capture Health Disparities” (accepted at #CHIL2025)! ✨ 1/
📄: arxiv.org/abs/2412.16406
📄: arxiv.org/abs/2412.16406
May 1, 2025 at 12:57 PM
I’m really excited to share the first paper of my PhD, “Learning Disease Progression Models That Capture Health Disparities” (accepted at #CHIL2025)! ✨ 1/
📄: arxiv.org/abs/2412.16406
📄: arxiv.org/abs/2412.16406
Reposted by Gabriel Agostini
Can vision-language models understand figurative meaning in multimodal inputs, like visual metaphors, sarcastic captions or memes? Come find out at our #NAACL2025 poster on Friday at 9am!
New task & dataset of images and captions with figurative phenomena like metaphor, idiom, sarcasm, and humor.
New task & dataset of images and captions with figurative phenomena like metaphor, idiom, sarcasm, and humor.

May 1, 2025 at 4:30 PM
Can vision-language models understand figurative meaning in multimodal inputs, like visual metaphors, sarcastic captions or memes? Come find out at our #NAACL2025 poster on Friday at 9am!
New task & dataset of images and captions with figurative phenomena like metaphor, idiom, sarcasm, and humor.
New task & dataset of images and captions with figurative phenomena like metaphor, idiom, sarcasm, and humor.
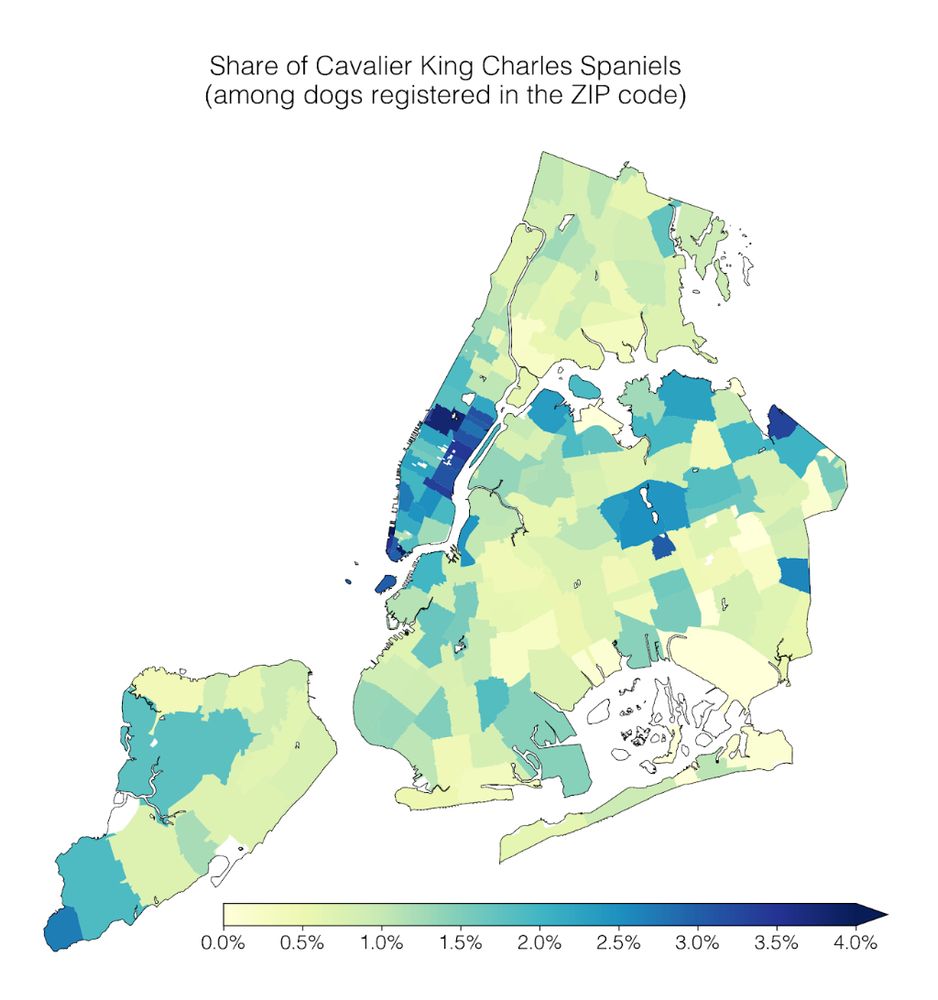
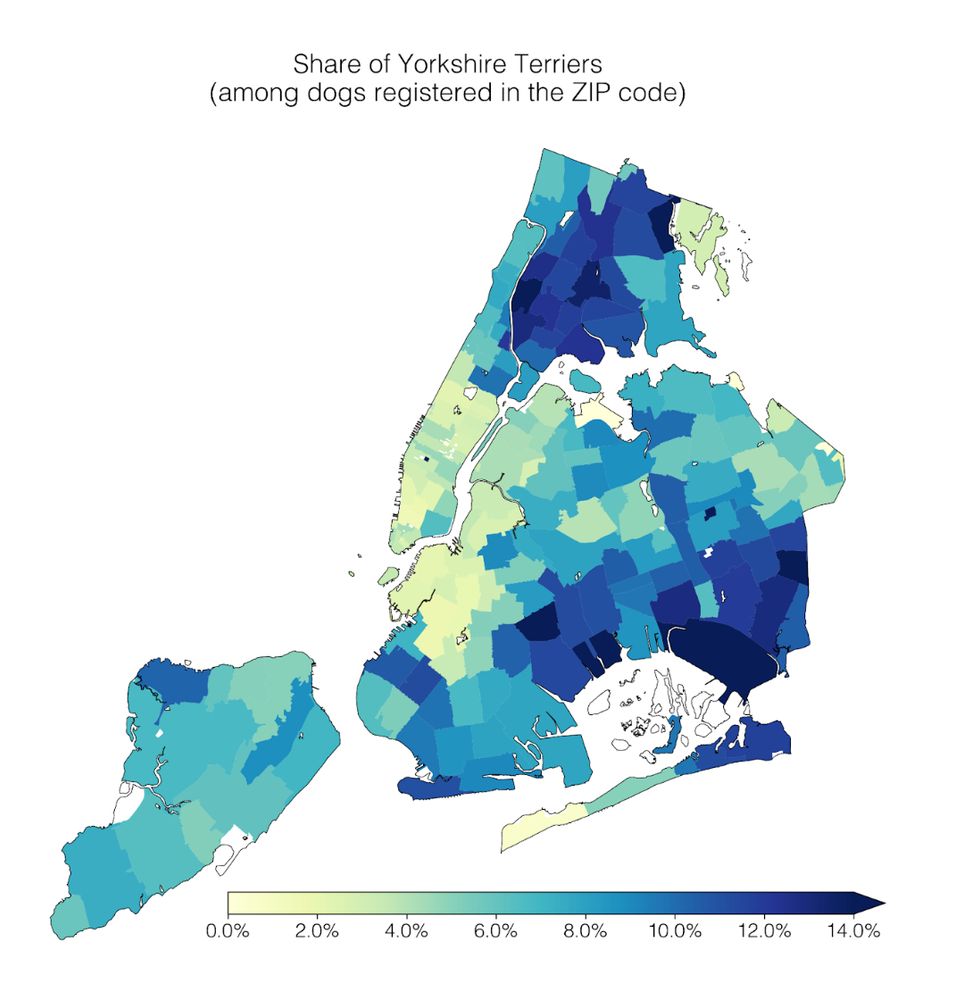
I became a dog scientist on April 1st. Now back to normal (a cat scientist).

Our lab had a #dogathon 🐕 yesterday where we analyzed NYC Open Data on dog licenses. We learned a lot of dog facts, which I’ll share in this thread 🧵
1) Geospatial trends: Cavalier King Charles Spaniels are common in Manhattan; the opposite is true for Yorkshire Terriers.
1) Geospatial trends: Cavalier King Charles Spaniels are common in Manhattan; the opposite is true for Yorkshire Terriers.
April 2, 2025 at 2:24 PM
I became a dog scientist on April 1st. Now back to normal (a cat scientist).
Migration data lets us study responses to environmental disasters, social change patterns, policy impacts, etc. But public data is too coarse, obscuring these important phenomena!
We build MIGRATE: a dataset of yearly flows between 47 billion pairs of US Census Block Groups. 1/5
We build MIGRATE: a dataset of yearly flows between 47 billion pairs of US Census Block Groups. 1/5
March 28, 2025 at 3:25 PM
Migration data lets us study responses to environmental disasters, social change patterns, policy impacts, etc. But public data is too coarse, obscuring these important phenomena!
We build MIGRATE: a dataset of yearly flows between 47 billion pairs of US Census Block Groups. 1/5
We build MIGRATE: a dataset of yearly flows between 47 billion pairs of US Census Block Groups. 1/5
Reposted by Gabriel Agostini

💡New preprint & Python package: We use sparse autoencoders to generate hypotheses from large text datasets.
Our method, HypotheSAEs, produces interpretable text features that predict a target variable, e.g. features in news headlines that predict engagement. 🧵1/
Our method, HypotheSAEs, produces interpretable text features that predict a target variable, e.g. features in news headlines that predict engagement. 🧵1/
March 18, 2025 at 3:17 PM
💡New preprint & Python package: We use sparse autoencoders to generate hypotheses from large text datasets.
Our method, HypotheSAEs, produces interpretable text features that predict a target variable, e.g. features in news headlines that predict engagement. 🧵1/
Our method, HypotheSAEs, produces interpretable text features that predict a target variable, e.g. features in news headlines that predict engagement. 🧵1/