


Steven Sowden
@climateactuary.bsky.social
Actuary helping investors control risk through modelling and sustainability.
@higheredactuary.bsky.social Leeds and climate = your kind of Venn diagram.

Researchers in Leeds have joined experts from across the world in warning that Earth is reaching the first of many climate tipping points that will cause catastrophic harm without urgent action.
#climatecrisis #tippingpoint #auspol www.leeds.ac.uk/news/article...
#climatecrisis #tippingpoint #auspol www.leeds.ac.uk/news/article...

‘New reality’ as world reaches first climate tipping point
Researchers in Leeds have joined experts from across the world in warning that Earth is reaching the first of many climate tipping points that will cause catastrophic harm without urgent action.
www.leeds.ac.uk
October 13, 2025 at 6:59 PM
@higheredactuary.bsky.social Leeds and climate = your kind of Venn diagram.
My thinking hasn’t evolved much in the last 5 months.
Is it over the top to say, “investment decisions are starting to look like betting on whether or not USA will descend into a dictatorship”? Crazy times!
September 23, 2025 at 4:53 PM
My thinking hasn’t evolved much in the last 5 months.
Reposted by Steven Sowden

Put your virtual hand up (and pass it on) if you’d be personally happy to PAY MORE TAXES so we could have better public services, fewer benefit cuts and faster progress on climate change.
I’ll start…
I’ll start…

a cartoon minion is standing in the snow and waving .
ALT: a cartoon minion is standing in the snow and waving .
media.tenor.com
March 14, 2025 at 2:14 PM
Put your virtual hand up (and pass it on) if you’d be personally happy to PAY MORE TAXES so we could have better public services, fewer benefit cuts and faster progress on climate change.
I’ll start…
I’ll start…
A beautiful thing…
This is probably the nicest little EV charger I have seen. Doesn't take any space away from pedestrians, no trip hazard. Very good.
theevreport.com/rheinmetall-...
theevreport.com/rheinmetall-...

Rheinmetall Curb Charger Wins Design Award
Technology corporation Rheinmetall has received a prestigious award at the 2025 Red Dot Design Awards. The company's innovative curb charger was honored
theevreport.com
July 15, 2025 at 7:51 AM
A beautiful thing…
Reposted by Steven Sowden

I don’t think anyone is prepared for what they just did w/ ICE.
This is not a simple budget increase. It is an explosion - making ICE bigger than the FBI, US Bureau of Prisons, DEA,& others combined.
It is setting up to make what’s happening now look like child’s play. And people are disappearing.
This is not a simple budget increase. It is an explosion - making ICE bigger than the FBI, US Bureau of Prisons, DEA,& others combined.
It is setting up to make what’s happening now look like child’s play. And people are disappearing.
July 3, 2025 at 6:58 PM
I don’t think anyone is prepared for what they just did w/ ICE.
This is not a simple budget increase. It is an explosion - making ICE bigger than the FBI, US Bureau of Prisons, DEA,& others combined.
It is setting up to make what’s happening now look like child’s play. And people are disappearing.
This is not a simple budget increase. It is an explosion - making ICE bigger than the FBI, US Bureau of Prisons, DEA,& others combined.
It is setting up to make what’s happening now look like child’s play. And people are disappearing.
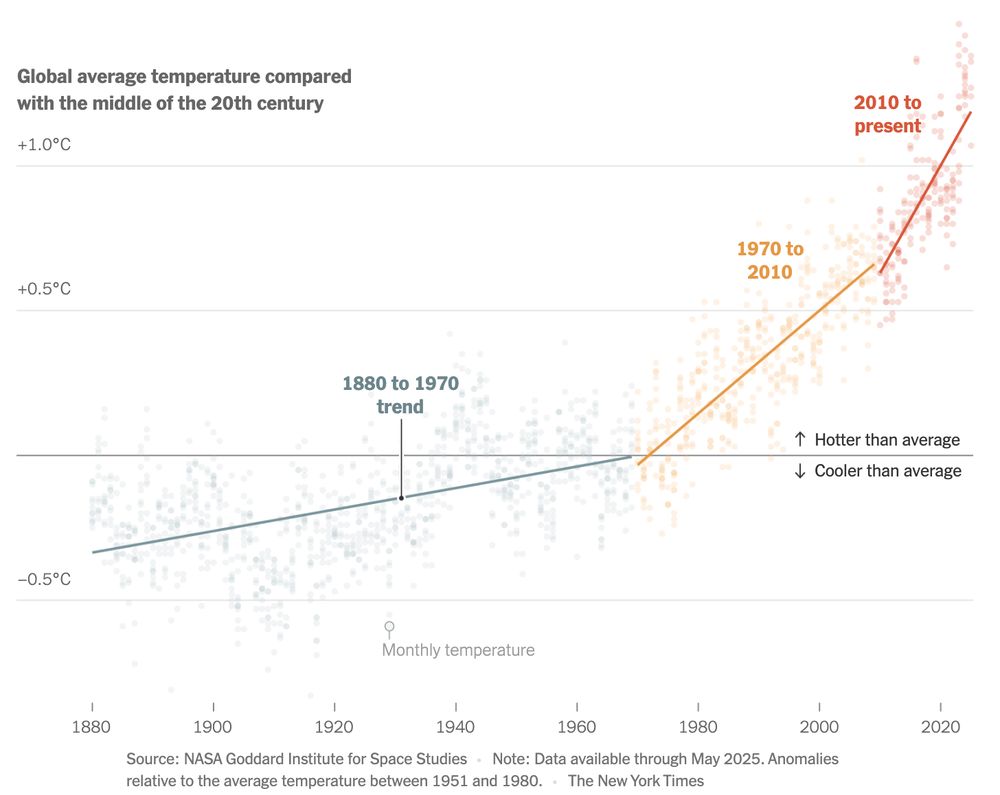
A frightening acceleration… consideration of physical risk will become more and more important.

Great piece in today's NYTimes on the recent acceleration of global warming (and its impacts), featuring comments from Kate Marvel, Daniel Swain, Cecilia Bitz, and me: www.nytimes.com/2025...
June 26, 2025 at 7:03 PM
A frightening acceleration… consideration of physical risk will become more and more important.
It is, unfortunately, time to move away from testing scenarios that limit warming to 1.5c they are no longer feasible.
Every fraction of a degree matters.
Every fraction of a degree matters.
Our new paper updating key metrics in the IPCC is now out, and the news is grim:
⬆️ Human induced warming now at 1.36C
⬆️ Rate of warming now 0.27C / decade
⬆️ Sharp increase in Earth's energy imbalance
⬇️ Remaining 1.5C carbon budget only 130 GtCO2
essd.copernicus.org/...
⬆️ Human induced warming now at 1.36C
⬆️ Rate of warming now 0.27C / decade
⬆️ Sharp increase in Earth's energy imbalance
⬇️ Remaining 1.5C carbon budget only 130 GtCO2
essd.copernicus.org/...
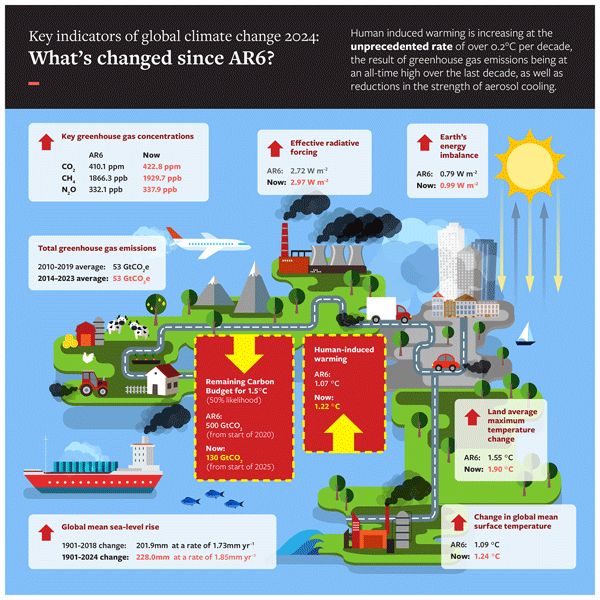
Indicators of Global Climate Change 2024: annual update of key indicators of the state of the climate system and human influence
Abstract. In a rapidly changing climate, evidence-based decision-making benefits from up-to-date and timely information. Here we compile monitoring datasets (published at https://doi.org/10.5281/zenodo.15639576; Smith et al., 2025a) to produce updated estimates for key indicators of the state of the climate system: net emissions of greenhouse gases and short-lived climate forcers, greenhouse gas concentrations, radiative forcing, the Earth's energy imbalance, surface temperature changes, warming attributed to human activities, the remaining carbon budget, and estimates of global temperature extremes. This year, we additionally include indicators for sea-level rise and land precipitation change. We follow methods as closely as possible to those used in the IPCC Sixth Assessment Report (AR6) Working Group One report. The indicators show that human activities are increasing the Earth's energy imbalance and driving faster sea-level rise compared to the AR6 assessment. For the 2015–2024 decade average, observed warming relative to 1850–1900 was 1.24 [1.11 to 1.35] °C, of which 1.22 [1.0 to 1.5] °C was human-induced. The 2024-observed best estimate of global surface temperature (1.52 °C) is well above the best estimate of human-caused warming (1.36 °C). However, the 2024 observed warming can still be regarded as a typical year, considering the human-induced warming level and the state of internal variability associated with the phase of El Niño and Atlantic variability. Human-induced warming has been increasing at a rate that is unprecedented in the instrumental record, reaching 0.27 [0.2–0.4] °C per decade over 2015–2024. This high rate of warming is caused by a combination of greenhouse gas emissions being at an all-time high of 53.6±5.2 Gt CO2e yr−1 over the last decade (2014–2023), as well as reductions in the strength of aerosol cooling. Despite this, there is evidence that the rate of increase in CO2 emissions over the last decade has slowed compared to the 2000s, and depending on societal choices, a continued series of these annual updates over the critical 2020s decade could track decreases or increases in the rate of the climatic changes presented here.
essd.copernicus.org
June 19, 2025 at 8:01 AM
It is, unfortunately, time to move away from testing scenarios that limit warming to 1.5c they are no longer feasible.
Every fraction of a degree matters.
Every fraction of a degree matters.
Reposted by Steven Sowden
The climate crisis will magnify water shortage and wars over water may well become more likely. This is a very difficult thing to capture in climate scenarios.
www.ft.com/content/1edf...
www.ft.com/content/1edf...

Water or blood: tensions grow over India and Pakistan’s shared rivers
Islamabad warns that interrupting water flow after New Delhi’s suspension of Indus treaty would be ‘act of war’
www.ft.com
May 9, 2025 at 8:13 AM
The climate crisis will magnify water shortage and wars over water may well become more likely. This is a very difficult thing to capture in climate scenarios.
www.ft.com/content/1edf...
www.ft.com/content/1edf...
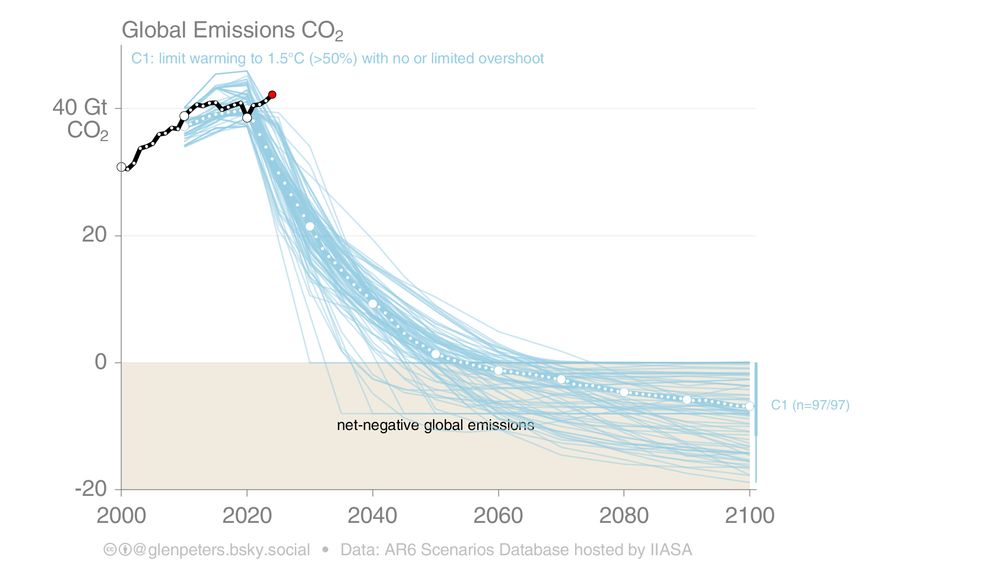
A truly great thread comparing actual emissions to scenarios consistent with different levels of warming.
Keeping warming below 1.5c is virtually an impossible scenario. But every fraction of a degree matters.
Keeping warming below 1.5c is virtually an impossible scenario. But every fraction of a degree matters.
Just your regular reminder of where global CO2 emissions are tracking compared to scenarios that keep warming to below 1.5C in 2100, with "no or low overshoot" (maximum temperature around 1.6C).
journals.sagepub.com/doi/full/10....
C1/
journals.sagepub.com/doi/full/10....
C1/
April 27, 2025 at 11:57 AM
A truly great thread comparing actual emissions to scenarios consistent with different levels of warming.
Keeping warming below 1.5c is virtually an impossible scenario. But every fraction of a degree matters.
Keeping warming below 1.5c is virtually an impossible scenario. But every fraction of a degree matters.
A really interesting chart… I had always thought India was a place most at risk of heat stress.

India stands out as an area of land that hasn't warmed as much as other parts of the globe. Why? Possible explanations include air pollution, irrigation, changing winds. So far the jury appears to be out.
www.science.org/content/arti...
www.science.org/content/arti...

April 9, 2025 at 7:51 AM
A really interesting chart… I had always thought India was a place most at risk of heat stress.
Is it over the top to say, “investment decisions are starting to look like betting on whether or not USA will descend into a dictatorship”? Crazy times!
April 7, 2025 at 8:01 AM
Is it over the top to say, “investment decisions are starting to look like betting on whether or not USA will descend into a dictatorship”? Crazy times!
The best thing Mike Myers has done since Austin Powers 2.
March 23, 2025 at 9:23 AM
The best thing Mike Myers has done since Austin Powers 2.
Reposted by Steven Sowden

Today’s Daily Cartoon, by Jason Adam Katzenstein. #NewYorkerCartoons

March 8, 2025 at 1:46 AM
Today’s Daily Cartoon, by Jason Adam Katzenstein. #NewYorkerCartoons
@higheredactuary.bsky.social pensions + history + maps. This is your kind of Venn diagram.

When I see maps of LGPS pool membership, mind always turns to Anglo-Saxon splits. www.ft.com/content/51aa...

March 4, 2025 at 4:46 PM
@higheredactuary.bsky.social pensions + history + maps. This is your kind of Venn diagram.
Yes. I do need to get a different car! Peugeot e-5008 is the current favourite.

#BlueskyResistance #Voices4Victory #ProudBlur
Advertisement at a London bus stop. Ya gotta love the British…
Advertisement at a London bus stop. Ya gotta love the British…
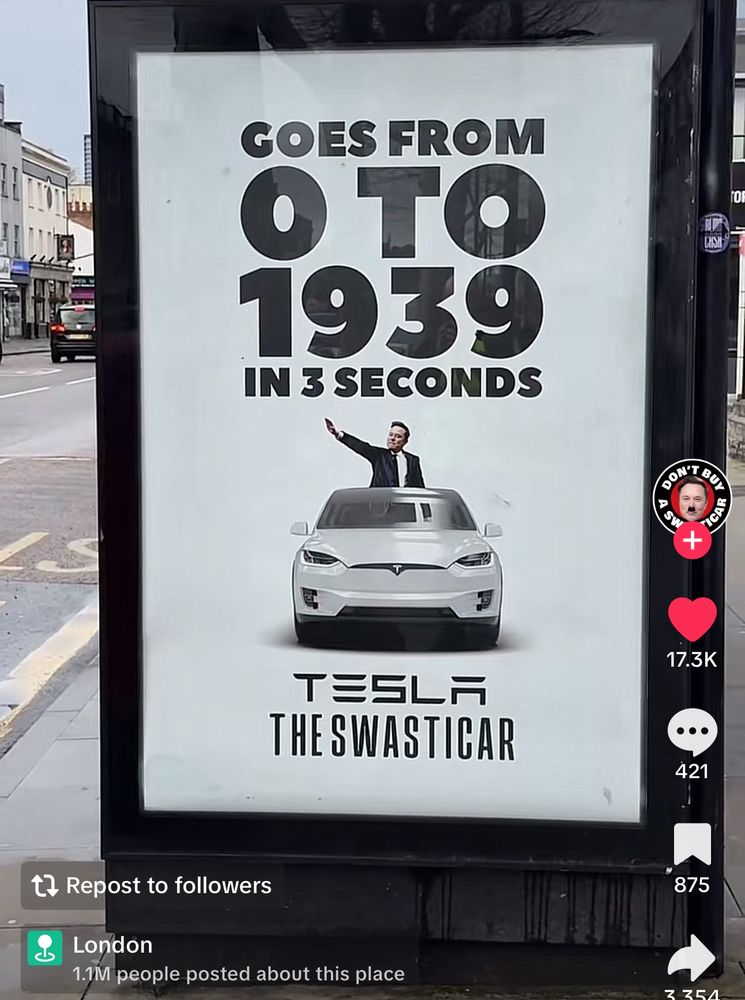
February 26, 2025 at 8:08 AM
Yes. I do need to get a different car! Peugeot e-5008 is the current favourite.
Reposted by Steven Sowden

What would happen if key ocean currents that bring warm water from the tropics to the North Atlantic collapse?
Temperatures in northern Europe would drop drastically, studies suggest.
Our full story on the risks of AMOC collapse:
www.bbc.com/news/article...
Temperatures in northern Europe would drop drastically, studies suggest.
Our full story on the risks of AMOC collapse:
www.bbc.com/news/article...

February 1, 2025 at 10:08 AM
What would happen if key ocean currents that bring warm water from the tropics to the North Atlantic collapse?
Temperatures in northern Europe would drop drastically, studies suggest.
Our full story on the risks of AMOC collapse:
www.bbc.com/news/article...
Temperatures in northern Europe would drop drastically, studies suggest.
Our full story on the risks of AMOC collapse:
www.bbc.com/news/article...
Thanks for sharing Mike. It made me think I will differentiate between the “tipping element” (the thing that will tip) and the “tipping point” (the point - eg temperature- at which it will tip).
In a new interdisciplinary Nature Climate Change Perspective paper, led by me, @lisgilmore and Rachael Shwom, we offer a critical perspective on #climate and social “tipping points.” 🎁: rdcu.be/d2gBC 🧵
December 14, 2024 at 2:27 PM
Thanks for sharing Mike. It made me think I will differentiate between the “tipping element” (the thing that will tip) and the “tipping point” (the point - eg temperature- at which it will tip).
Reposted by Steven Sowden
Neoliberalism is assessing climate change primarily through its effects on asset prices and insurance premiums.
December 10, 2024 at 7:15 PM
Neoliberalism is assessing climate change primarily through its effects on asset prices and insurance premiums.
“Insurance crisis” is an important climate scenario to consider when assessing risk.

The DeSantis administration has little choice, other than prop up the illusion that you can live in much of Florida with acceptable risk. Otherwise, the state begins to dramatic decline as people flee and see his leadership for what it truly is.

December 4, 2024 at 8:53 AM
“Insurance crisis” is an important climate scenario to consider when assessing risk.
@catclimate.bsky.social November update increases the centre of the optimistic range to 1.9c. 1.5c is retained in the optimistic range but it can’t be long before even optimism squared can’t get us there.

December 3, 2024 at 6:23 PM
@catclimate.bsky.social November update increases the centre of the optimistic range to 1.9c. 1.5c is retained in the optimistic range but it can’t be long before even optimism squared can’t get us there.
It is nice to a less negative post on AMOC collapse. I admit I was mapping Newcastle to Labrador and getting scared…
December 3, 2024 at 8:01 AM
It is nice to a less negative post on AMOC collapse. I admit I was mapping Newcastle to Labrador and getting scared…
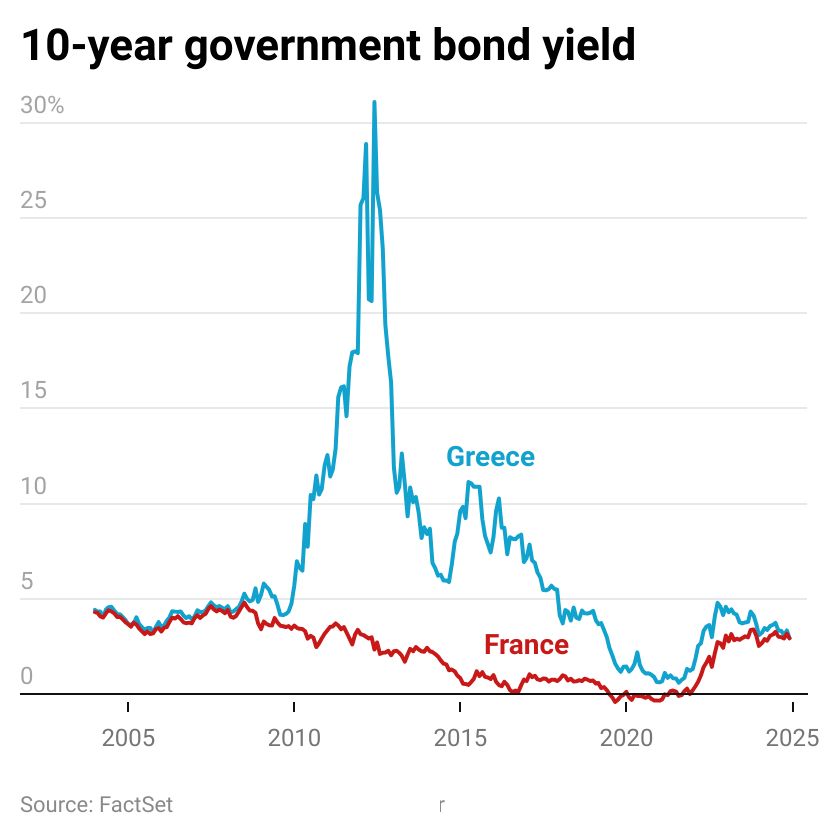
A mind blowing chart for those of us who are fans of treasury bond yields…
December 2, 2024 at 10:17 AM
A mind blowing chart for those of us who are fans of treasury bond yields…
“75% of agricultural land use is for animal grazing and animal feed” decarbonisation requires a change in land use which requires a change in diet.
Overall, the global food system does more damage to the planet than anything else we do, even burning fossil fuels.
drawdown.org/insights/how...
drawdown.org/insights/how...

How food and farming will determine the fate of planet Earth
Agriculture has disrupted the planet more than anything we have ever done, including burning fossil fuels. A sustainable future depends on recognizing this fact – and radically changing how we farm an...
drawdown.org
November 28, 2024 at 5:13 PM
“75% of agricultural land use is for animal grazing and animal feed” decarbonisation requires a change in land use which requires a change in diet.