


Cédric Scherer
@cedricscherer.com
🧙♂️✨📊
Independent Data Visualization Designer, Consultant & Instructor | available for projects and workshops
All things data & design with #rstats, #ggplot2, #Figma, #DataWrapper, #Flourish, and more
Co-Founder of the #30DayChartChallenge
Independent Data Visualization Designer, Consultant & Instructor | available for projects and workshops
All things data & design with #rstats, #ggplot2, #Figma, #DataWrapper, #Flourish, and more
Co-Founder of the #30DayChartChallenge
Pinned
Cédric Scherer
@cedricscherer.com
· May 12
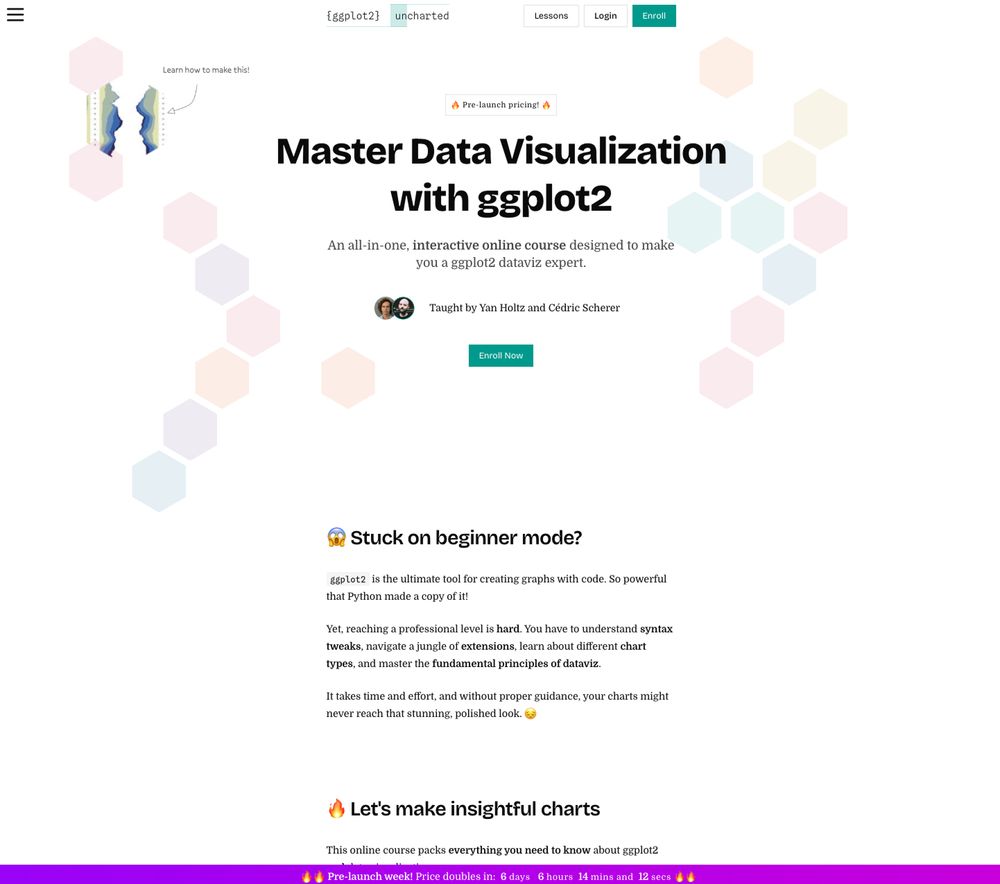
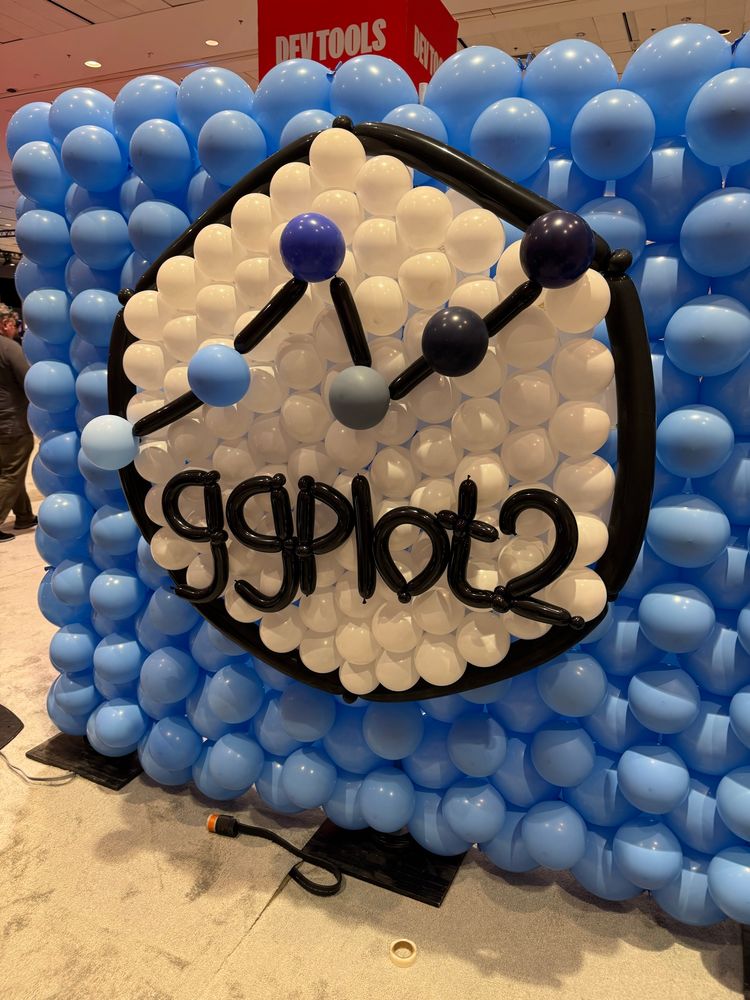
Excited to launch "ggplot2 [un]charted" with @yan-holtz.bsky.social! 🎉
An online course to master #ggplot2 with exercises, quizzes, and modules—and hands-on code running in your browser!
Still WIP—sign up now for a limited discount:
👉 www.ggplot2-uncharted.com
#rstats #DataViz #DataVisualization
An online course to master #ggplot2 with exercises, quizzes, and modules—and hands-on code running in your browser!
Still WIP—sign up now for a limited discount:
👉 www.ggplot2-uncharted.com
#rstats #DataViz #DataVisualization
🦧📉 Why are there colorful apes in my #dataviz workshops?
📸 The photo taken years ago by my friend Richard Strozynski has become a tradition in my client projects and courses.
I like to recolor it with different palettes to show how palette design affects perception.
Thread 👇
📸 The photo taken years ago by my friend Richard Strozynski has become a tradition in my client projects and courses.
I like to recolor it with different palettes to show how palette design affects perception.
Thread 👇

October 28, 2025 at 4:32 PM
🦧📉 Why are there colorful apes in my #dataviz workshops?
📸 The photo taken years ago by my friend Richard Strozynski has become a tradition in my client projects and courses.
I like to recolor it with different palettes to show how palette design affects perception.
Thread 👇
📸 The photo taken years ago by my friend Richard Strozynski has become a tradition in my client projects and courses.
I like to recolor it with different palettes to show how palette design affects perception.
Thread 👇
Code now available here! #Rstats #ggplot2
gist.github.com/z3tt/4296835...
(uses our 2022 data from the course for convenience though to avoid data handling and wrangling)
gist.github.com/z3tt/4296835...
(uses our 2022 data from the course for convenience though to avoid data handling and wrangling)
October 23, 2025 at 12:36 PM
Code now available here! #Rstats #ggplot2
gist.github.com/z3tt/4296835...
(uses our 2022 data from the course for convenience though to avoid data handling and wrangling)
gist.github.com/z3tt/4296835...
(uses our 2022 data from the course for convenience though to avoid data handling and wrangling)
🌏 A compact snapshot on where people live around the globe (2023 data) — over 60% of #humans live in #Asia!
I originally created a more basic version for our new #ggplot2 [un]charted lesson on 🎨 "Color Choice" to discuss color accessibility:
👉 www.ggplot2-uncharted.com/module2/colo...
I originally created a more basic version for our new #ggplot2 [un]charted lesson on 🎨 "Color Choice" to discuss color accessibility:
👉 www.ggplot2-uncharted.com/module2/colo...

October 22, 2025 at 3:56 PM
🌏 A compact snapshot on where people live around the globe (2023 data) — over 60% of #humans live in #Asia!
I originally created a more basic version for our new #ggplot2 [un]charted lesson on 🎨 "Color Choice" to discuss color accessibility:
👉 www.ggplot2-uncharted.com/module2/colo...
I originally created a more basic version for our new #ggplot2 [un]charted lesson on 🎨 "Color Choice" to discuss color accessibility:
👉 www.ggplot2-uncharted.com/module2/colo...
📸 Fun photoshoot yesterday!
Finally updating the profile pic and those “hard at work” photos.
Behind-the-scenes outtake: new office, new favorite mug, new kitten… and me, mid-shrug, wondering how people do this gracefully 😄🤷
Finally updating the profile pic and those “hard at work” photos.
Behind-the-scenes outtake: new office, new favorite mug, new kitten… and me, mid-shrug, wondering how people do this gracefully 😄🤷

October 17, 2025 at 12:43 PM
📸 Fun photoshoot yesterday!
Finally updating the profile pic and those “hard at work” photos.
Behind-the-scenes outtake: new office, new favorite mug, new kitten… and me, mid-shrug, wondering how people do this gracefully 😄🤷
Finally updating the profile pic and those “hard at work” photos.
Behind-the-scenes outtake: new office, new favorite mug, new kitten… and me, mid-shrug, wondering how people do this gracefully 😄🤷
Reposted by Cédric Scherer

Great video with @tanyashapiro.bsky.social and @cedricscherer.com walking us though using {ggiraph}. Plus, there's a plot with some #DrWho data :-)
#data #Rstats #code
www.youtube.com/watch?v=GnDj...
#data #Rstats #code
www.youtube.com/watch?v=GnDj...

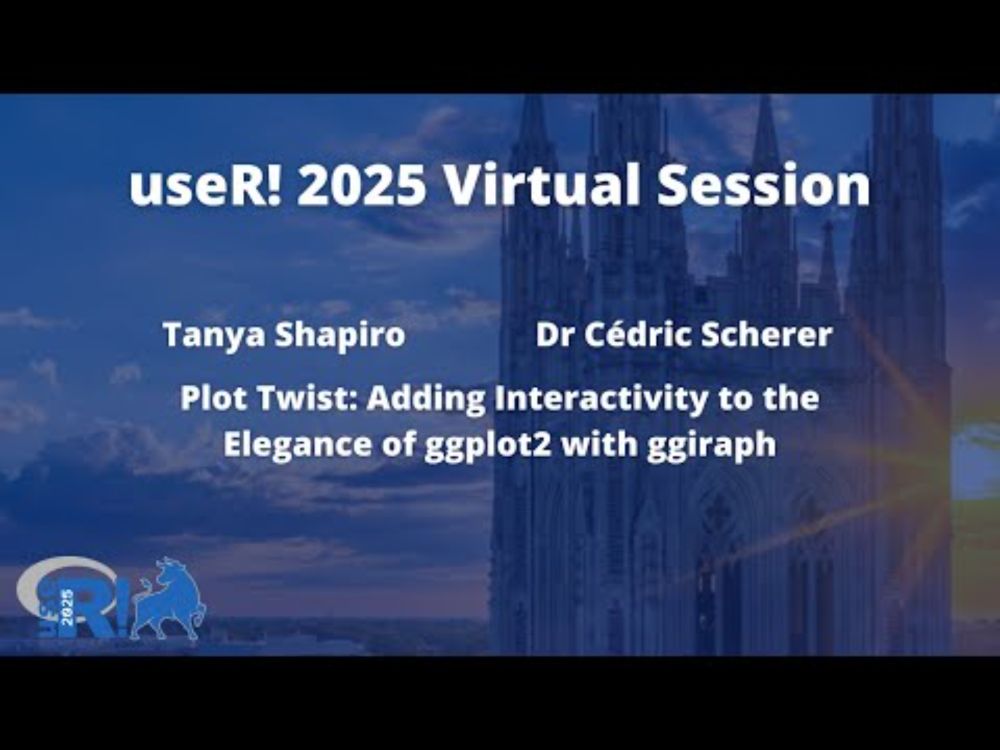
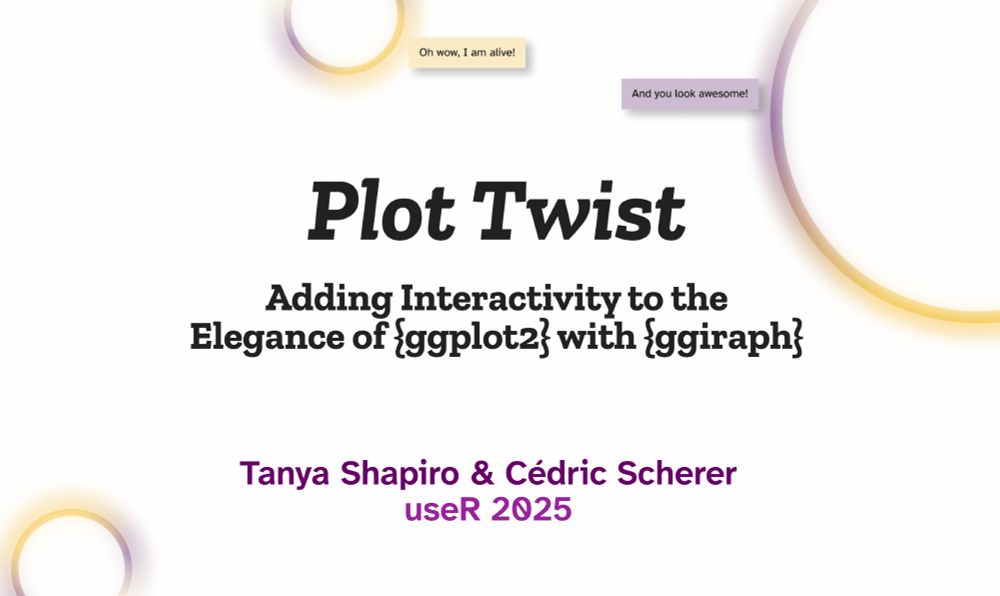
Plot Twist: Adding Interactivity to the Elegance of ggplot2 with ggiraph
YouTube video by useR! Conference
www.youtube.com
August 28, 2025 at 12:01 PM
Great video with @tanyashapiro.bsky.social and @cedricscherer.com walking us though using {ggiraph}. Plus, there's a plot with some #DrWho data :-)
#data #Rstats #code
www.youtube.com/watch?v=GnDj...
#data #Rstats #code
www.youtube.com/watch?v=GnDj...
Chart crimes are everywhere. I ate it.

August 18, 2025 at 8:46 AM
Chart crimes are everywhere. I ate it.
Reposted by Cédric Scherer

I have a slide about an unusual data request I once got: can we show that song choruses are appearing earlier due to the economics of streaming (gotta hook people in early to get paid)? I joked that it's not as if anyone's got a database of song structures. But it turns out that someone has...

August 17, 2025 at 1:37 PM
I have a slide about an unusual data request I once got: can we show that song choruses are appearing earlier due to the economics of streaming (gotta hook people in early to get paid)? I joked that it's not as if anyone's got a database of song structures. But it turns out that someone has...
Reposted by Cédric Scherer

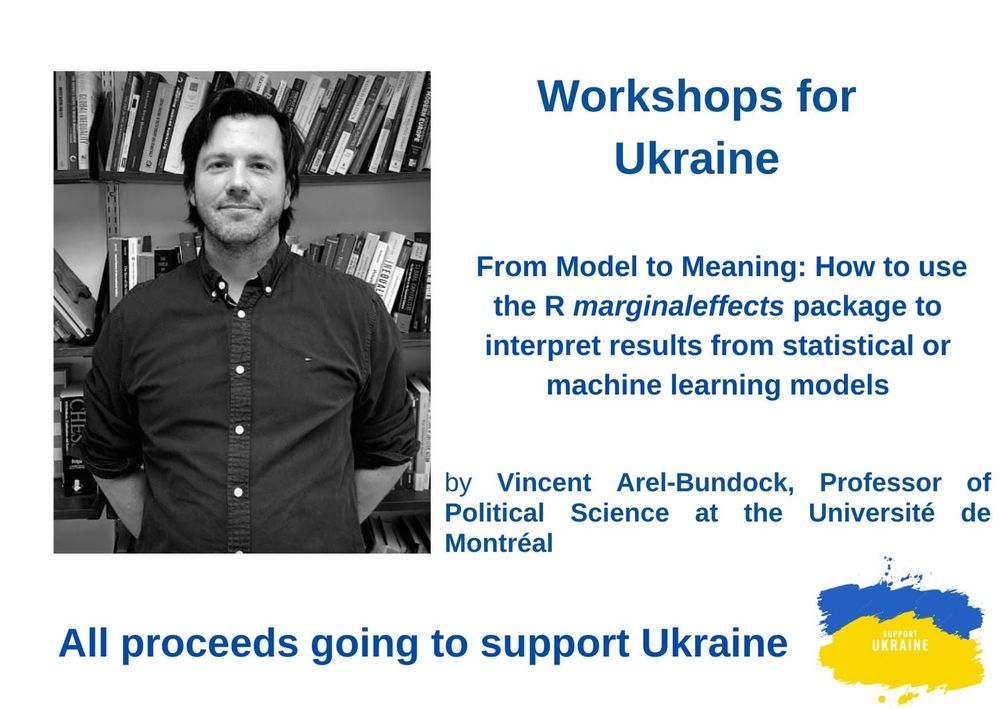
❗️Our next workshop will be on August 14, 6 pm CEST, on marginaleffects package by
@vincentab.bsky.social !
Register or sponsor a student by donating to support Ukraine!
Details: bit.ly/3wBeY4S
Please share! #AcademicSky #EconSky #RStats
@vincentab.bsky.social !
Register or sponsor a student by donating to support Ukraine!
Details: bit.ly/3wBeY4S
Please share! #AcademicSky #EconSky #RStats
August 2, 2025 at 12:08 PM
❗️Our next workshop will be on August 14, 6 pm CEST, on marginaleffects package by
@vincentab.bsky.social !
Register or sponsor a student by donating to support Ukraine!
Details: bit.ly/3wBeY4S
Please share! #AcademicSky #EconSky #RStats
@vincentab.bsky.social !
Register or sponsor a student by donating to support Ukraine!
Details: bit.ly/3wBeY4S
Please share! #AcademicSky #EconSky #RStats
Reposted by Cédric Scherer
Did you know, that brown bears can make entire countries happier?
For statistical evidence of that fact, see the animation below
#rstats #ggplot #statistics #correlation #causation #Rprogramming #TidyTuesday #DataViz #RStudio
(this is of course meant to be humoristic)
🧵
For statistical evidence of that fact, see the animation below
#rstats #ggplot #statistics #correlation #causation #Rprogramming #TidyTuesday #DataViz #RStudio
(this is of course meant to be humoristic)
🧵
July 8, 2025 at 7:33 PM
Did you know, that brown bears can make entire countries happier?
For statistical evidence of that fact, see the animation below
#rstats #ggplot #statistics #correlation #causation #Rprogramming #TidyTuesday #DataViz #RStudio
(this is of course meant to be humoristic)
🧵
For statistical evidence of that fact, see the animation below
#rstats #ggplot #statistics #correlation #causation #Rprogramming #TidyTuesday #DataViz #RStudio
(this is of course meant to be humoristic)
🧵
Reposted by Cédric Scherer
New presentation just posted at today's @user-conf.bsky.social virtual conference: Plot Twist: Adding Interactivity to the Elegance of ggplot2 with ggiraph
By @tanyashapiro.bsky.social & @cedricscherer.com
Video www.youtube.com/watch?v=GnDj...
#RStats #DataViz #ggplot2 #user2025
By @tanyashapiro.bsky.social & @cedricscherer.com
Video www.youtube.com/watch?v=GnDj...
#RStats #DataViz #ggplot2 #user2025
Plot Twist: Adding Interactivity to the Elegance of ggplot2 with ggiraph
YouTube video by useR! Conference
www.youtube.com
August 1, 2025 at 4:33 PM
New presentation just posted at today's @user-conf.bsky.social virtual conference: Plot Twist: Adding Interactivity to the Elegance of ggplot2 with ggiraph
By @tanyashapiro.bsky.social & @cedricscherer.com
Video www.youtube.com/watch?v=GnDj...
#RStats #DataViz #ggplot2 #user2025
By @tanyashapiro.bsky.social & @cedricscherer.com
Video www.youtube.com/watch?v=GnDj...
#RStats #DataViz #ggplot2 #user2025
Reposted by Cédric Scherer

Today's front page is a nod towards the US president's upcoming visit to Scotland 👀👇

The National's front page as Donald Trump set to arrive in Scotland
www.thenational.scot
July 25, 2025 at 10:52 AM
Today's front page is a nod towards the US president's upcoming visit to Scotland 👀👇
July 25, 2025 at 11:37 AM
Last week, I crafted my first-ever gauge chart 🏎️ to showcase partial radial plots for our #ggplot2 [un]charted lesson on "coordinate systems"
Thanks to coord_radial(), partial circles like those are super easy now — and of course I couldn’t resist making a polished and animated version 💅📽️ #rstats
Thanks to coord_radial(), partial circles like those are super easy now — and of course I couldn’t resist making a polished and animated version 💅📽️ #rstats
July 23, 2025 at 3:43 PM
Reposted by Cédric Scherer

ggplot + ggiraph in action ⚡
I teamed up with @cedricscherer.com to put together a fun ggiraph talk for useR conf this year. Of course I had to show an example inspired by him!
Stay tuned for behind the scenes how-tos, tricks, and code. Excited to share more info when the talk is live!
I teamed up with @cedricscherer.com to put together a fun ggiraph talk for useR conf this year. Of course I had to show an example inspired by him!
Stay tuned for behind the scenes how-tos, tricks, and code. Excited to share more info when the talk is live!
July 21, 2025 at 7:09 PM
ggplot + ggiraph in action ⚡
I teamed up with @cedricscherer.com to put together a fun ggiraph talk for useR conf this year. Of course I had to show an example inspired by him!
Stay tuned for behind the scenes how-tos, tricks, and code. Excited to share more info when the talk is live!
I teamed up with @cedricscherer.com to put together a fun ggiraph talk for useR conf this year. Of course I had to show an example inspired by him!
Stay tuned for behind the scenes how-tos, tricks, and code. Excited to share more info when the talk is live!
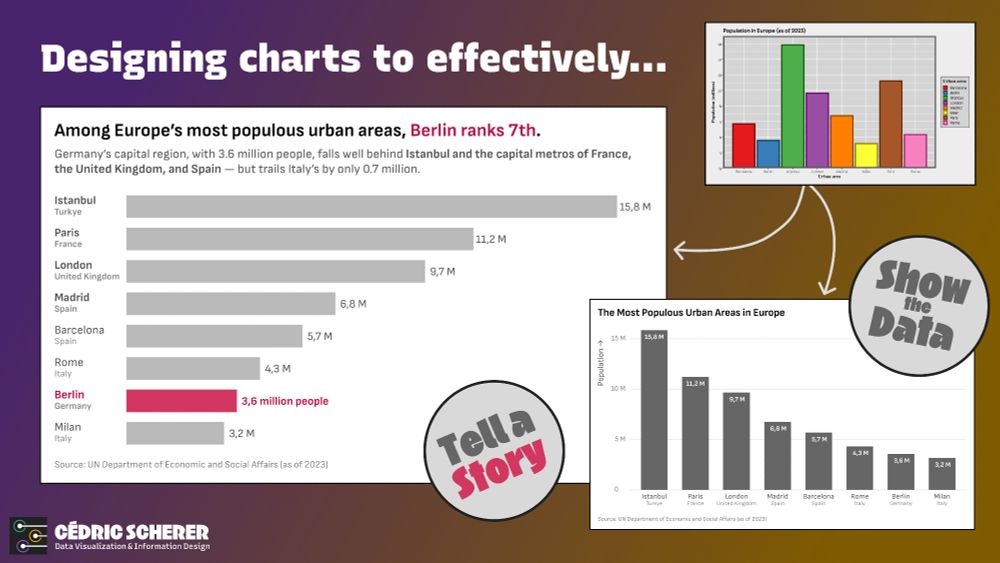
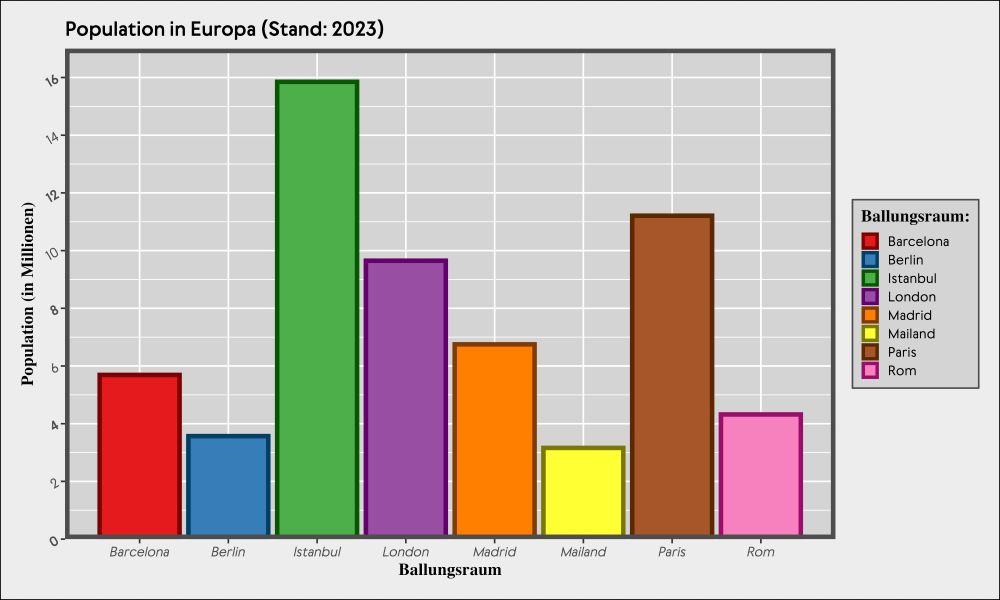
Two redesigns of the cluttered bar chart on Europe’s largest urban areas 📊
Two reworked variants — same data, different goals:
show the data vs. tell a story.
Decluttering, refocusing, adding context, and using visual emphasis can turn a chart into insight.
#dataviz #ggplot2 #rstats #tidyverse
Two reworked variants — same data, different goals:
show the data vs. tell a story.
Decluttering, refocusing, adding context, and using visual emphasis can turn a chart into insight.
#dataviz #ggplot2 #rstats #tidyverse
July 18, 2025 at 2:57 PM
Two redesigns of the cluttered bar chart on Europe’s largest urban areas 📊
Two reworked variants — same data, different goals:
show the data vs. tell a story.
Decluttering, refocusing, adding context, and using visual emphasis can turn a chart into insight.
#dataviz #ggplot2 #rstats #tidyverse
Two reworked variants — same data, different goals:
show the data vs. tell a story.
Decluttering, refocusing, adding context, and using visual emphasis can turn a chart into insight.
#dataviz #ggplot2 #rstats #tidyverse
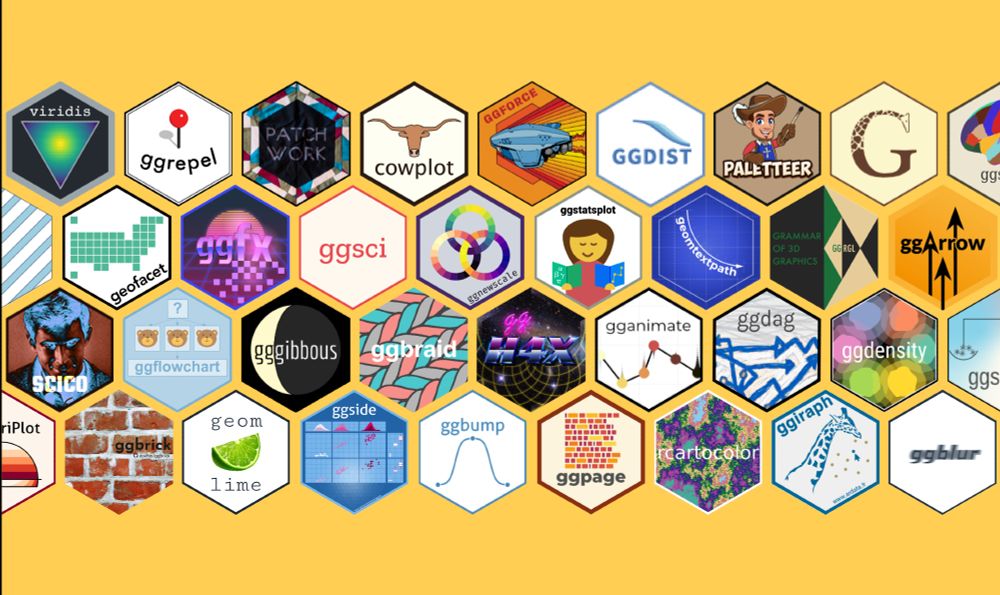
Why do we 💙 #ggplot2?
Yes, it's for the Grammar!
But also for the passionate and supportive community — and their steady contributions to the ggplot2 universe: all the extension packages 🧩 that take its impressive flexibility even further, making it more powerful and beautiful 🙌
#rstats #tidyverse
Yes, it's for the Grammar!
But also for the passionate and supportive community — and their steady contributions to the ggplot2 universe: all the extension packages 🧩 that take its impressive flexibility even further, making it more powerful and beautiful 🙌
#rstats #tidyverse
July 14, 2025 at 4:04 PM
Why do we 💙 #ggplot2?
Yes, it's for the Grammar!
But also for the passionate and supportive community — and their steady contributions to the ggplot2 universe: all the extension packages 🧩 that take its impressive flexibility even further, making it more powerful and beautiful 🙌
#rstats #tidyverse
Yes, it's for the Grammar!
But also for the passionate and supportive community — and their steady contributions to the ggplot2 universe: all the extension packages 🧩 that take its impressive flexibility even further, making it more powerful and beautiful 🙌
#rstats #tidyverse
Reposted by Cédric Scherer

July 2, 2025 at 12:54 AM
Reposted by Cédric Scherer

I gave in! After students asking for it, I now made a simple figure design checklist.
To help all scientists w/o graphic skills create clear, accessible, and truthful charts!
-> Out in @nature Cell Biology: rdcu.be/erwl4
#DataVisualization #PhD #SciComm
Thx for review @bethcimini.bsky.social + 2
To help all scientists w/o graphic skills create clear, accessible, and truthful charts!
-> Out in @nature Cell Biology: rdcu.be/erwl4
#DataVisualization #PhD #SciComm
Thx for review @bethcimini.bsky.social + 2
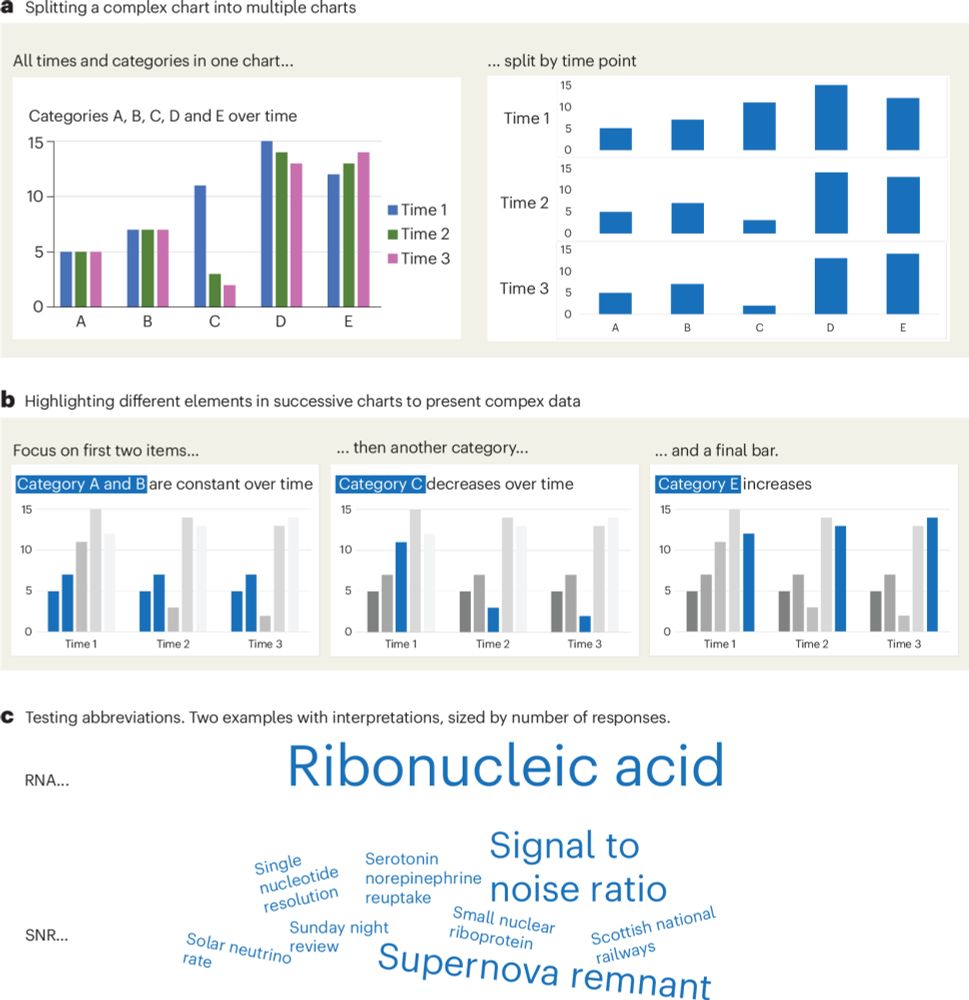
A checklist for designing and improving the visualization of scientific data
Nature Cell Biology - Creating clear and engaging scientific figures is crucial to communicate complex data. In this Comment, I condense principles from design, visual perception and data...
rdcu.be
June 18, 2025 at 8:33 AM
I gave in! After students asking for it, I now made a simple figure design checklist.
To help all scientists w/o graphic skills create clear, accessible, and truthful charts!
-> Out in @nature Cell Biology: rdcu.be/erwl4
#DataVisualization #PhD #SciComm
Thx for review @bethcimini.bsky.social + 2
To help all scientists w/o graphic skills create clear, accessible, and truthful charts!
-> Out in @nature Cell Biology: rdcu.be/erwl4
#DataVisualization #PhD #SciComm
Thx for review @bethcimini.bsky.social + 2

What a coincidence — I’ve got something called "Prep Call with Tanya" on my calendar this week 🤷♂️
On deck this month: prepping for a virtual ggplot talk with someone I’m v excited to collab with!
Going to commit myself to more speaking gigs & conferences this year.
I miss connecting with data people!
Going to commit myself to more speaking gigs & conferences this year.
I miss connecting with data people!
June 10, 2025 at 11:49 AM
What a coincidence — I’ve got something called "Prep Call with Tanya" on my calendar this week 🤷♂️
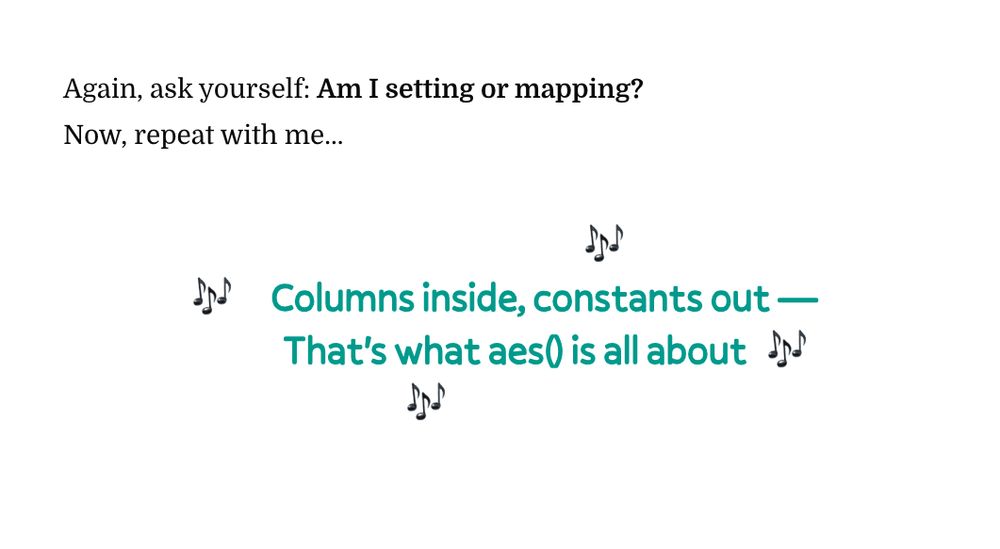
Working on the latest #ggplot2 [un]charted lesson about “Handling Caveats When Mapping Variables,” I let loose a bit
The sections ended up fun — yes, and maybe a bit silly at times 🤡
Highlight:
a new #aesthetics anthem as a memorable mnemonic 🎶
Out now for members!
www.ggplot2-uncharted.com
The sections ended up fun — yes, and maybe a bit silly at times 🤡
Highlight:
a new #aesthetics anthem as a memorable mnemonic 🎶
Out now for members!
www.ggplot2-uncharted.com
June 6, 2025 at 3:21 PM
Working on the latest #ggplot2 [un]charted lesson about “Handling Caveats When Mapping Variables,” I let loose a bit
The sections ended up fun — yes, and maybe a bit silly at times 🤡
Highlight:
a new #aesthetics anthem as a memorable mnemonic 🎶
Out now for members!
www.ggplot2-uncharted.com
The sections ended up fun — yes, and maybe a bit silly at times 🤡
Highlight:
a new #aesthetics anthem as a memorable mnemonic 🎶
Out now for members!
www.ggplot2-uncharted.com
Reposted by Cédric Scherer

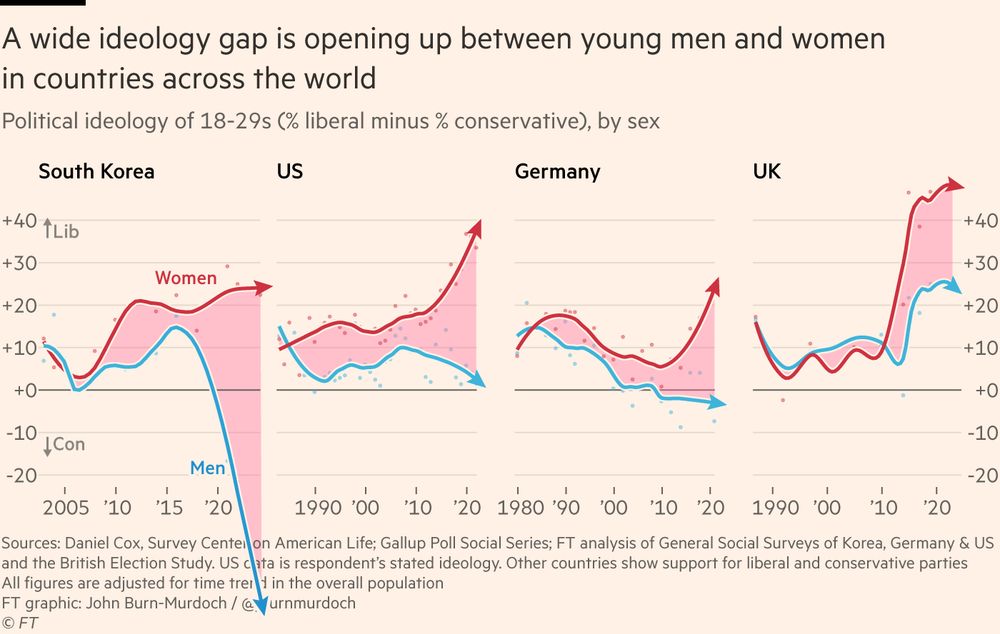
South Korea gender divide update 😲
Young men lean right by 50 points
(74% conservative vs 24% centre-left)
Young women lean left by 22 points
(58% centre-left vs 36% cons)
Young men lean right by 50 points
(74% conservative vs 24% centre-left)
Young women lean left by 22 points
(58% centre-left vs 36% cons)
June 4, 2025 at 10:01 AM
South Korea gender divide update 😲
Young men lean right by 50 points
(74% conservative vs 24% centre-left)
Young women lean left by 22 points
(58% centre-left vs 36% cons)
Young men lean right by 50 points
(74% conservative vs 24% centre-left)
Young women lean left by 22 points
(58% centre-left vs 36% cons)
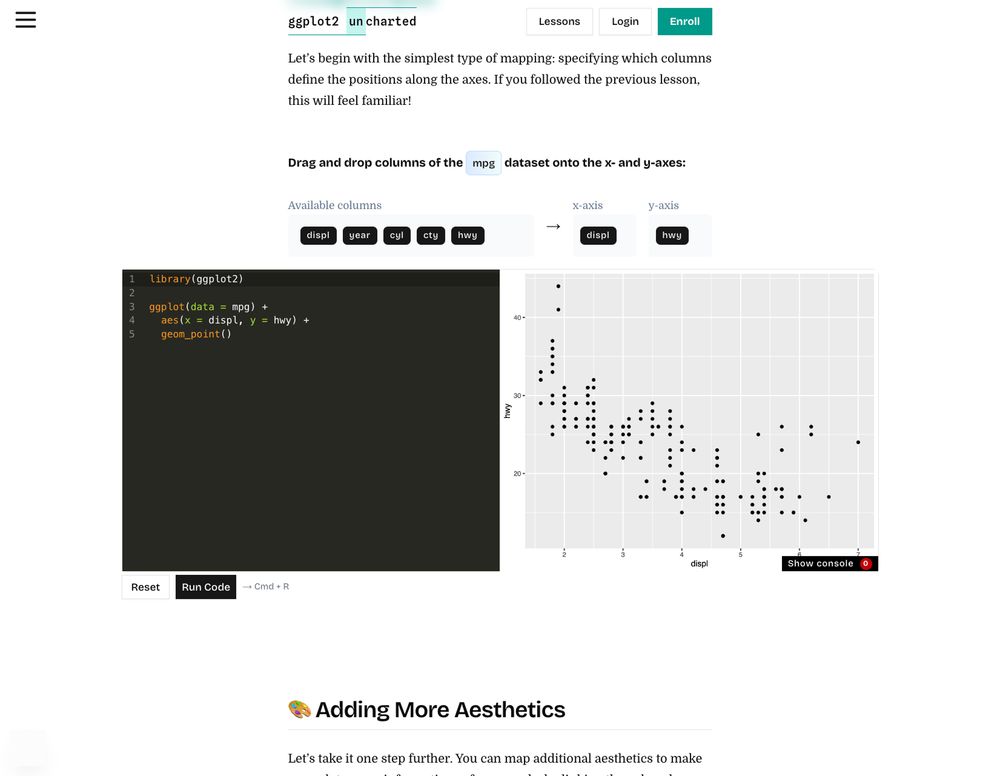
New interactive lesson live! 🎉
🎨 Aesthetics: Mapping Data to Visual Properties is now live for members of our #ggplot2 [un]charted workshop!
🎮 Drag-and-drop aes game
🔍 Aesthetics Explorer
🏆 6 exercises
Learn now 👉 ggplot2-uncharted.com/module1/aest...
#dataviz #datavis #rstats #tidyverse
🎨 Aesthetics: Mapping Data to Visual Properties is now live for members of our #ggplot2 [un]charted workshop!
🎮 Drag-and-drop aes game
🔍 Aesthetics Explorer
🏆 6 exercises
Learn now 👉 ggplot2-uncharted.com/module1/aest...
#dataviz #datavis #rstats #tidyverse
![Screenshot of the header of the third lesson in module 1, "Foundations of ggplot2", of our interactive online course ggplot2 [un]charted.](https://cdn.bsky.app/img/feed_thumbnail/plain/did:plc:p5uwbdiuszqu53dn5b52i4ic/bafkreigyqi3lnonnffhaxfpegh6spamohp6u7vpsp4ei6qxrkh2jm2wdcm@jpeg)


June 4, 2025 at 9:14 AM
New interactive lesson live! 🎉
🎨 Aesthetics: Mapping Data to Visual Properties is now live for members of our #ggplot2 [un]charted workshop!
🎮 Drag-and-drop aes game
🔍 Aesthetics Explorer
🏆 6 exercises
Learn now 👉 ggplot2-uncharted.com/module1/aest...
#dataviz #datavis #rstats #tidyverse
🎨 Aesthetics: Mapping Data to Visual Properties is now live for members of our #ggplot2 [un]charted workshop!
🎮 Drag-and-drop aes game
🔍 Aesthetics Explorer
🏆 6 exercises
Learn now 👉 ggplot2-uncharted.com/module1/aest...
#dataviz #datavis #rstats #tidyverse