


Cédric Scherer
@cedricscherer.com
🧙♂️✨📊
Independent Data Visualization Designer, Consultant & Instructor | available for projects and workshops
All things data & design with #rstats, #ggplot2, #Figma, #DataWrapper, #Flourish, and more
Co-Founder of the #30DayChartChallenge
Independent Data Visualization Designer, Consultant & Instructor | available for projects and workshops
All things data & design with #rstats, #ggplot2, #Figma, #DataWrapper, #Flourish, and more
Co-Founder of the #30DayChartChallenge
Pinned
Cédric Scherer
@cedricscherer.com
· May 12
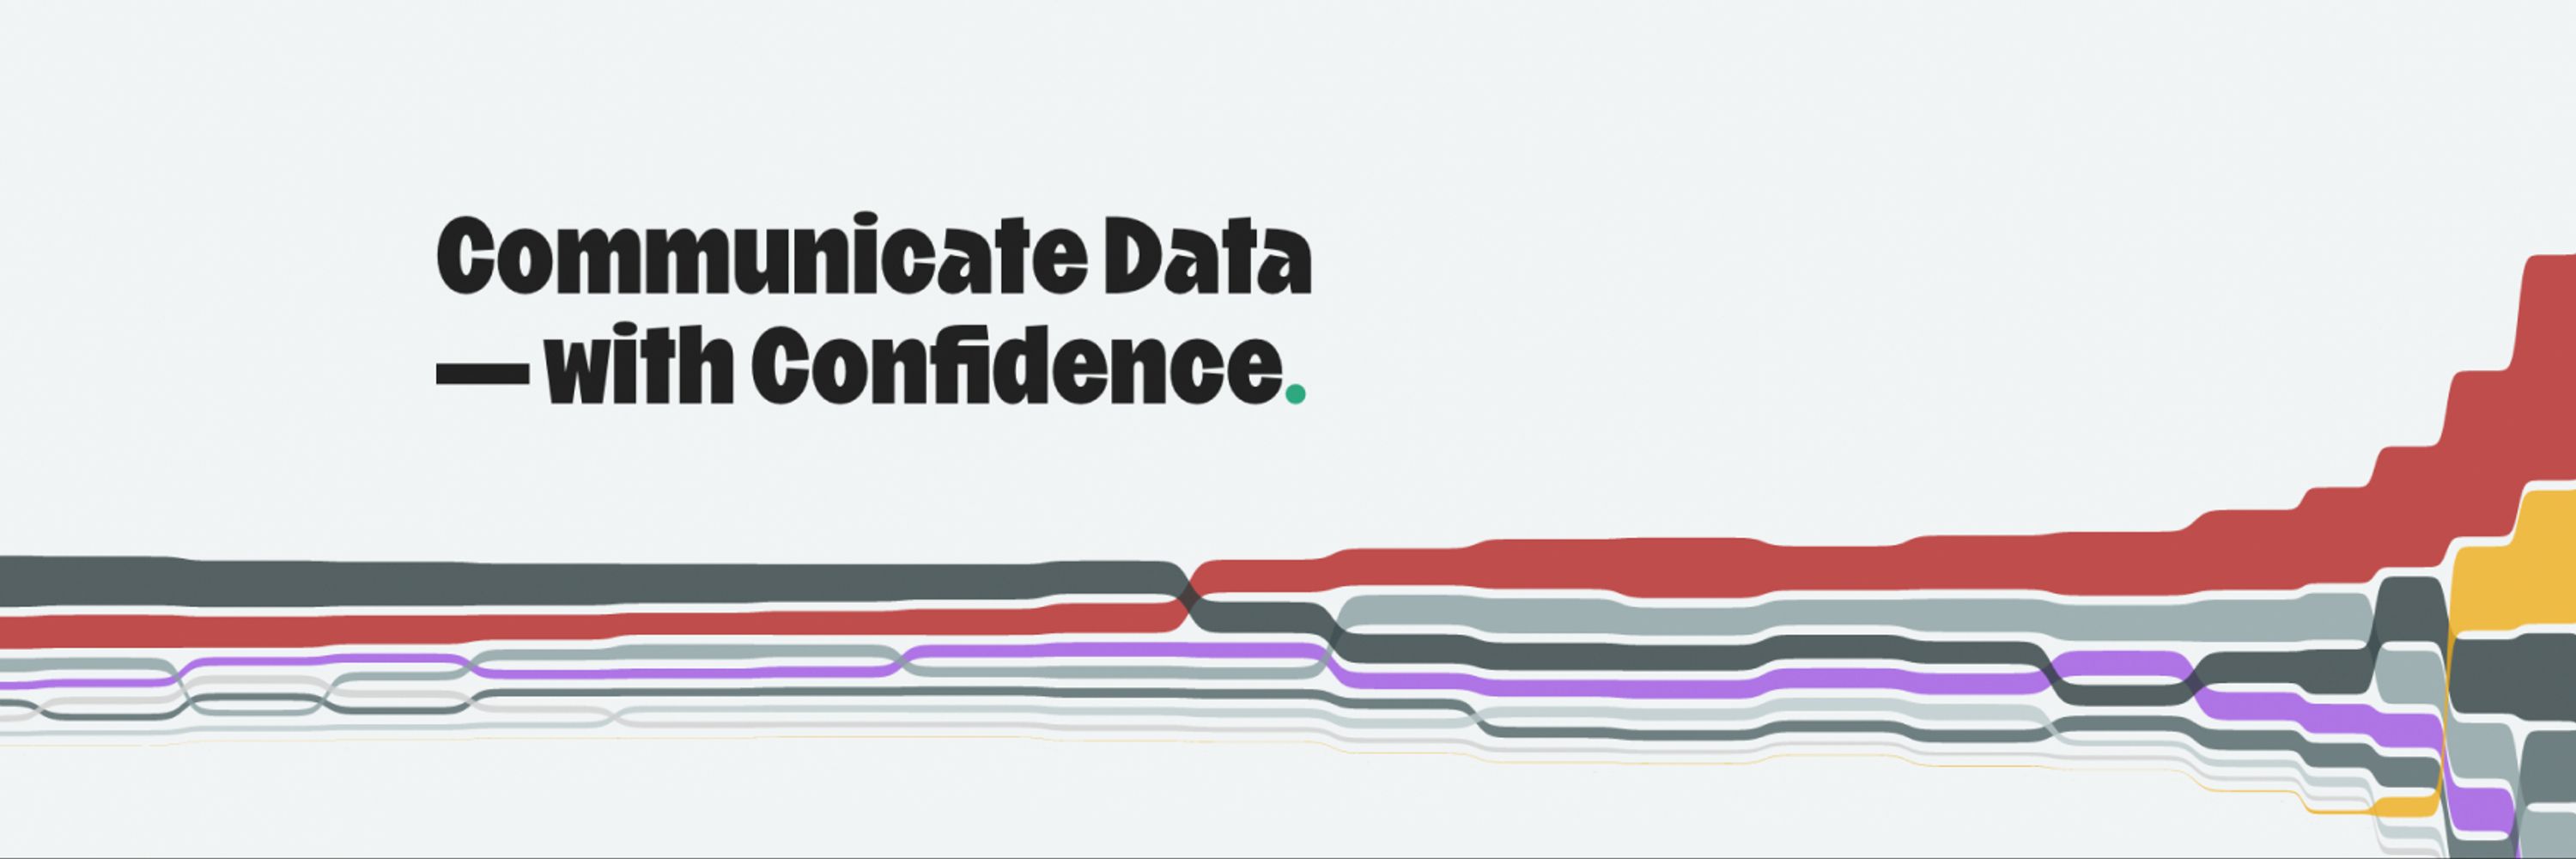
Excited to launch "ggplot2 [un]charted" with @yan-holtz.bsky.social! 🎉
An online course to master #ggplot2 with exercises, quizzes, and modules—and hands-on code running in your browser!
Still WIP—sign up now for a limited discount:
👉 www.ggplot2-uncharted.com
#rstats #DataViz #DataVisualization
An online course to master #ggplot2 with exercises, quizzes, and modules—and hands-on code running in your browser!
Still WIP—sign up now for a limited discount:
👉 www.ggplot2-uncharted.com
#rstats #DataViz #DataVisualization
Feels a bit like this, so thanks for sharing!
February 11, 2026 at 10:39 AM
Feels a bit like this, so thanks for sharing!
Reposted by Cédric Scherer

Join us in Bologna, Italy, 4–6 Nov 2026 for Visualising Climate — the first global conference fully dedicated to climate data visualization and its power to transform public understanding of a changing planet. Come see the data.
visualisingclimate.org
#VisualisingClimate2026 #DataVis #ClimateCrisis
visualisingclimate.org
#VisualisingClimate2026 #DataVis #ClimateCrisis
January 28, 2026 at 11:01 AM
Join us in Bologna, Italy, 4–6 Nov 2026 for Visualising Climate — the first global conference fully dedicated to climate data visualization and its power to transform public understanding of a changing planet. Come see the data.
visualisingclimate.org
#VisualisingClimate2026 #DataVis #ClimateCrisis
visualisingclimate.org
#VisualisingClimate2026 #DataVis #ClimateCrisis
I just opted out of a workshop with a heavy heart when I learned it's a collab with DataCamp.
No matter what, I'll maintain my boycott — why? Here is a detailed overview: dnlmc.medium.com/dont-use-dat...
There are soooo many other options that value you, the community, and the instructors!
No matter what, I'll maintain my boycott — why? Here is a detailed overview: dnlmc.medium.com/dont-use-dat...
There are soooo many other options that value you, the community, and the instructors!

Don’t use DataCamp
A timeline of transgressions & community response
dnlmc.medium.com
February 11, 2026 at 9:28 AM
I just opted out of a workshop with a heavy heart when I learned it's a collab with DataCamp.
No matter what, I'll maintain my boycott — why? Here is a detailed overview: dnlmc.medium.com/dont-use-dat...
There are soooo many other options that value you, the community, and the instructors!
No matter what, I'll maintain my boycott — why? Here is a detailed overview: dnlmc.medium.com/dont-use-dat...
There are soooo many other options that value you, the community, and the instructors!

t's the Prism palette from Carto (via the rcartocolor package). Not the best palette for encoding groups with the same visual weight but I was reminded of a rainbow by the chart and it just felt right, vibe-wise 😁
February 9, 2026 at 8:09 PM
t's the Prism palette from Carto (via the rcartocolor package). Not the best palette for encoding groups with the same visual weight but I was reminded of a rainbow by the chart and it just felt right, vibe-wise 😁
"Vibe Coding" the old-school way 🌈
I was prepping a ggplot2 lesson when a stat_summary() error went sideways. Instead of fixing it, I leaned in.
Sometimes the best dataviz is found in the detours.
(Or at least, the most joy on a Monday ☕️)
#rstats #ggplot2 #dataviz #TheSimpsons
I was prepping a ggplot2 lesson when a stat_summary() error went sideways. Instead of fixing it, I leaned in.
Sometimes the best dataviz is found in the detours.
(Or at least, the most joy on a Monday ☕️)
#rstats #ggplot2 #dataviz #TheSimpsons

February 9, 2026 at 1:15 PM
"Vibe Coding" the old-school way 🌈
I was prepping a ggplot2 lesson when a stat_summary() error went sideways. Instead of fixing it, I leaned in.
Sometimes the best dataviz is found in the detours.
(Or at least, the most joy on a Monday ☕️)
#rstats #ggplot2 #dataviz #TheSimpsons
I was prepping a ggplot2 lesson when a stat_summary() error went sideways. Instead of fixing it, I leaned in.
Sometimes the best dataviz is found in the detours.
(Or at least, the most joy on a Monday ☕️)
#rstats #ggplot2 #dataviz #TheSimpsons
Reposted by Cédric Scherer

January 7, 2026 at 4:20 PM
Reposted by Cédric Scherer

How likely is ‘likely’? Does ‘likely’ have a higher probability than ‘probable’? I put together a quick quiz so you can see how you interpret probability phrases, then see how you compare with others: probability.kucharski.io

January 3, 2026 at 4:15 PM
How likely is ‘likely’? Does ‘likely’ have a higher probability than ‘probable’? I put together a quick quiz so you can see how you interpret probability phrases, then see how you compare with others: probability.kucharski.io
🎄 Hope you’ve got all your presents ready 💝
Google search interest shows a stable pattern:
🎅 “Christmas gift wife” peaks just before Christmas Eve
🎅 “Christmas gift husband” peaks much earlier
#MerryChristmas to all of you! 🎁
📈 Google Trends (Nov 18–Dec 24, 2020–2024)
#dataviz #ggplot2
Google search interest shows a stable pattern:
🎅 “Christmas gift wife” peaks just before Christmas Eve
🎅 “Christmas gift husband” peaks much earlier
#MerryChristmas to all of you! 🎁
📈 Google Trends (Nov 18–Dec 24, 2020–2024)
#dataviz #ggplot2

December 24, 2025 at 10:16 AM
🎄 Hope you’ve got all your presents ready 💝
Google search interest shows a stable pattern:
🎅 “Christmas gift wife” peaks just before Christmas Eve
🎅 “Christmas gift husband” peaks much earlier
#MerryChristmas to all of you! 🎁
📈 Google Trends (Nov 18–Dec 24, 2020–2024)
#dataviz #ggplot2
Google search interest shows a stable pattern:
🎅 “Christmas gift wife” peaks just before Christmas Eve
🎅 “Christmas gift husband” peaks much earlier
#MerryChristmas to all of you! 🎁
📈 Google Trends (Nov 18–Dec 24, 2020–2024)
#dataviz #ggplot2
Reposted by Cédric Scherer

I wrote a lil post on the amazing work that
@ginareynolds.bsky.social does championing ggplot2 extension developers and teaching others to build their own!
The post features the Scrollytelling Quarto extension and the group's cute #RStats hex 🐱:
rworks.dev/posts/ggplot...
@ginareynolds.bsky.social does championing ggplot2 extension developers and teaching others to build their own!
The post features the Scrollytelling Quarto extension and the group's cute #RStats hex 🐱:
rworks.dev/posts/ggplot...

An Introduction to Writing Your Own ggplot2 Geoms – R Works
The ggextenders club provides inspiration and resources for those venturing into the exciting world of creating custom ggplot2 extensions.
rworks.dev
November 3, 2025 at 3:22 PM
I wrote a lil post on the amazing work that
@ginareynolds.bsky.social does championing ggplot2 extension developers and teaching others to build their own!
The post features the Scrollytelling Quarto extension and the group's cute #RStats hex 🐱:
rworks.dev/posts/ggplot...
@ginareynolds.bsky.social does championing ggplot2 extension developers and teaching others to build their own!
The post features the Scrollytelling Quarto extension and the group's cute #RStats hex 🐱:
rworks.dev/posts/ggplot...
I was mostly joking as there's history of "unknown features" that Thomas killed 😁 Negative margins are a great hack, not only in R so I'd def be open to create an PR if that's helpful!
December 15, 2025 at 8:01 PM
I was mostly joking as there's history of "unknown features" that Thomas killed 😁 Negative margins are a great hack, not only in R so I'd def be open to create an PR if that's helpful!
Yeah, I couldn't think of a reason, too, but you also removed the ability to pass into ggsave() - what a bummer back then 😂
December 15, 2025 at 7:57 PM
Yeah, I couldn't think of a reason, too, but you also removed the ability to pass into ggsave() - what a bummer back then 😂

Reposted by Cédric Scherer
🔦 new `focus` argument added to {hexsession}. Specify packages to highlight by dimming all the others.
also suggested by @emilhvitfeldt.bsky.social and inspired by @kellybodwin.com's hex shirt with dimmed logos. example below uses dark mode
hexsession.liomys.mx
also suggested by @emilhvitfeldt.bsky.social and inspired by @kellybodwin.com's hex shirt with dimmed logos. example below uses dark mode
hexsession.liomys.mx
December 11, 2025 at 5:35 PM
🔦 new `focus` argument added to {hexsession}. Specify packages to highlight by dimming all the others.
also suggested by @emilhvitfeldt.bsky.social and inspired by @kellybodwin.com's hex shirt with dimmed logos. example below uses dark mode
hexsession.liomys.mx
also suggested by @emilhvitfeldt.bsky.social and inspired by @kellybodwin.com's hex shirt with dimmed logos. example below uses dark mode
hexsession.liomys.mx
Please don't remove it though! Negative margins are one of the key "concepts" together with empty lines to hack the layout 😊
December 12, 2025 at 5:54 PM
Please don't remove it though! Negative margins are one of the key "concepts" together with empty lines to hack the layout 😊
Full code for those examples plus two alternative versions with geom_text() and geom_label() 👇
gist.github.com/z3tt/2cbd07f...
gist.github.com/z3tt/2cbd07f...

Place Striptext inside Facet Panels with ggplot2
Place Striptext inside Facet Panels with ggplot2. GitHub Gist: instantly share code, notes, and snippets.
gist.github.com
December 12, 2025 at 12:52 PM
Full code for those examples plus two alternative versions with geom_text() and geom_label() 👇
gist.github.com/z3tt/2cbd07f...
gist.github.com/z3tt/2cbd07f...
I ignored the strip.clip argument in #ggplot2 for way too long 😲
Combined with a small negative margin tweak, you can place facet labels inside each panel. A tiny trick that makes small multiples feel so much cleaner.
🔵 no manual coordinates
🔵 inherits theme styling
🔵 scales nicely when resizing
Combined with a small negative margin tweak, you can place facet labels inside each panel. A tiny trick that makes small multiples feel so much cleaner.
🔵 no manual coordinates
🔵 inherits theme styling
🔵 scales nicely when resizing

December 12, 2025 at 12:51 PM
I ignored the strip.clip argument in #ggplot2 for way too long 😲
Combined with a small negative margin tweak, you can place facet labels inside each panel. A tiny trick that makes small multiples feel so much cleaner.
🔵 no manual coordinates
🔵 inherits theme styling
🔵 scales nicely when resizing
Combined with a small negative margin tweak, you can place facet labels inside each panel. A tiny trick that makes small multiples feel so much cleaner.
🔵 no manual coordinates
🔵 inherits theme styling
🔵 scales nicely when resizing
Reposted by Cédric Scherer

Hi #rstats friends! 👋🏽
Checkout our newest blog that displays how to create beautiful and reproducible river maps! 🗺
🔗: waterdata.usgs.gov/blog/nhd-viz...
#nhdplusTools #dataRetrieval #ggplot #dataviz
Checkout our newest blog that displays how to create beautiful and reproducible river maps! 🗺
🔗: waterdata.usgs.gov/blog/nhd-viz...
#nhdplusTools #dataRetrieval #ggplot #dataviz

December 3, 2025 at 5:47 PM
Hi #rstats friends! 👋🏽
Checkout our newest blog that displays how to create beautiful and reproducible river maps! 🗺
🔗: waterdata.usgs.gov/blog/nhd-viz...
#nhdplusTools #dataRetrieval #ggplot #dataviz
Checkout our newest blog that displays how to create beautiful and reproducible river maps! 🗺
🔗: waterdata.usgs.gov/blog/nhd-viz...
#nhdplusTools #dataRetrieval #ggplot #dataviz


Reposted by Cédric Scherer

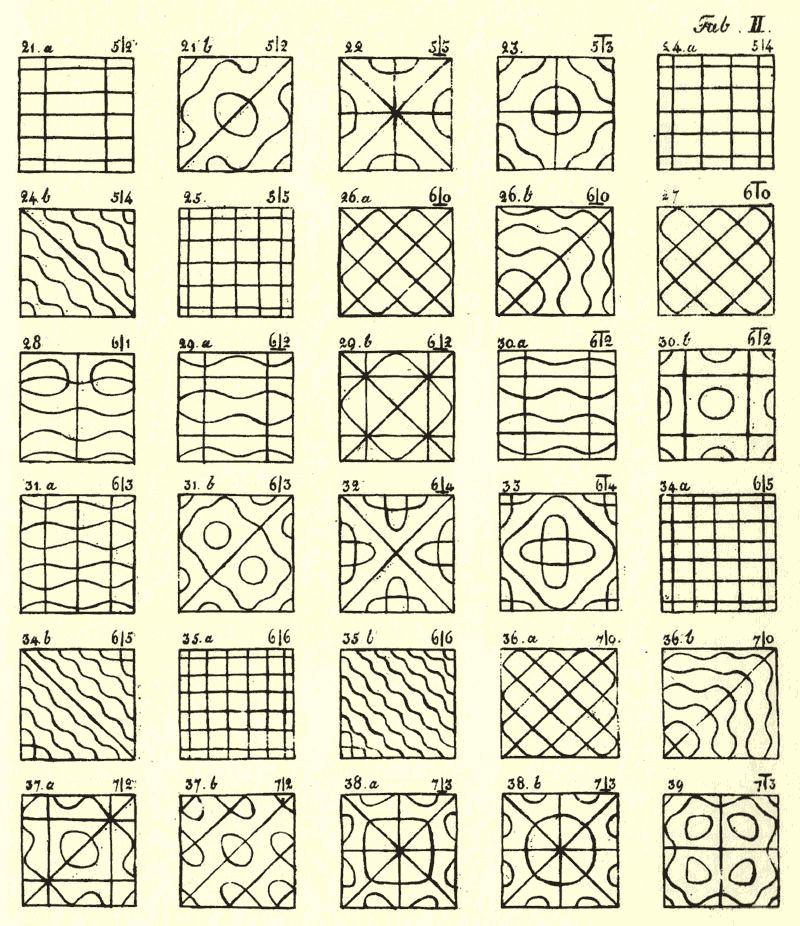
#TodayinHistory #dataviz #OTD 📊
🎂Nov 30, 1756 Ernest Florens Friedrich Chladni born in Wittenberg, Germany 🇩🇪
1787: Visualization of vibration patterns (by spreading a layer of sand on a disk, and observing displacement when vibration is applied)
Created the idea of being able to "see" sound
🎂Nov 30, 1756 Ernest Florens Friedrich Chladni born in Wittenberg, Germany 🇩🇪
1787: Visualization of vibration patterns (by spreading a layer of sand on a disk, and observing displacement when vibration is applied)
Created the idea of being able to "see" sound

December 1, 2025 at 2:04 AM
#TodayinHistory #dataviz #OTD 📊
🎂Nov 30, 1756 Ernest Florens Friedrich Chladni born in Wittenberg, Germany 🇩🇪
1787: Visualization of vibration patterns (by spreading a layer of sand on a disk, and observing displacement when vibration is applied)
Created the idea of being able to "see" sound
🎂Nov 30, 1756 Ernest Florens Friedrich Chladni born in Wittenberg, Germany 🇩🇪
1787: Visualization of vibration patterns (by spreading a layer of sand on a disk, and observing displacement when vibration is applied)
Created the idea of being able to "see" sound
👾 We've put together a supercut to show exactly what “interactive” means inside #ggplot2 [un]charted 👇
The project became far more ambitious than we first planned, but seeing how rich, detailed, and interactive it has become makes Yan and me genuinely proud of what we’ve built 🚀
#rstats #dataviz
The project became far more ambitious than we first planned, but seeing how rich, detailed, and interactive it has become makes Yan and me genuinely proud of what we’ve built 🚀
#rstats #dataviz
November 27, 2025 at 3:55 PM
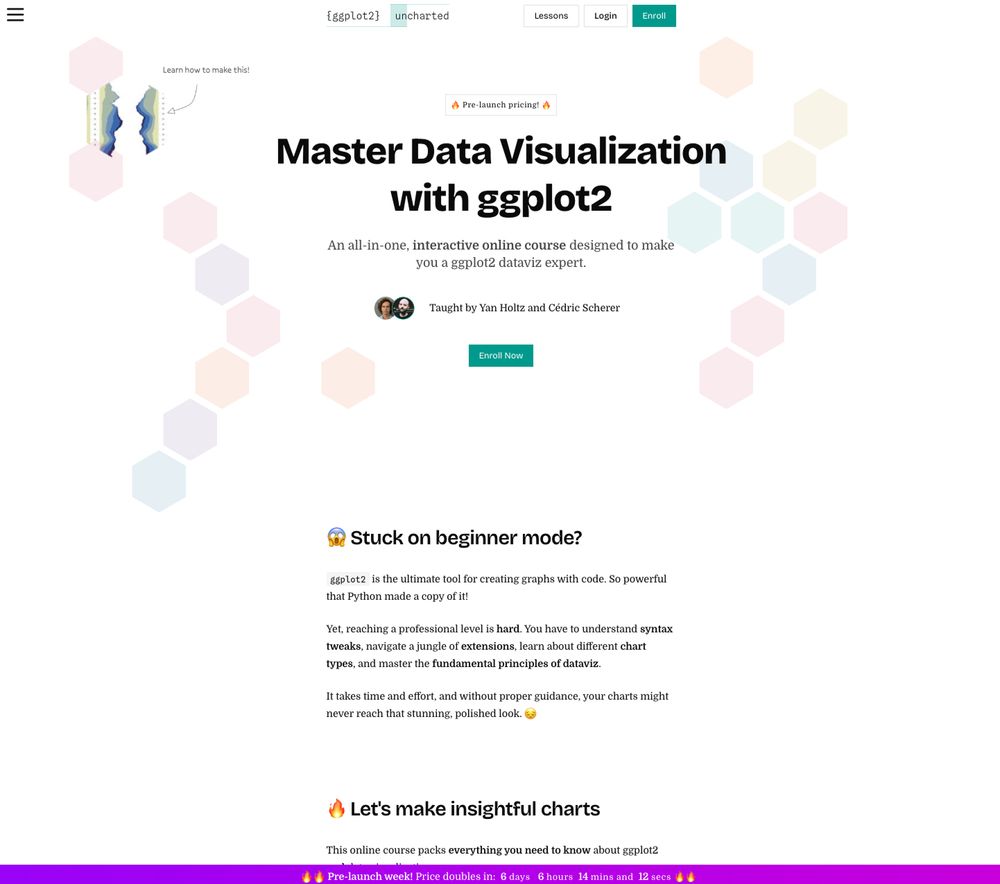
Yan and I poured our dataviz, coding, teaching, design experience and passion into this hands-on, interactive journey through everything you need to know about #ggplot2 and #dataviz 📈🧑💻🚀
👉 ggplot2-uncharted.com
Until Friday, you can enroll in our course for just $99 🔥
👉 ggplot2-uncharted.com
Until Friday, you can enroll in our course for just $99 🔥

November 26, 2025 at 3:37 PM
Yan and I poured our dataviz, coding, teaching, design experience and passion into this hands-on, interactive journey through everything you need to know about #ggplot2 and #dataviz 📈🧑💻🚀
👉 ggplot2-uncharted.com
Until Friday, you can enroll in our course for just $99 🔥
👉 ggplot2-uncharted.com
Until Friday, you can enroll in our course for just $99 🔥
If motivation levels drop, Waddles comes to the rescue! 🐽

November 20, 2025 at 3:30 PM
If motivation levels drop, Waddles comes to the rescue! 🐽
Reposted by Cédric Scherer

We need a total and complete shutdown of WSJ data graphics until our country's representatives can figure out what is going on.
h/t @merz.bsky.social @drmikewiser.bsky.social
h/t @merz.bsky.social @drmikewiser.bsky.social

November 20, 2025 at 4:53 AM
We need a total and complete shutdown of WSJ data graphics until our country's representatives can figure out what is going on.
h/t @merz.bsky.social @drmikewiser.bsky.social
h/t @merz.bsky.social @drmikewiser.bsky.social