


Sadettin Demirel
@sadettindemirel.bsky.social
Assistant Professor, PhD. Love #rstats📈 and #datajournalism. Research on social platforms, public perception, journalism and more…
Reposted by Sadettin Demirel

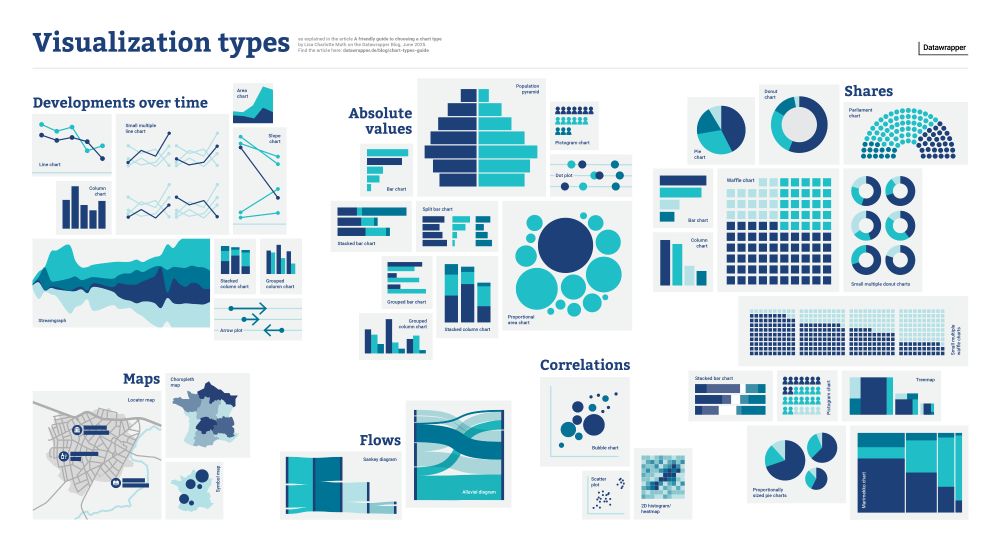
📊 There are *so* many chart types out there. Which one should you use for what kind of data and goal?
I tried to answer the question in a new blog post (and poster!): www.datawrapper.de/blog/chart-t...
I tried to answer the question in a new blog post (and poster!): www.datawrapper.de/blog/chart-t...
June 16, 2025 at 7:14 PM
📊 There are *so* many chart types out there. Which one should you use for what kind of data and goal?
I tried to answer the question in a new blog post (and poster!): www.datawrapper.de/blog/chart-t...
I tried to answer the question in a new blog post (and poster!): www.datawrapper.de/blog/chart-t...
Reposted by Sadettin Demirel

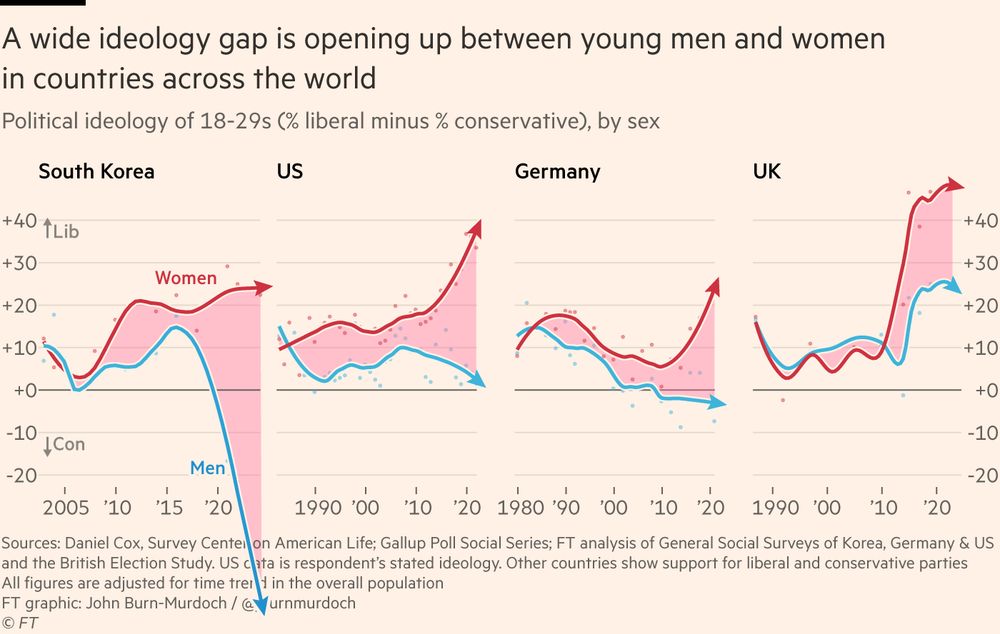
South Korea gender divide update 😲
Young men lean right by 50 points
(74% conservative vs 24% centre-left)
Young women lean left by 22 points
(58% centre-left vs 36% cons)
Young men lean right by 50 points
(74% conservative vs 24% centre-left)
Young women lean left by 22 points
(58% centre-left vs 36% cons)
June 4, 2025 at 10:01 AM
South Korea gender divide update 😲
Young men lean right by 50 points
(74% conservative vs 24% centre-left)
Young women lean left by 22 points
(58% centre-left vs 36% cons)
Young men lean right by 50 points
(74% conservative vs 24% centre-left)
Young women lean left by 22 points
(58% centre-left vs 36% cons)
Reposted by Sadettin Demirel

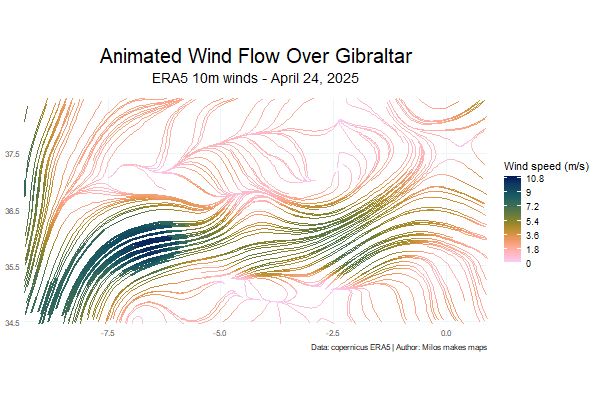
Want to turn raw wind data into a mesmerizing, animated map?
With R, it’s easier than you think.
My new tutorial shows you how, step by step.
Let’s catch the breeze. ⤵️
youtu.be/EmVbVTqwoMU
#GIS #DataViz #gganimate #metR #WindMap #ClimateData #SpatialAnalysis #MilosMakesMaps
With R, it’s easier than you think.
My new tutorial shows you how, step by step.
Let’s catch the breeze. ⤵️
youtu.be/EmVbVTqwoMU
#GIS #DataViz #gganimate #metR #WindMap #ClimateData #SpatialAnalysis #MilosMakesMaps
May 25, 2025 at 12:38 PM
Want to turn raw wind data into a mesmerizing, animated map?
With R, it’s easier than you think.
My new tutorial shows you how, step by step.
Let’s catch the breeze. ⤵️
youtu.be/EmVbVTqwoMU
#GIS #DataViz #gganimate #metR #WindMap #ClimateData #SpatialAnalysis #MilosMakesMaps
With R, it’s easier than you think.
My new tutorial shows you how, step by step.
Let’s catch the breeze. ⤵️
youtu.be/EmVbVTqwoMU
#GIS #DataViz #gganimate #metR #WindMap #ClimateData #SpatialAnalysis #MilosMakesMaps
Reposted by Sadettin Demirel
NEW 🧵
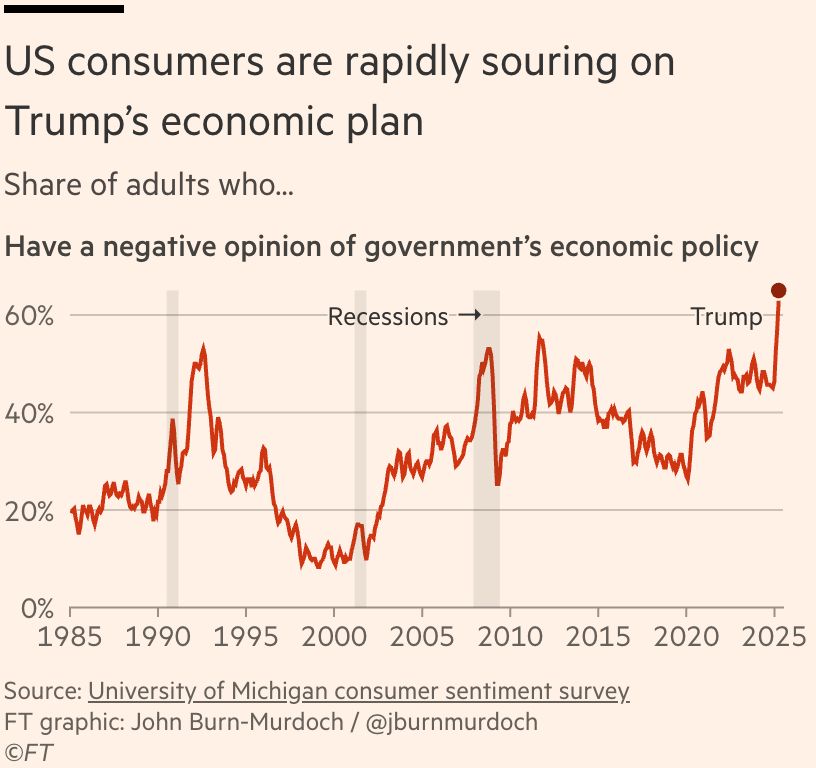
A quick thread of charts showing how Trump’s economic agenda is going so far:
1) US consumers are reacting very very negatively.
These are the worst ratings for any US government’s economic policy since records began.
A quick thread of charts showing how Trump’s economic agenda is going so far:
1) US consumers are reacting very very negatively.
These are the worst ratings for any US government’s economic policy since records began.
April 4, 2025 at 12:51 PM
NEW 🧵
A quick thread of charts showing how Trump’s economic agenda is going so far:
1) US consumers are reacting very very negatively.
These are the worst ratings for any US government’s economic policy since records began.
A quick thread of charts showing how Trump’s economic agenda is going so far:
1) US consumers are reacting very very negatively.
These are the worst ratings for any US government’s economic policy since records began.
Reposted by Sadettin Demirel

The Data Vis Dispatch is out! Learn about what chopstick sleeves can look like and which drugs people take in your hometown.
🥢 www.datawrapper.de/blog/data-vi...
Thanks to all that have taken our Dispatch reader survey already! 🎉 In case you haven't yet, find it here: dw.link/dispatch-sur...
🥢 www.datawrapper.de/blog/data-vi...
Thanks to all that have taken our Dispatch reader survey already! 🎉 In case you haven't yet, find it here: dw.link/dispatch-sur...


March 25, 2025 at 4:05 PM
The Data Vis Dispatch is out! Learn about what chopstick sleeves can look like and which drugs people take in your hometown.
🥢 www.datawrapper.de/blog/data-vi...
Thanks to all that have taken our Dispatch reader survey already! 🎉 In case you haven't yet, find it here: dw.link/dispatch-sur...
🥢 www.datawrapper.de/blog/data-vi...
Thanks to all that have taken our Dispatch reader survey already! 🎉 In case you haven't yet, find it here: dw.link/dispatch-sur...
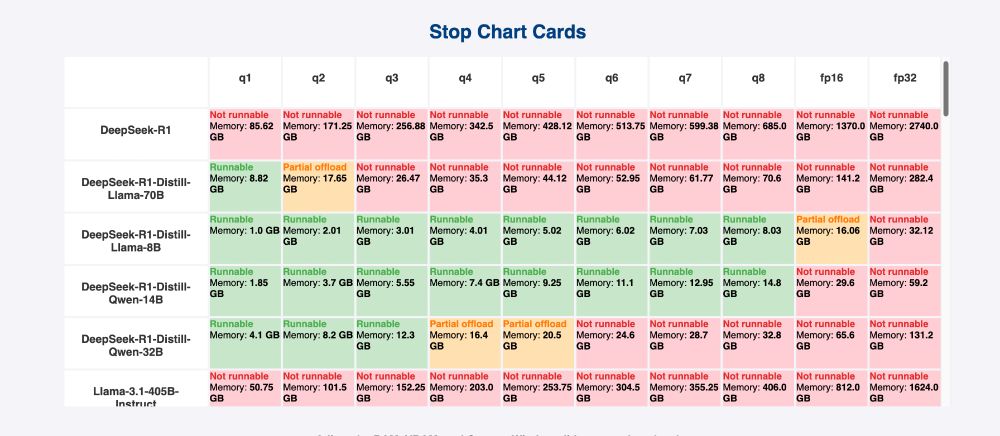
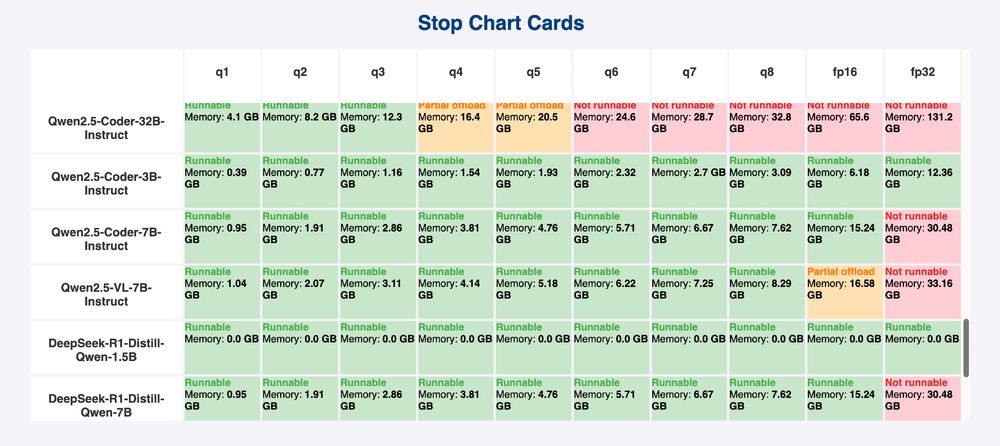
There is a fantsastic site called canirunthisllm.net It simply answers the question of which large language models your hardware can run. Just put your device specs, and voilà!
#artificialintelligence #llm #AI
#artificialintelligence #llm #AI

March 11, 2025 at 3:49 PM
There is a fantsastic site called canirunthisllm.net It simply answers the question of which large language models your hardware can run. Just put your device specs, and voilà!
#artificialintelligence #llm #AI
#artificialintelligence #llm #AI
Reposted by Sadettin Demirel
more friends joining the #rstats + LLM toolkit this week
* Retrieval-Augmented Generation in R w/ {ragnar}
* {tidyllm}, a pipe-friendly interface for multiple models
* LLM powered computer vision w/ {kuzco}
Summary here:
luisdva.github.io/rstats/LLMsR/
* Retrieval-Augmented Generation in R w/ {ragnar}
* {tidyllm}, a pipe-friendly interface for multiple models
* LLM powered computer vision w/ {kuzco}
Summary here:
luisdva.github.io/rstats/LLMsR/

January 28, 2025 at 11:46 PM
more friends joining the #rstats + LLM toolkit this week
* Retrieval-Augmented Generation in R w/ {ragnar}
* {tidyllm}, a pipe-friendly interface for multiple models
* LLM powered computer vision w/ {kuzco}
Summary here:
luisdva.github.io/rstats/LLMsR/
* Retrieval-Augmented Generation in R w/ {ragnar}
* {tidyllm}, a pipe-friendly interface for multiple models
* LLM powered computer vision w/ {kuzco}
Summary here:
luisdva.github.io/rstats/LLMsR/
Reposted by Sadettin Demirel

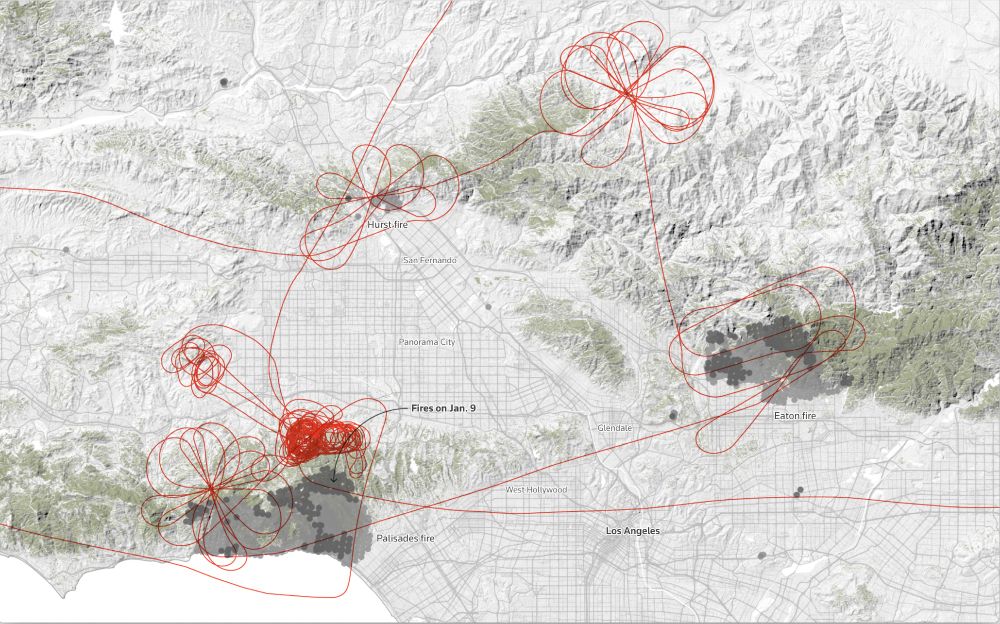
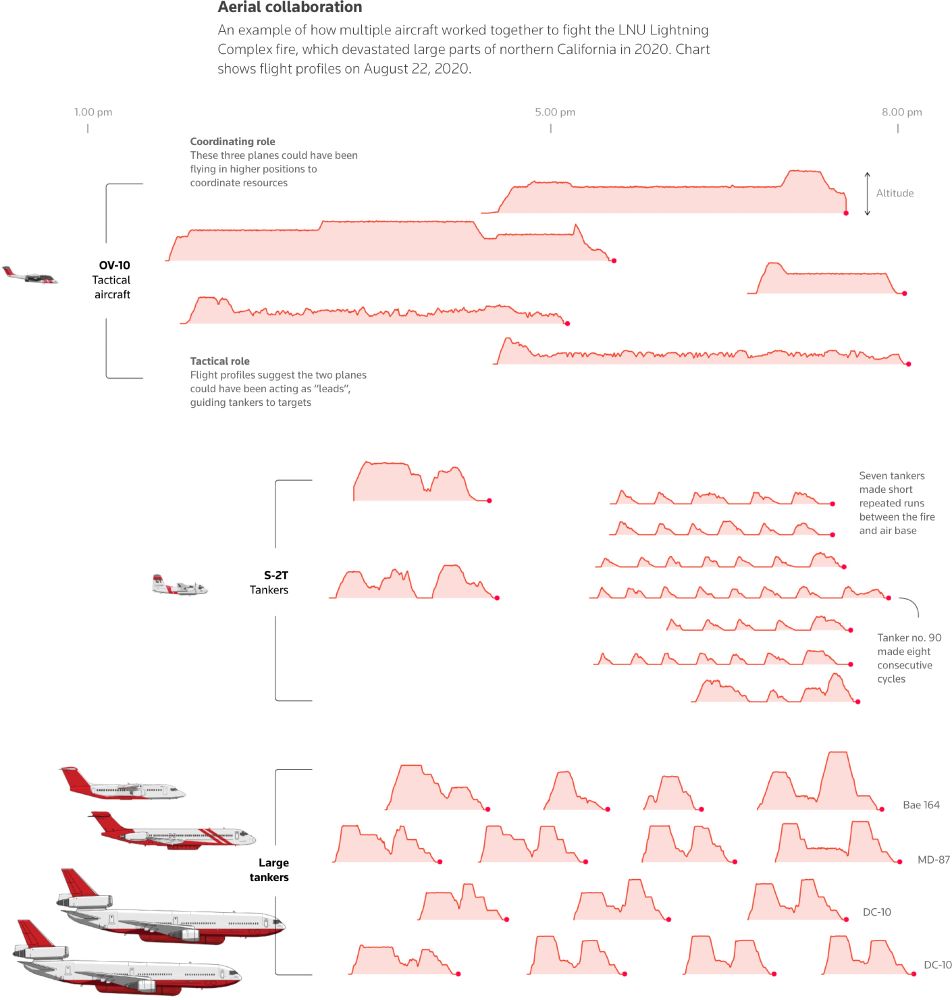
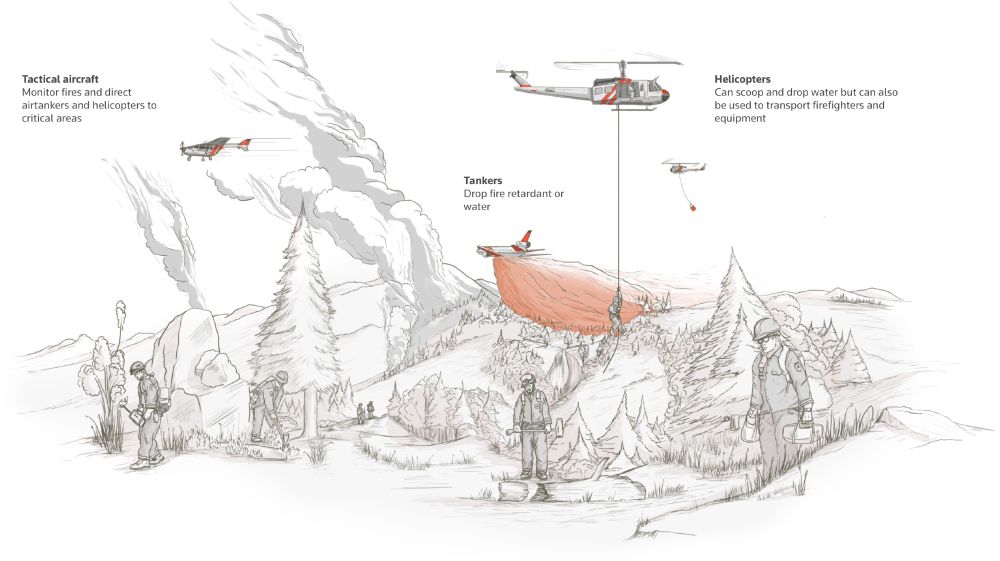
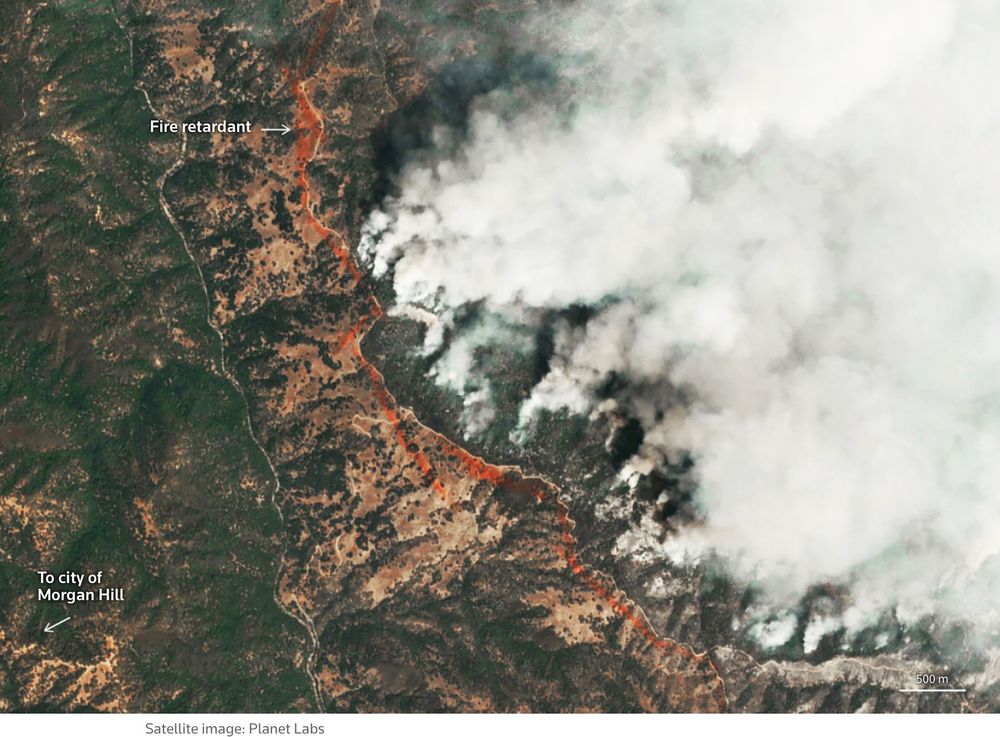
The graphics in this @reuters.com article on air tankers battling the fires in LA are astonishingly good.
www.reuters.com/graphics/CAL...
via @interactives.bsky.social
www.reuters.com/graphics/CAL...
via @interactives.bsky.social
January 10, 2025 at 6:38 PM
The graphics in this @reuters.com article on air tankers battling the fires in LA are astonishingly good.
www.reuters.com/graphics/CAL...
via @interactives.bsky.social
www.reuters.com/graphics/CAL...
via @interactives.bsky.social
Hey #rstats folks, I just started using the atrrr package to interact with #Bluesky. In fact I am sending this post via R and atrrr package and I am loving this R package. Shout out to @jbgruber.bsky.social and the team for creating such a good R package https://jbgruber.github.io/atrrr/index.html

Wrapper for the AT Protocol Behind Bluesky
Wraps the AT Protocol (Authenticated Transfer Protocol) behind Bluesky <https://bsky.social>. Functions can be used for, among others, retrieving posts and followers from the network or posting conten...
jbgruber.github.io
December 2, 2024 at 5:03 PM
Hey #rstats folks, I just started using the atrrr package to interact with #Bluesky. In fact I am sending this post via R and atrrr package and I am loving this R package. Shout out to @jbgruber.bsky.social and the team for creating such a good R package https://jbgruber.github.io/atrrr/index.html
Reposted by Sadettin Demirel

If you're interested in trying out LLMs in #rstats but don't know where to begin, I've added a few two vignettes to elmer: elmer.tidyverse.org/articles/elm... and elmer.tidyverse.org/articles/pro...
Getting started with elmer
elmer.tidyverse.org
November 29, 2024 at 3:45 PM
If you're interested in trying out LLMs in #rstats but don't know where to begin, I've added a few two vignettes to elmer: elmer.tidyverse.org/articles/elm... and elmer.tidyverse.org/articles/pro...
Reposted by Sadettin Demirel

Traffic from Bluesky's @bsky.app to @theguardian.com is already 2x that of Threads
In its first week on the platform & with 300k followers, Bluesky traffic from @theguardian.com posts is already higher than it was from TwX in any week in 2024, where the account had 10.8m followers, but🧵
In its first week on the platform & with 300k followers, Bluesky traffic from @theguardian.com posts is already higher than it was from TwX in any week in 2024, where the account had 10.8m followers, but🧵
November 27, 2024 at 6:30 AM
Traffic from Bluesky's @bsky.app to @theguardian.com is already 2x that of Threads
In its first week on the platform & with 300k followers, Bluesky traffic from @theguardian.com posts is already higher than it was from TwX in any week in 2024, where the account had 10.8m followers, but🧵
In its first week on the platform & with 300k followers, Bluesky traffic from @theguardian.com posts is already higher than it was from TwX in any week in 2024, where the account had 10.8m followers, but🧵
Looking for curated list of #dataviz tools, guides and learning materials. Here some:
1. Dataviz Tools dataviz.tools
1. Dataviz Tools dataviz.tools

dataviz.tools
a curated guide to the best tools, resources and technologies for data visualization
Dataviz.tools
November 26, 2024 at 6:03 PM
Looking for curated list of #dataviz tools, guides and learning materials. Here some:
1. Dataviz Tools dataviz.tools
1. Dataviz Tools dataviz.tools
Reposted by Sadettin Demirel

Hello World!
Veri Okuryazarlığı Derneği olarak BlueSky'da da varız :) Faaliyetlerimiz hakkında bilgi almak için voyd.org.tr ziyaret edebilir, her ay çıkardığımız veri bültenimize göz atabilirsiniz. voydorg.substack.com #datajournalism #verigazeteciligi #verigörselleştirme #açıkveri
Veri Okuryazarlığı Derneği olarak BlueSky'da da varız :) Faaliyetlerimiz hakkında bilgi almak için voyd.org.tr ziyaret edebilir, her ay çıkardığımız veri bültenimize göz atabilirsiniz. voydorg.substack.com #datajournalism #verigazeteciligi #verigörselleştirme #açıkveri

Veri Bülteni | Veri Okuryazarlığı Derneği | Substack
Veri Bülteni ile Türkiye’de ve dünyada veri okuryazarlığı, veri gazeteciliği, açık veri, veri görselleştirme ve ilişkili alanlarda dikkat çeken gelişmeleri derliyor ve paylaşıyoruz. Click to read Veri...
voydorg.substack.com
November 18, 2024 at 3:38 PM
Hello World!
Veri Okuryazarlığı Derneği olarak BlueSky'da da varız :) Faaliyetlerimiz hakkında bilgi almak için voyd.org.tr ziyaret edebilir, her ay çıkardığımız veri bültenimize göz atabilirsiniz. voydorg.substack.com #datajournalism #verigazeteciligi #verigörselleştirme #açıkveri
Veri Okuryazarlığı Derneği olarak BlueSky'da da varız :) Faaliyetlerimiz hakkında bilgi almak için voyd.org.tr ziyaret edebilir, her ay çıkardığımız veri bültenimize göz atabilirsiniz. voydorg.substack.com #datajournalism #verigazeteciligi #verigörselleştirme #açıkveri
I created a #datajournalism feed. It lists posts with #datajournalism, #ddj hashtags or just a phrase of "data journalism". Feel free to like and follow :)
bsky.app/profile/did:...
bsky.app/profile/did:...
November 18, 2024 at 3:08 PM
I created a #datajournalism feed. It lists posts with #datajournalism, #ddj hashtags or just a phrase of "data journalism". Feel free to like and follow :)
bsky.app/profile/did:...
bsky.app/profile/did:...
The Guardian decides not to post on X, great, now open a
#BlueSky account for #news #journalism🗞️
www.niemanlab.org/2024/11/the-...
#BlueSky account for #news #journalism🗞️
www.niemanlab.org/2024/11/the-...

The Guardian won’t post on X anymore — but isn’t deleting its accounts there, at least for now
Guardian reporters may still use X for newsgathering, the company said.
www.niemanlab.org
November 16, 2024 at 2:13 PM
The Guardian decides not to post on X, great, now open a
#BlueSky account for #news #journalism🗞️
www.niemanlab.org/2024/11/the-...
#BlueSky account for #news #journalism🗞️
www.niemanlab.org/2024/11/the-...
Reposted by Sadettin Demirel

Hi all! A (re)-introduction: I'm Tyler, developer of #rayshader and the #rayverse, a collection of R packages for 3D #dataviz and #mapping.
Here's one of my greatest hits (now that Bluesky supports videos!): The Earth's submarine fiber optic cable network, visualized in #RStats with #rayrender.
Here's one of my greatest hits (now that Bluesky supports videos!): The Earth's submarine fiber optic cable network, visualized in #RStats with #rayrender.
November 8, 2024 at 8:06 PM
Hi all! A (re)-introduction: I'm Tyler, developer of #rayshader and the #rayverse, a collection of R packages for 3D #dataviz and #mapping.
Here's one of my greatest hits (now that Bluesky supports videos!): The Earth's submarine fiber optic cable network, visualized in #RStats with #rayrender.
Here's one of my greatest hits (now that Bluesky supports videos!): The Earth's submarine fiber optic cable network, visualized in #RStats with #rayrender.
Reposted by Sadettin Demirel

If you're curious why everybody's username is a domain, it's because every user is essentially a website
October 20, 2024 at 9:20 PM
If you're curious why everybody's username is a domain, it's because every user is essentially a website
Reposted by Sadettin Demirel
I've been using S7 in elmer (elmer.tidyverse.org) and it's been a lot of fun. Takes a little bit of getting used to (mainly unlearning old S3 habits) but it's evolving rapidly and the rough edges are quickly getting smoothed down.

Call LLM APIs from R
A consistent interface for calling LLM APIs. Includes support for streaming.
elmer.tidyverse.org
November 7, 2024 at 2:03 PM
I've been using S7 in elmer (elmer.tidyverse.org) and it's been a lot of fun. Takes a little bit of getting used to (mainly unlearning old S3 habits) but it's evolving rapidly and the rough edges are quickly getting smoothed down.
Reposted by Sadettin Demirel

For anyone who wants to screw up their data and then spend election eve cleaning it back up... There's an #rstats package for that
github.com/nrennie/mess...
github.com/nrennie/mess...

GitHub - nrennie/messy: R package to make a data frame messy and untidy.
R package to make a data frame messy and untidy. Contribute to nrennie/messy development by creating an account on GitHub.
github.com
November 5, 2024 at 9:43 PM
For anyone who wants to screw up their data and then spend election eve cleaning it back up... There's an #rstats package for that
github.com/nrennie/mess...
github.com/nrennie/mess...

Emergency Pod: Sam Altman is Out at Open AI
“Probably the most shocking tech story of the year.”
www.nytimes.com
November 18, 2023 at 10:08 AM
Reposted by Sadettin Demirel

Tools such as GPTZero and TurnItIn’s AI detection claim that they can determine (with varying levels of accuracy) whether a student’s writing was likely to have been created by a generative AI tool. But these tools are so inaccurate as to be dangerous.

To Best Serve Students, Schools Shouldn’t Try to Block Generative AI,
Generative AI gained widespread attention earlier this year, but one group has had to reckon with it more quickly than most: educators. Teachers and school administrators have struggled with two big
www.eff.org
November 16, 2023 at 8:22 PM
Tools such as GPTZero and TurnItIn’s AI detection claim that they can determine (with varying levels of accuracy) whether a student’s writing was likely to have been created by a generative AI tool. But these tools are so inaccurate as to be dangerous.
Reposted by Sadettin Demirel
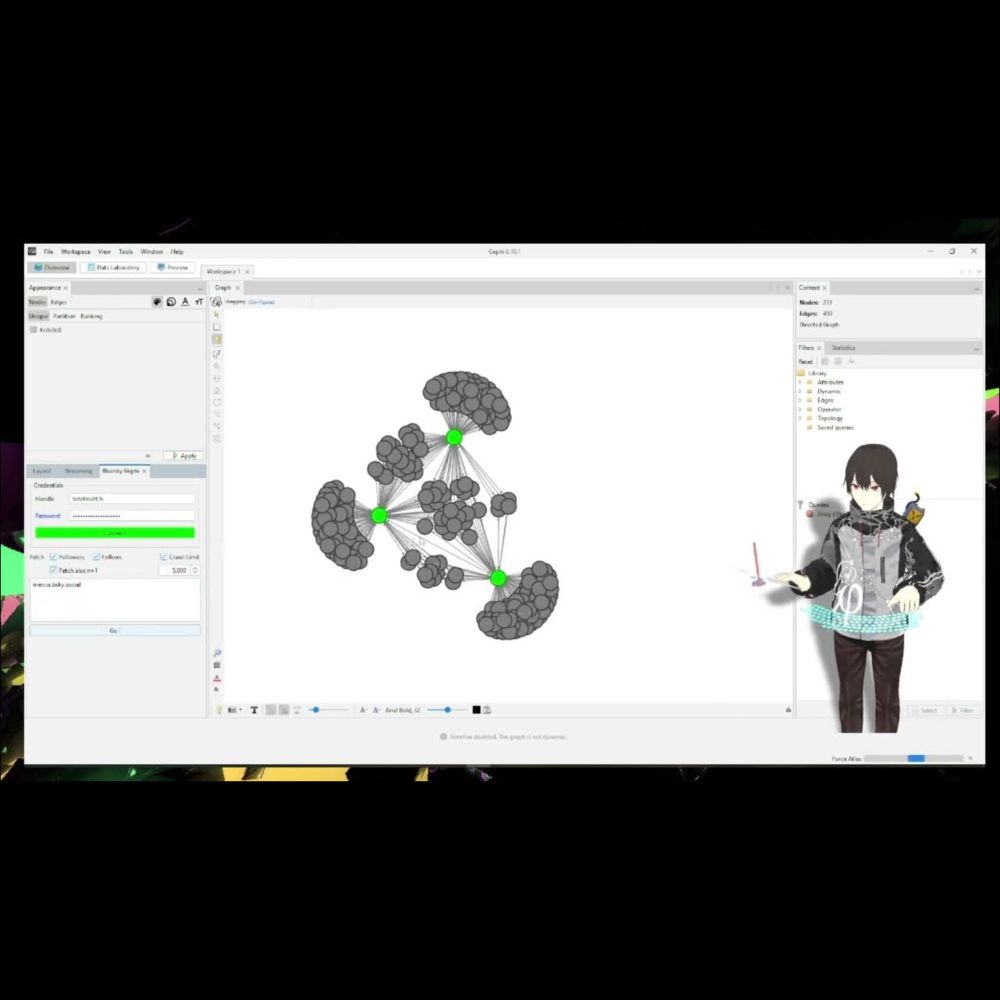
So the Bluesky #Gephi plugin is released ! You can fetch it directly from the plugin manager inside the software. It allows you to explore the followers / followings relationships of the network. Here is a Fast Tutorial www.youtube.com/watch?v=EUq5... #graph #sna #atproto
Bluesky Gephi plugin Fast Tutorial
www.youtube.com
November 16, 2023 at 7:22 AM
So the Bluesky #Gephi plugin is released ! You can fetch it directly from the plugin manager inside the software. It allows you to explore the followers / followings relationships of the network. Here is a Fast Tutorial www.youtube.com/watch?v=EUq5... #graph #sna #atproto
Hello World! Merhaba Dünya!
November 16, 2023 at 2:42 PM
Hello World! Merhaba Dünya!