


Ryan Batten, PhD(c)
@ryanbatten.bsky.social
- Biostatistician by trade
- PhD candidate in Clinical Epidemiology at Memorial University
- Love statistics & R!
- Area of expertise: causal inference using real-world data
Blog: www.causallycurious.com
- PhD candidate in Clinical Epidemiology at Memorial University
- Love statistics & R!
- Area of expertise: causal inference using real-world data
Blog: www.causallycurious.com
Average treatment effect in the overlap can be a tricky causal estimand. Why?
The ATO is a little different than other estimands.
Often, it's not well defined before the analysis.
This is because there are many ways to define the population.
Instead, it's based on the statistical method.
1/2
The ATO is a little different than other estimands.
Often, it's not well defined before the analysis.
This is because there are many ways to define the population.
Instead, it's based on the statistical method.
1/2

December 18, 2024 at 5:51 PM
Average treatment effect in the overlap can be a tricky causal estimand. Why?
The ATO is a little different than other estimands.
Often, it's not well defined before the analysis.
This is because there are many ways to define the population.
Instead, it's based on the statistical method.
1/2
The ATO is a little different than other estimands.
Often, it's not well defined before the analysis.
This is because there are many ways to define the population.
Instead, it's based on the statistical method.
1/2
Reposted by Ryan Batten, PhD(c)
The third installment of the “how should we actually construct our causal graphs anyway” series is out now! 👇🏼
Nick & I ask the question: can we just get an LLM to tell us what belongs on the graph?
Nick & I ask the question: can we just get an LLM to tell us what belongs on the graph?

New working paper out today with @epiellie.bsky.social called "Do LLMs Act as Repositories of Causal Knowledge?"
Can LLMs (ie ChatGPT) build for us the causal models we need to identify an effect? There are reasons to expect they could. But can they? Well, not really, no.
arxiv.org/html/2412.10...
Can LLMs (ie ChatGPT) build for us the causal models we need to identify an effect? There are reasons to expect they could. But can they? Well, not really, no.
arxiv.org/html/2412.10...
Do LLMs Act as Repositories of Causal Knowledge?
arxiv.org
December 17, 2024 at 10:03 PM
The third installment of the “how should we actually construct our causal graphs anyway” series is out now! 👇🏼
Nick & I ask the question: can we just get an LLM to tell us what belongs on the graph?
Nick & I ask the question: can we just get an LLM to tell us what belongs on the graph?
Reposted by Ryan Batten, PhD(c)

A few papers I think worth reading. Mostly open access.
Causal inference is hard:
www.nature.com/articles/s41...
Causal inference is hard:
www.nature.com/articles/s41...
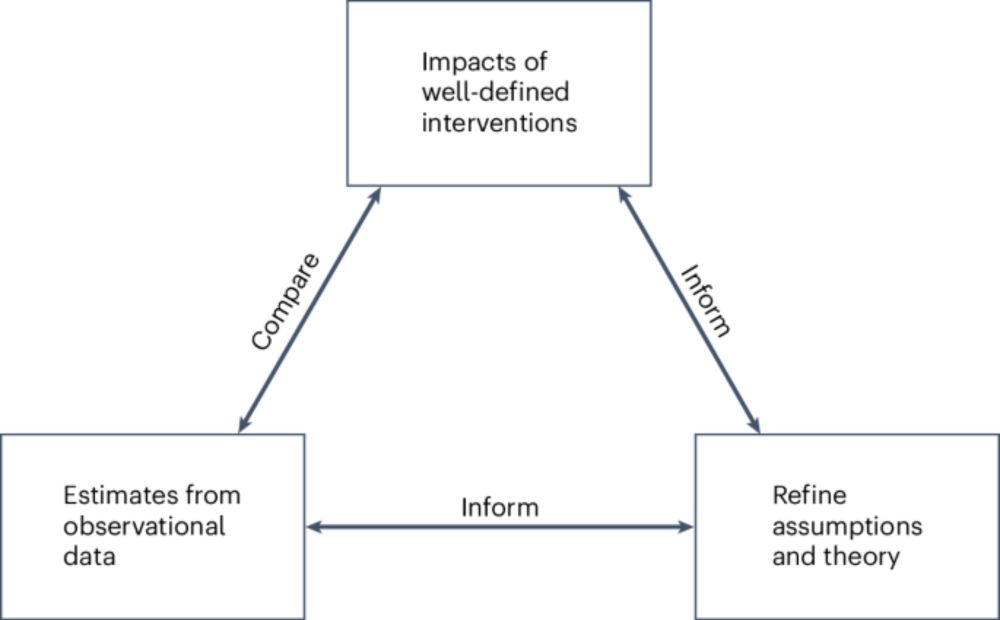
Causal inference on human behaviour - Nature Human Behaviour
In this Review, Drew Bailey et al. present an accessible, non-technical overview of key challenges for causal inference in studies of human behaviour as well as methodological solutions to these chall...
www.nature.com
December 17, 2024 at 1:28 AM
A few papers I think worth reading. Mostly open access.
Causal inference is hard:
www.nature.com/articles/s41...
Causal inference is hard:
www.nature.com/articles/s41...
The more obscure a statistical analysis method, the more I question the design.
Not saying it's wrong, but I'd have questions why a more "common" approach wasn't used.
Not saying it's wrong, but I'd have questions why a more "common" approach wasn't used.
December 16, 2024 at 3:33 PM
The more obscure a statistical analysis method, the more I question the design.
Not saying it's wrong, but I'd have questions why a more "common" approach wasn't used.
Not saying it's wrong, but I'd have questions why a more "common" approach wasn't used.
Bootstrapping is sort of a semi-Bayesian approach when you think about it
December 15, 2024 at 12:57 AM
Bootstrapping is sort of a semi-Bayesian approach when you think about it
Reposted by Ryan Batten, PhD(c)
Calling bullshit - a skill that every applied statistician should master. Unfortunately many of the younger statisticians I’ve worked with sometimes lack the bravery to do so. The book looks like a must-have. #Statistics #StatsSky @carlbergstrom.com @carlzimmer.bsky.social
I wish this course on Calling Bullshit were offered everywhere.
Follow the link to find the syllabus, which is a thing of beauty. It looks like this will be available in a digital form for those of us not lucky enough to hear it in person.
Follow the link to find the syllabus, which is a thing of beauty. It looks like this will be available in a digital form for those of us not lucky enough to hear it in person.
As I mentioned three weeks ago, Jevin West and I are developing a sort of followup course to Calling Bullshit.
We've got the basic scrollytelling tech worked out and now need to choose a design.
We're not designers and would like to simply buy an HTML5 template if only for the colors and fonts.
We've got the basic scrollytelling tech worked out and now need to choose a design.
We're not designers and would like to simply buy an HTML5 template if only for the colors and fonts.
December 14, 2024 at 1:22 PM
Calling bullshit - a skill that every applied statistician should master. Unfortunately many of the younger statisticians I’ve worked with sometimes lack the bravery to do so. The book looks like a must-have. #Statistics #StatsSky @carlbergstrom.com @carlzimmer.bsky.social
A common critique of Bayesian methods is that priors are arbitrary. I think that's a good thing. It's an assumption, like much of science.
Better to be explicit about assumptions (i.e., DAGs, priors, etc) than implicit
Better to be explicit about assumptions (i.e., DAGs, priors, etc) than implicit
December 14, 2024 at 6:13 PM
A common critique of Bayesian methods is that priors are arbitrary. I think that's a good thing. It's an assumption, like much of science.
Better to be explicit about assumptions (i.e., DAGs, priors, etc) than implicit
Better to be explicit about assumptions (i.e., DAGs, priors, etc) than implicit
It can be tempting to think of propensity scores as a prediction problem. This is problematic. Why?
In prediction models, any variable that helps can be included.
In causal inference, this can cause bias, e.g., collider bias.
Instead, use a directed acyclic graph (DAG) for variable selection.


December 11, 2024 at 1:49 PM
It can be tempting to think of propensity scores as a prediction problem. This is problematic. Why?
In prediction models, any variable that helps can be included.
In causal inference, this can cause bias, e.g., collider bias.
Instead, use a directed acyclic graph (DAG) for variable selection.
Percentages > 100%...

a man in a suit and tie stands in front of two other men
ALT: a man in a suit and tie stands in front of two other men
media.tenor.com
December 11, 2024 at 2:02 AM
Percentages > 100%...
Fantastic initiative! Especially useful for papers using simulations

In the later stages of getting to do a dream: a fully replicable manuscript.
Every single number, stat, figure, etc. in the manuscript has a complete, open and pushbutton full pipeline all the way from data collection to seeing the number on the page.
Every single number, stat, figure, etc. in the manuscript has a complete, open and pushbutton full pipeline all the way from data collection to seeing the number on the page.
December 11, 2024 at 1:34 AM
Fantastic initiative! Especially useful for papers using simulations
Choosing a causal estimand is important. Why?
To make sure the research question is answered!
Certain methods can only estimate specific estimands. This is important when comparing methods.
Let's use an example.
Imagine we want to compare two methods:
1/3
To make sure the research question is answered!
Certain methods can only estimate specific estimands. This is important when comparing methods.
Let's use an example.
Imagine we want to compare two methods:
1/3


December 9, 2024 at 6:43 PM
Choosing a causal estimand is important. Why?
To make sure the research question is answered!
Certain methods can only estimate specific estimands. This is important when comparing methods.
Let's use an example.
Imagine we want to compare two methods:
1/3
To make sure the research question is answered!
Certain methods can only estimate specific estimands. This is important when comparing methods.
Let's use an example.
Imagine we want to compare two methods:
1/3
The best way to improve your analysis:
Plot your data
Plot your data
December 8, 2024 at 10:07 PM
The best way to improve your analysis:
Plot your data
Plot your data
Too accurate

December 7, 2024 at 1:56 PM
Too accurate
This is a good example of how Bayes & Frequentist methods are different paradigms of stats.
Not unlike calculus vs linear algebra.
Both useful, but mixing them is problematic.
Not unlike calculus vs linear algebra.
Both useful, but mixing them is problematic.

I’m excited that more folks are using Bayesian statistics but y’all gotta stop sending me these blunder years papers to review that have like a Bayesian model and some hacked analogue of a p-value with a dynamite plot.
December 6, 2024 at 4:58 PM
This is a good example of how Bayes & Frequentist methods are different paradigms of stats.
Not unlike calculus vs linear algebra.
Both useful, but mixing them is problematic.
Not unlike calculus vs linear algebra.
Both useful, but mixing them is problematic.
Nominal coverage helped me with confidence intervals:
If you repeat an analysis 1,000 times, nominal coverage is the % of intervals that capture the true effect.
For 95% CIs, we'd expect ~950/1,000 to include the true value. It's a long-run frequency idea, not a guarantee for any single interval!
If you repeat an analysis 1,000 times, nominal coverage is the % of intervals that capture the true effect.
For 95% CIs, we'd expect ~950/1,000 to include the true value. It's a long-run frequency idea, not a guarantee for any single interval!

December 6, 2024 at 3:09 PM
Nominal coverage helped me with confidence intervals:
If you repeat an analysis 1,000 times, nominal coverage is the % of intervals that capture the true effect.
For 95% CIs, we'd expect ~950/1,000 to include the true value. It's a long-run frequency idea, not a guarantee for any single interval!
If you repeat an analysis 1,000 times, nominal coverage is the % of intervals that capture the true effect.
For 95% CIs, we'd expect ~950/1,000 to include the true value. It's a long-run frequency idea, not a guarantee for any single interval!
Censoring can result in selection bias for survival data. A solution is to use inverse probability of censoring weights. Why?
IPCW creates a pseudo-population where censoring is independent of certain covariates!
This is similar to how inverse probability of treatment weighting works.
1/n
IPCW creates a pseudo-population where censoring is independent of certain covariates!
This is similar to how inverse probability of treatment weighting works.
1/n
December 5, 2024 at 6:20 PM
Censoring can result in selection bias for survival data. A solution is to use inverse probability of censoring weights. Why?
IPCW creates a pseudo-population where censoring is independent of certain covariates!
This is similar to how inverse probability of treatment weighting works.
1/n
IPCW creates a pseudo-population where censoring is independent of certain covariates!
This is similar to how inverse probability of treatment weighting works.
1/n
Reposted by Ryan Batten, PhD(c)
Finally, another real advantage of causal inference is that you will better recognise situations where you cannot actually estimate the causal effect you are interested in, in any reliable way. So it is a good way to avoid doing things that are hopeless
December 5, 2024 at 7:55 AM
Finally, another real advantage of causal inference is that you will better recognise situations where you cannot actually estimate the causal effect you are interested in, in any reliable way. So it is a good way to avoid doing things that are hopeless
Reposted by Ryan Batten, PhD(c)
#Statistics and #RStats thought of the day: Before analyzing data or doing multiple imputation, explore missingness extents and patterns in your data: hbiostat.org/rflow/missing - see especially the interactive NA Combinations tab. #StatsSky
R Workflow - 6 Missing Data
hbiostat.org
November 24, 2024 at 12:49 PM
#Statistics and #RStats thought of the day: Before analyzing data or doing multiple imputation, explore missingness extents and patterns in your data: hbiostat.org/rflow/missing - see especially the interactive NA Combinations tab. #StatsSky
Statistical Rethinking is such a fantastic name.
Really has changed the way I think (at least so far, ~80% of the way through the book)
Really has changed the way I think (at least so far, ~80% of the way through the book)
December 4, 2024 at 12:46 AM
Statistical Rethinking is such a fantastic name.
Really has changed the way I think (at least so far, ~80% of the way through the book)
Really has changed the way I think (at least so far, ~80% of the way through the book)
Reposted by Ryan Batten, PhD(c)
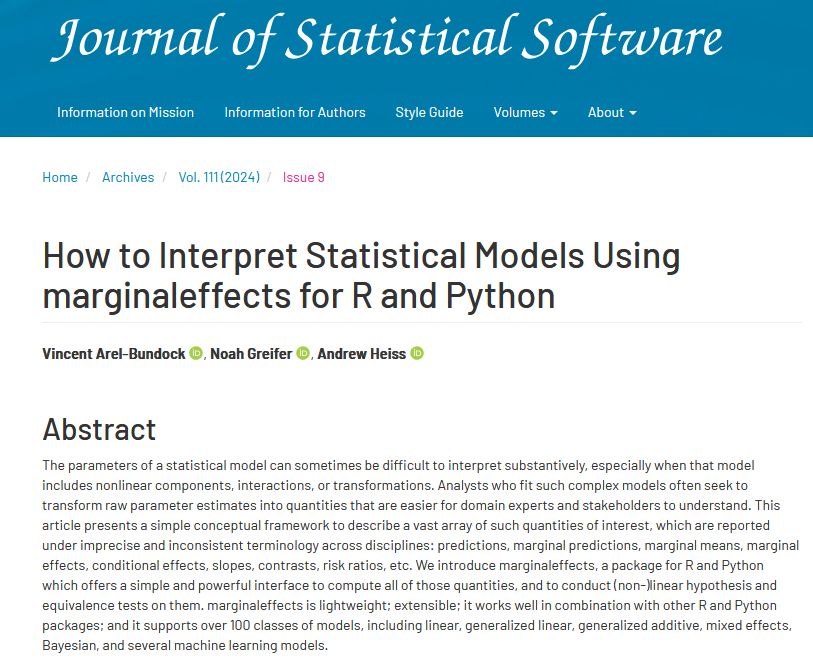
The {marginaleffects} package is an EXTREMELY useful tool for R & Python users that revolutionises the interpretation of models with complicated non-linear features.
Be sure to check out this introduction from @vincentab.bsky.social, @noahgreifer.bsky.social. and @andrew.heiss.phd!
#EpiSky
Be sure to check out this introduction from @vincentab.bsky.social, @noahgreifer.bsky.social. and @andrew.heiss.phd!
#EpiSky

Our JSS article is out!
And now I get to focus on {marginaleffects} 1.0.0. Stay tuned.
www.jstatsoft.org/article/view...
And now I get to focus on {marginaleffects} 1.0.0. Stay tuned.
www.jstatsoft.org/article/view...
December 2, 2024 at 12:19 AM
The {marginaleffects} package is an EXTREMELY useful tool for R & Python users that revolutionises the interpretation of models with complicated non-linear features.
Be sure to check out this introduction from @vincentab.bsky.social, @noahgreifer.bsky.social. and @andrew.heiss.phd!
#EpiSky
Be sure to check out this introduction from @vincentab.bsky.social, @noahgreifer.bsky.social. and @andrew.heiss.phd!
#EpiSky
The more experience I get, the more I appreciate George Box's quote
"All models are wrong, but some are useful"
"All models are wrong, but some are useful"
November 28, 2024 at 10:33 PM
The more experience I get, the more I appreciate George Box's quote
"All models are wrong, but some are useful"
"All models are wrong, but some are useful"
Causal inference, DAGs especially, force you to be explicit about the assumptions you're making.
Learning about Bayesian statistics, feels like it's similar
Learning about Bayesian statistics, feels like it's similar
November 27, 2024 at 8:13 PM
Causal inference, DAGs especially, force you to be explicit about the assumptions you're making.
Learning about Bayesian statistics, feels like it's similar
Learning about Bayesian statistics, feels like it's similar
Reposted by Ryan Batten, PhD(c)
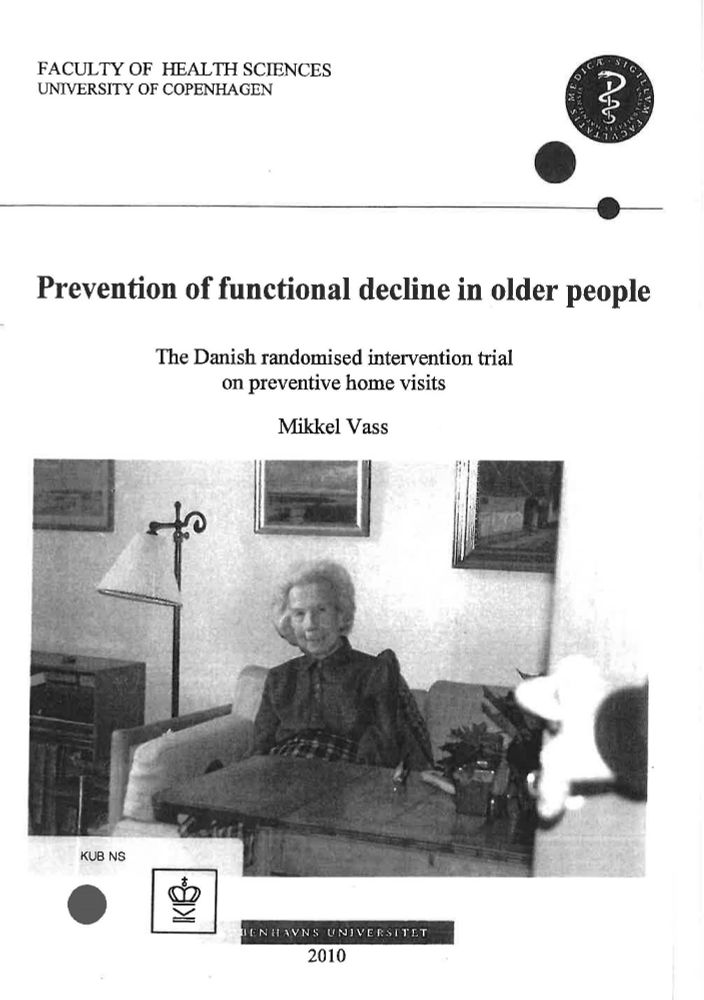
Does #randomization ensures balance of risk factors between groups? Consider this:
In Denmark 860 individuals were randomly allocated to either intervention or control. Individuals were unaware of their allocation. No intervention took place. Mortality was higher in the intervention group (p=0.003)
In Denmark 860 individuals were randomly allocated to either intervention or control. Individuals were unaware of their allocation. No intervention took place. Mortality was higher in the intervention group (p=0.003)
November 26, 2024 at 1:38 PM
Does #randomization ensures balance of risk factors between groups? Consider this:
In Denmark 860 individuals were randomly allocated to either intervention or control. Individuals were unaware of their allocation. No intervention took place. Mortality was higher in the intervention group (p=0.003)
In Denmark 860 individuals were randomly allocated to either intervention or control. Individuals were unaware of their allocation. No intervention took place. Mortality was higher in the intervention group (p=0.003)
Reposted by Ryan Batten, PhD(c)
My advice (for what little it's worth): pick a topic that interests you, pick statistics you can practice, and apply it there. Read widely and be judicious in who you follow and take advice from on social media.
Importantly: have fun while doing it. If you aren't having fun, you won't pursue it
Importantly: have fun while doing it. If you aren't having fun, you won't pursue it
November 24, 2024 at 5:37 PM
My advice (for what little it's worth): pick a topic that interests you, pick statistics you can practice, and apply it there. Read widely and be judicious in who you follow and take advice from on social media.
Importantly: have fun while doing it. If you aren't having fun, you won't pursue it
Importantly: have fun while doing it. If you aren't having fun, you won't pursue it
Simulation has now become my default to answer questions.
Any stats question I'm curious about? Or situation I don't know about?
Head straight to the sim-mobile
Any stats question I'm curious about? Or situation I don't know about?
Head straight to the sim-mobile
November 19, 2024 at 3:46 PM
Simulation has now become my default to answer questions.
Any stats question I'm curious about? Or situation I don't know about?
Head straight to the sim-mobile
Any stats question I'm curious about? Or situation I don't know about?
Head straight to the sim-mobile