


Polar Jane
@jfrumble.bsky.social
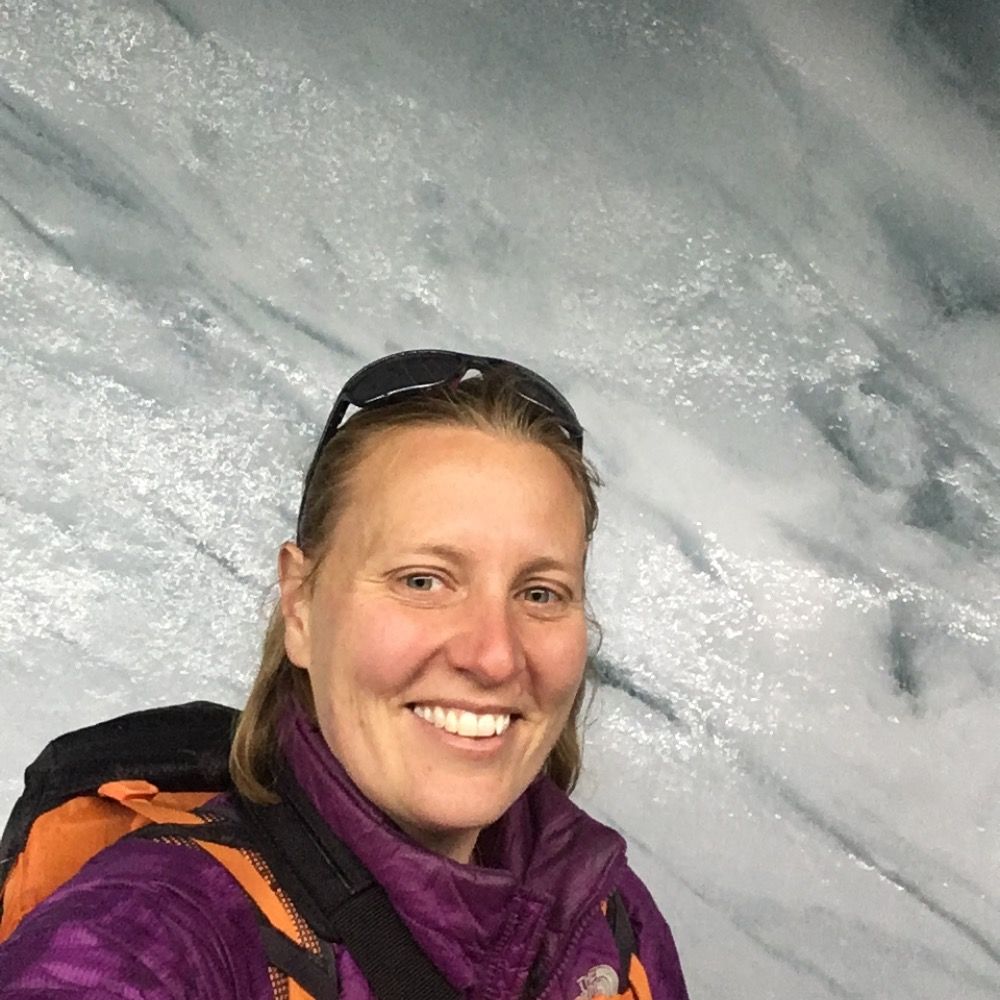
All things Polar... OBE, FRGS, D.Sc (h.c), Back Award 2023. Arrived at 328.28ppm CO2. My point is at 64°37′30″S, 62°33′15″W.
Reposted by Polar Jane

#PolarPride Reminder: Diversity enriches teams like mixing water masses enriches the Southern Ocean. Different sources, one powerful system. 🌊🌈
The Southern Ocean connects the planet —Polar Pride reminds us that inclusive science is stronger science.
#PolarPride #ScienceIsForEveryone #LGBTQinSTEM
The Southern Ocean connects the planet —Polar Pride reminds us that inclusive science is stronger science.
#PolarPride #ScienceIsForEveryone #LGBTQinSTEM

November 18, 2025 at 12:32 AM
#PolarPride Reminder: Diversity enriches teams like mixing water masses enriches the Southern Ocean. Different sources, one powerful system. 🌊🌈
The Southern Ocean connects the planet —Polar Pride reminds us that inclusive science is stronger science.
#PolarPride #ScienceIsForEveryone #LGBTQinSTEM
The Southern Ocean connects the planet —Polar Pride reminds us that inclusive science is stronger science.
#PolarPride #ScienceIsForEveryone #LGBTQinSTEM
Reposted by Polar Jane
Happy #PolarPride!
Visibility and diversity are so important 🏳️🌈✨
I’m proud to be in a field that celebrates the LGBTQ+ community 🌈🧪🐋 #LGBTQinSTEM #DiversityInPolarScience
Visibility and diversity are so important 🏳️🌈✨
I’m proud to be in a field that celebrates the LGBTQ+ community 🌈🧪🐋 #LGBTQinSTEM #DiversityInPolarScience


November 18, 2025 at 10:16 AM
Happy #PolarPride!
Visibility and diversity are so important 🏳️🌈✨
I’m proud to be in a field that celebrates the LGBTQ+ community 🌈🧪🐋 #LGBTQinSTEM #DiversityInPolarScience
Visibility and diversity are so important 🏳️🌈✨
I’m proud to be in a field that celebrates the LGBTQ+ community 🌈🧪🐋 #LGBTQinSTEM #DiversityInPolarScience
Reposted by Polar Jane
Happy Polar Pride!
This year I'd like to draw attention to @500qs.bsky.social - an awesome campaign for making LGBTQ+ people in STEM more visible!
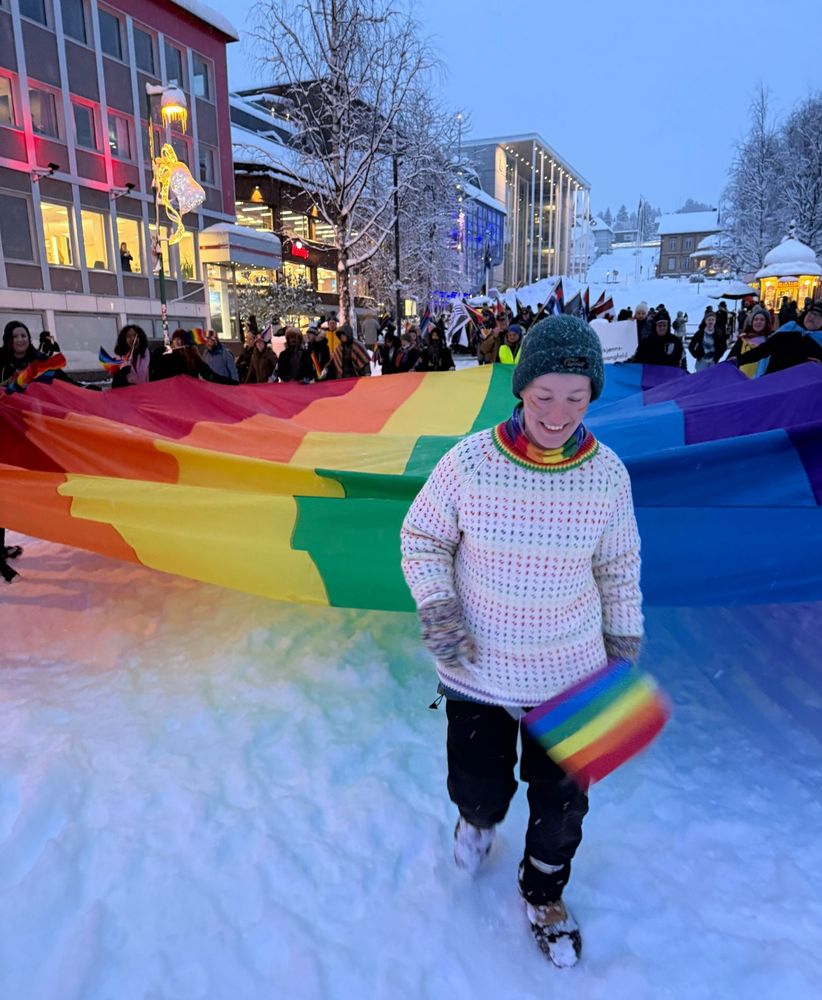
Coincidentally, happy to have played a part making Arctic Pride happen here in Tromsø last week 🏳️🌈 #polarpride #LGBTQinSTEM #DiversityInPolarScience
This year I'd like to draw attention to @500qs.bsky.social - an awesome campaign for making LGBTQ+ people in STEM more visible!
Coincidentally, happy to have played a part making Arctic Pride happen here in Tromsø last week 🏳️🌈 #polarpride #LGBTQinSTEM #DiversityInPolarScience
November 18, 2025 at 9:48 AM
Happy Polar Pride!
This year I'd like to draw attention to @500qs.bsky.social - an awesome campaign for making LGBTQ+ people in STEM more visible!
Coincidentally, happy to have played a part making Arctic Pride happen here in Tromsø last week 🏳️🌈 #polarpride #LGBTQinSTEM #DiversityInPolarScience
This year I'd like to draw attention to @500qs.bsky.social - an awesome campaign for making LGBTQ+ people in STEM more visible!
Coincidentally, happy to have played a part making Arctic Pride happen here in Tromsø last week 🏳️🌈 #polarpride #LGBTQinSTEM #DiversityInPolarScience
Reposted by Polar Jane
Happy #PolarPride 2025! Celebrate diversity and the contributions of LGBTQIA+ people to polar science!


November 18, 2025 at 10:18 AM
Happy #PolarPride 2025! Celebrate diversity and the contributions of LGBTQIA+ people to polar science!
Reposted by Polar Jane
Happy #PolarPride Day! Celebrating the 🇬🇧 #Polar community's support for #DiversityInPolarScience. #TeamPolar remain committed to ensuring everyone involved in understanding and protecting the #Arctic and #Antarctic feels included and respected 🐧🥶🐻❄🌈

November 18, 2025 at 11:47 AM
Happy #PolarPride Day! Celebrating the 🇬🇧 #Polar community's support for #DiversityInPolarScience. #TeamPolar remain committed to ensuring everyone involved in understanding and protecting the #Arctic and #Antarctic feels included and respected 🐧🥶🐻❄🌈
Happy #PolarPride Day! Celebrating the 🇬🇧 #Polar community's support for #DiversityInPolarScience. #TeamPolar remain committed to ensuring everyone involved in understanding and protecting the #Arctic and #Antarctic feels included and respected 🐧🥶🐻❄🌈
November 18, 2025 at 11:47 AM
Happy #PolarPride Day! Celebrating the 🇬🇧 #Polar community's support for #DiversityInPolarScience. #TeamPolar remain committed to ensuring everyone involved in understanding and protecting the #Arctic and #Antarctic feels included and respected 🐧🥶🐻❄🌈
Reposted by Polar Jane
Celebrating 99 years of Sir David Attenborough! Sir David continues to bring the beauty, and challenges, of Antarctica to peoples' homes and we cannot thank him enough for raising awareness for this amazing continent 💙🐧
a man in a red jacket with the words we are changing the world so rapidly
ALT: a man in a red jacket with the words we are changing the world so rapidly
media.tenor.com
May 8, 2025 at 10:10 AM
Celebrating 99 years of Sir David Attenborough! Sir David continues to bring the beauty, and challenges, of Antarctica to peoples' homes and we cannot thank him enough for raising awareness for this amazing continent 💙🐧
Reposted by Polar Jane
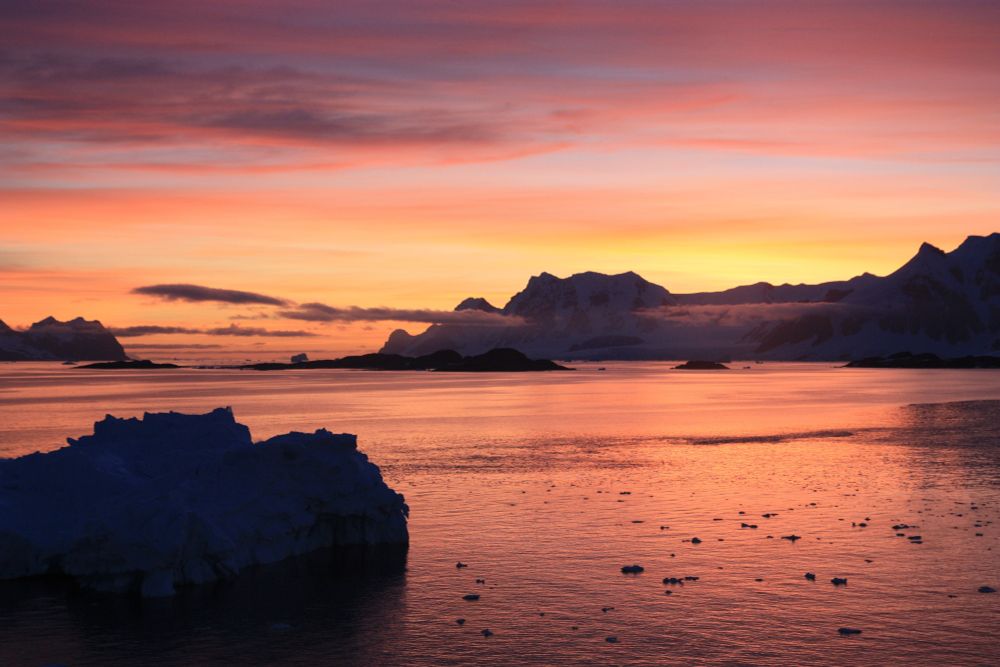
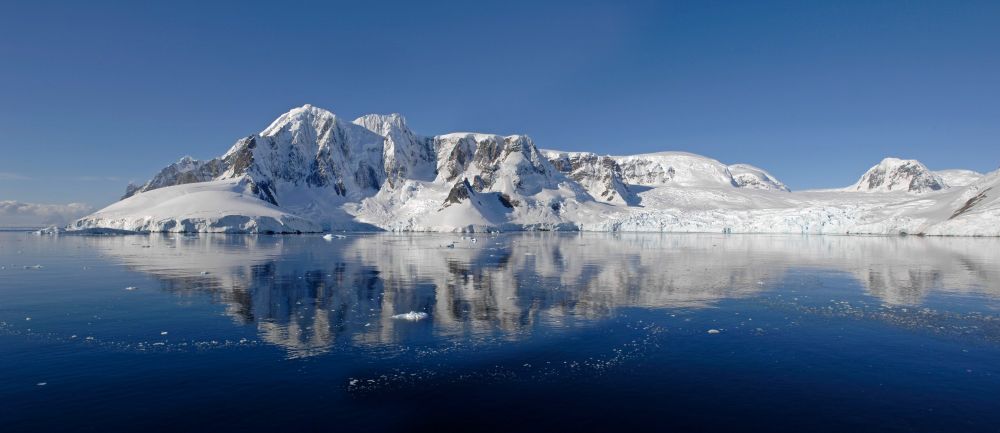
#EarthDay is a great day to stop and reflect on the unique Antarctic environment. We would love to see some of your favourite Antarctic images. Here are a few of ours to start 🐧🧊🌍


April 22, 2025 at 10:19 AM
#EarthDay is a great day to stop and reflect on the unique Antarctic environment. We would love to see some of your favourite Antarctic images. Here are a few of ours to start 🐧🧊🌍
Reposted by Polar Jane
🧪🌊The world's largest iceberg, A23a, which ran aground on the edge of the South Georgia continental shelf two months ago, has started to break up. Ten days ago a fragment calved from its SW corner and has drifted away rapidly eastwards. The fragment is itself immense, measuring 19 km in length.
April 21, 2025 at 6:10 PM
🧪🌊The world's largest iceberg, A23a, which ran aground on the edge of the South Georgia continental shelf two months ago, has started to break up. Ten days ago a fragment calved from its SW corner and has drifted away rapidly eastwards. The fragment is itself immense, measuring 19 km in length.
Reposted by Polar Jane
A driving force for change. This morning we met with Antarctic tour operators and scientists to discuss tourism to the continent and a potential framework for all Treaty Parties. Thank you to @hx-expeditions.bsky.social for hosting us and looking forward to continuing discussions 🐧

April 1, 2025 at 2:45 PM
A driving force for change. This morning we met with Antarctic tour operators and scientists to discuss tourism to the continent and a potential framework for all Treaty Parties. Thank you to @hx-expeditions.bsky.social for hosting us and looking forward to continuing discussions 🐧
Reposted by Polar Jane
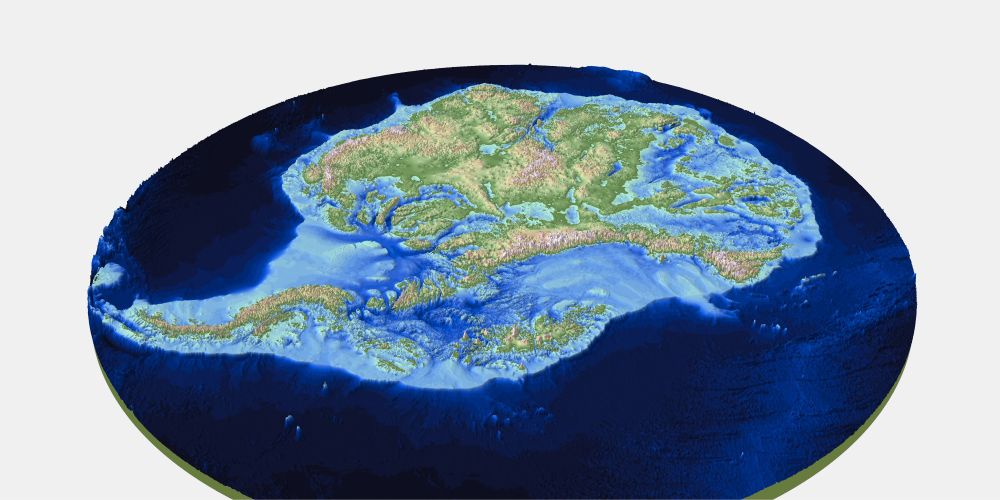
We’ve just published the most detailed map yet of the landscape beneath Antarctica’s ice sheet (called Bedmap3), and we learnt some pretty cool facts about Antarctica that you can use to impress your pals. Ready?
Graphic: Hamish Pritchard et al
Graphic: Hamish Pritchard et al
March 14, 2025 at 3:18 PM
We’ve just published the most detailed map yet of the landscape beneath Antarctica’s ice sheet (called Bedmap3), and we learnt some pretty cool facts about Antarctica that you can use to impress your pals. Ready?
Graphic: Hamish Pritchard et al
Graphic: Hamish Pritchard et al
Reposted by Polar Jane
This #PancakeDay here's our recipe for pancake ice:
🧊 Get some ice forming on the top of your water
🌊 Bump bits of ice together with small waves
♻️ This rounds their edges as they freeze!
🥞 Grow the disc edges with trapped frozen foam
These pancakes will be up to 3m wide + 10m thick.
Bon Appétit 👩🍳
🧊 Get some ice forming on the top of your water
🌊 Bump bits of ice together with small waves
♻️ This rounds their edges as they freeze!
🥞 Grow the disc edges with trapped frozen foam
These pancakes will be up to 3m wide + 10m thick.
Bon Appétit 👩🍳

March 4, 2025 at 10:20 AM
This #PancakeDay here's our recipe for pancake ice:
🧊 Get some ice forming on the top of your water
🌊 Bump bits of ice together with small waves
♻️ This rounds their edges as they freeze!
🥞 Grow the disc edges with trapped frozen foam
These pancakes will be up to 3m wide + 10m thick.
Bon Appétit 👩🍳
🧊 Get some ice forming on the top of your water
🌊 Bump bits of ice together with small waves
♻️ This rounds their edges as they freeze!
🥞 Grow the disc edges with trapped frozen foam
These pancakes will be up to 3m wide + 10m thick.
Bon Appétit 👩🍳
Today is #InternationalPolarBearDay 🐻❄ so it seems like a good day to give a shout out to everyone who lives and works in the #Arctic, and those who strive to understand, promote, and where needed, protect the vulnerable habitats of this majestic creature 🥶❄️😎

February 27, 2025 at 12:12 PM
Today is #InternationalPolarBearDay 🐻❄ so it seems like a good day to give a shout out to everyone who lives and works in the #Arctic, and those who strive to understand, promote, and where needed, protect the vulnerable habitats of this majestic creature 🥶❄️😎
Reposted by Polar Jane
We are excited to join the Waddle! A special valentines shout out to everyone engaged on polar science, policy, engagement and protection here on Bluesky, let's share the love 💙🐧🔬📝

February 14, 2025 at 11:38 AM
We are excited to join the Waddle! A special valentines shout out to everyone engaged on polar science, policy, engagement and protection here on Bluesky, let's share the love 💙🐧🔬📝
Reposted by Polar Jane

🚨 December 2024 #Arctic sea ice extent was the *lowest* on record for the month...
This was 1,420,000 km² below the 1981-2010 average. December ice extent is decreasing at about 3.43% per decade. Data: nsidc.org/data/seaice_... 🌊
This was 1,420,000 km² below the 1981-2010 average. December ice extent is decreasing at about 3.43% per decade. Data: nsidc.org/data/seaice_... 🌊
January 3, 2025 at 1:20 PM
🚨 December 2024 #Arctic sea ice extent was the *lowest* on record for the month...
This was 1,420,000 km² below the 1981-2010 average. December ice extent is decreasing at about 3.43% per decade. Data: nsidc.org/data/seaice_... 🌊
This was 1,420,000 km² below the 1981-2010 average. December ice extent is decreasing at about 3.43% per decade. Data: nsidc.org/data/seaice_... 🌊
Reposted by Polar Jane
Friday ice update - #Arctic sea ice extent is currently the *lowest* on record (JAXA data)...
• about 820,000 km² below the 2010s mean
• about 1,300,000 km² below the 2000s mean
• about 1,880,000 km² below the 1990s mean
• about 2,340,000 km² below the 1980s mean
Plots zacklabe.com/arctic-sea-i...
• about 820,000 km² below the 2010s mean
• about 1,300,000 km² below the 2000s mean
• about 1,880,000 km² below the 1990s mean
• about 2,340,000 km² below the 1980s mean
Plots zacklabe.com/arctic-sea-i...

December 13, 2024 at 7:03 PM
Friday ice update - #Arctic sea ice extent is currently the *lowest* on record (JAXA data)...
• about 820,000 km² below the 2010s mean
• about 1,300,000 km² below the 2000s mean
• about 1,880,000 km² below the 1990s mean
• about 2,340,000 km² below the 1980s mean
Plots zacklabe.com/arctic-sea-i...
• about 820,000 km² below the 2010s mean
• about 1,300,000 km² below the 2000s mean
• about 1,880,000 km² below the 1990s mean
• about 2,340,000 km² below the 1980s mean
Plots zacklabe.com/arctic-sea-i...
Reposted by Polar Jane
🚨 Last month averaged the lowest #Antarctic sea ice extent on record for the month of November.
This was 1,710,000 km² below the 1981-2010 average. Data from NSIDC: nsidc.org/data/seaice_...
This was 1,710,000 km² below the 1981-2010 average. Data from NSIDC: nsidc.org/data/seaice_...
December 4, 2024 at 1:30 AM
🚨 Last month averaged the lowest #Antarctic sea ice extent on record for the month of November.
This was 1,710,000 km² below the 1981-2010 average. Data from NSIDC: nsidc.org/data/seaice_...
This was 1,710,000 km² below the 1981-2010 average. Data from NSIDC: nsidc.org/data/seaice_...
Reposted by Polar Jane

Looks like the next week will be very warm across nearly the entire Antarctic Ice Sheet with widespread 5-15 C temperature anomalies. Multiple atmospheric rivers in West and East Antarctica will contribute to the heat. Definitely concerning as well are within the melt season


December 3, 2024 at 4:51 PM
Looks like the next week will be very warm across nearly the entire Antarctic Ice Sheet with widespread 5-15 C temperature anomalies. Multiple atmospheric rivers in West and East Antarctica will contribute to the heat. Definitely concerning as well are within the melt season
Reposted by Polar Jane

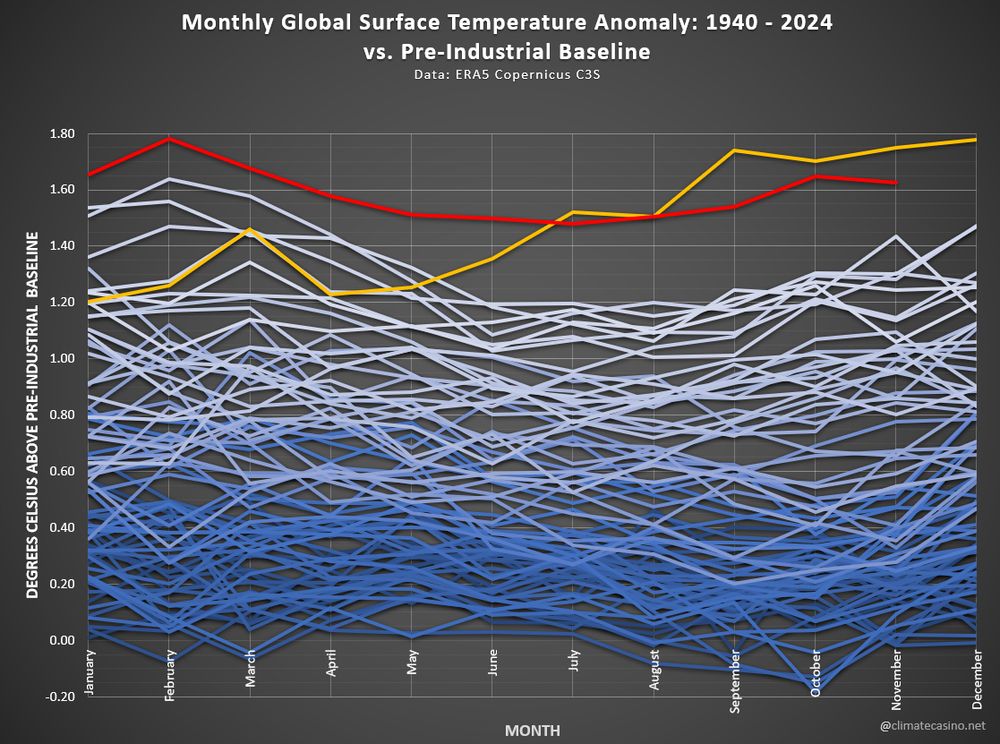
Breaking news!
November, 2024, came in at the second warmest in recorded history, at 1.62°C above the pre-industrial baseline.
Starting in June, 2023, there have now been 18 consecutive months above the pre-2023 record high, likely the hottest string of 18 months in the last 120,000+ years.
November, 2024, came in at the second warmest in recorded history, at 1.62°C above the pre-industrial baseline.
Starting in June, 2023, there have now been 18 consecutive months above the pre-2023 record high, likely the hottest string of 18 months in the last 120,000+ years.
December 2, 2024 at 1:19 PM
Breaking news!
November, 2024, came in at the second warmest in recorded history, at 1.62°C above the pre-industrial baseline.
Starting in June, 2023, there have now been 18 consecutive months above the pre-2023 record high, likely the hottest string of 18 months in the last 120,000+ years.
November, 2024, came in at the second warmest in recorded history, at 1.62°C above the pre-industrial baseline.
Starting in June, 2023, there have now been 18 consecutive months above the pre-2023 record high, likely the hottest string of 18 months in the last 120,000+ years.
Reposted by Polar Jane

1️⃣ Antarctic Bottom Water (AABW) is the densest water mass in the world ocean due to its high salinity & cold temperatures. Filling the abyss, it accounts for up to 40% of oceanic volume. It plays a vital role in moving cold water toward the equator and regulating global climate.
Animation: NASA SVS
Animation: NASA SVS
November 29, 2024 at 5:31 AM
1️⃣ Antarctic Bottom Water (AABW) is the densest water mass in the world ocean due to its high salinity & cold temperatures. Filling the abyss, it accounts for up to 40% of oceanic volume. It plays a vital role in moving cold water toward the equator and regulating global climate.
Animation: NASA SVS
Animation: NASA SVS
Reposted by Polar Jane

You are seeing the yearly evolution of the average sea surface temperatures in the Atlantic since 1980.
Climate Pulse makes it easy for anyone to explore daily, monthly & yearly global surface air & sea surface temperature data.
Our guide: climate.copernicus.eu/climate-puls...
Climate Pulse makes it easy for anyone to explore daily, monthly & yearly global surface air & sea surface temperature data.
Our guide: climate.copernicus.eu/climate-puls...
November 29, 2024 at 11:12 AM
You are seeing the yearly evolution of the average sea surface temperatures in the Atlantic since 1980.
Climate Pulse makes it easy for anyone to explore daily, monthly & yearly global surface air & sea surface temperature data.
Our guide: climate.copernicus.eu/climate-puls...
Climate Pulse makes it easy for anyone to explore daily, monthly & yearly global surface air & sea surface temperature data.
Our guide: climate.copernicus.eu/climate-puls...
Reposted by Polar Jane
October 2024 data is now available for both Antarctic sea-ice thickness/volume (zacklabe.com/antarctic-se...) and global sea-ice volume (zacklabe.com/global-sea-i...) from GIOMAS
Last month's global sea-ice volume was a record low for the month of October. This continues the stretch of new records
Last month's global sea-ice volume was a record low for the month of October. This continues the stretch of new records

Global: Sea-Ice Concentration/Extent/Thickness
NOTE: Trends and variability in Arctic and Antarctic sea ice are affected by very different atmospheric/oceanic/ice processes and are in opposite seasons! Caution is advised for assessing any stati…
zacklabe.com
November 21, 2024 at 6:14 PM
October 2024 data is now available for both Antarctic sea-ice thickness/volume (zacklabe.com/antarctic-se...) and global sea-ice volume (zacklabe.com/global-sea-i...) from GIOMAS
Last month's global sea-ice volume was a record low for the month of October. This continues the stretch of new records
Last month's global sea-ice volume was a record low for the month of October. This continues the stretch of new records
Reposted by Polar Jane

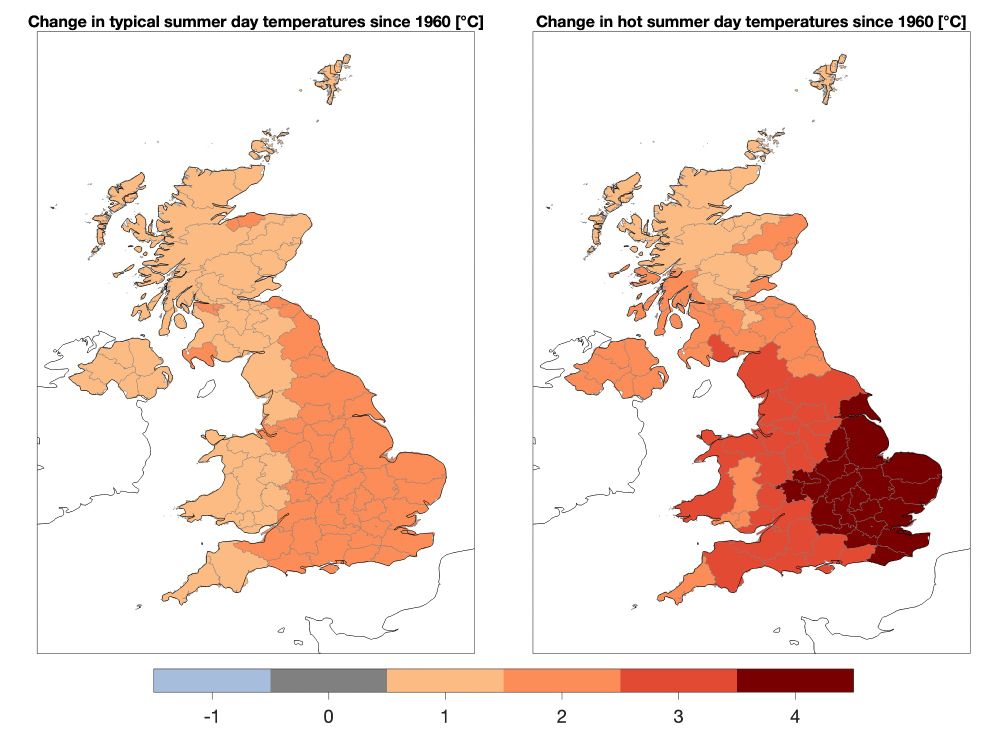
Summer UK temperatures have warmed faster than global average temperature.
But the very hottest days have warmed 4x faster than the global average, especially in south-east England.
Global warming is not "just" 1°C or 2°C. The effects of climate change are non-linear, especially for extremes.
But the very hottest days have warmed 4x faster than the global average, especially in south-east England.
Global warming is not "just" 1°C or 2°C. The effects of climate change are non-linear, especially for extremes.
November 21, 2024 at 10:39 AM
Summer UK temperatures have warmed faster than global average temperature.
But the very hottest days have warmed 4x faster than the global average, especially in south-east England.
Global warming is not "just" 1°C or 2°C. The effects of climate change are non-linear, especially for extremes.
But the very hottest days have warmed 4x faster than the global average, especially in south-east England.
Global warming is not "just" 1°C or 2°C. The effects of climate change are non-linear, especially for extremes.
Reposted by Polar Jane
Aw! Andy! We love this interview with Jane Francis (aka the BAS Boss) too.
Iceworld is our podcast series about the amazing people who live and work in Antarctica - from polar scientists to plumbers.
🎧 You can find it on all good podcast platforms!
Iceworld is our podcast series about the amazing people who live and work in Antarctica - from polar scientists to plumbers.
🎧 You can find it on all good podcast platforms!
Have you ever wondered what it's like to collect fossils on Seymour Island. Or to direct the British Antarctic Survey ? I found this fantastic interview with Jane Francis and it's definitely worth a listen
@bas.ac.uk
audioboom.com/posts/846937...
@bas.ac.uk
audioboom.com/posts/846937...

Leadership and a life on the ice, with Professor Dame Jane Francis
How many people can say they've lost count of their visits to Antarctica? In this special International Women's Day episode, Professor Dame Jane Francis (Director of British Antarctic Survey) ...
audioboom.com
November 20, 2024 at 5:41 PM
Aw! Andy! We love this interview with Jane Francis (aka the BAS Boss) too.
Iceworld is our podcast series about the amazing people who live and work in Antarctica - from polar scientists to plumbers.
🎧 You can find it on all good podcast platforms!
Iceworld is our podcast series about the amazing people who live and work in Antarctica - from polar scientists to plumbers.
🎧 You can find it on all good podcast platforms!
Reposted by Polar Jane
And now a broody but beautiful view from Rothera Research Station today - with rainbow colours for #PolarPride2024

November 18, 2024 at 4:20 PM
And now a broody but beautiful view from Rothera Research Station today - with rainbow colours for #PolarPride2024