


Eric Basmajian
@epbresearch.bsky.social
Why Leading Indicators Failed This Cycle (Or Did They?)
Leading indicators declined for three years with no recession - here is what actually happened.
epbresearch.substack.com/p/why-leadin...
Leading indicators declined for three years with no recession - here is what actually happened.
epbresearch.substack.com/p/why-leadin...

Why Leading Indicators Failed This Cycle (Or Did They?)
Leading indicators declined for three years with no recession - here is what actually happened.
epbresearch.substack.com
January 30, 2026 at 3:12 PM
Why Leading Indicators Failed This Cycle (Or Did They?)
Leading indicators declined for three years with no recession - here is what actually happened.
epbresearch.substack.com/p/why-leadin...
Leading indicators declined for three years with no recession - here is what actually happened.
epbresearch.substack.com/p/why-leadin...
Where U.S. Growth Went
The Hidden Link Between Government Size, Vanishing Net Investment, and Stagnant Real Incomes
open.substack.com/pub/epbresea...
The Hidden Link Between Government Size, Vanishing Net Investment, and Stagnant Real Incomes
open.substack.com/pub/epbresea...

Where U.S. Growth Went
The Hidden Link Between Government Size, Vanishing Net Investment, and Stagnant Real Incomes
open.substack.com
January 20, 2026 at 7:34 PM
Where U.S. Growth Went
The Hidden Link Between Government Size, Vanishing Net Investment, and Stagnant Real Incomes
open.substack.com/pub/epbresea...
The Hidden Link Between Government Size, Vanishing Net Investment, and Stagnant Real Incomes
open.substack.com/pub/epbresea...
Reposted by Eric Basmajian

‘The major question for the economy in 2026 is whether the monetary easing we’ve seen so far is enough to arrest labor market declines in cyclical sectors before they cause downstream stress in the less cyclical areas of the economy.’ blog.epbresearch.com/p/where-the-... by @epbresearch.bsky.social

January 13, 2026 at 6:43 PM
‘The major question for the economy in 2026 is whether the monetary easing we’ve seen so far is enough to arrest labor market declines in cyclical sectors before they cause downstream stress in the less cyclical areas of the economy.’ blog.epbresearch.com/p/where-the-... by @epbresearch.bsky.social
Corporate profit margins are nearly 20%.
Double the 10% level that was seen in the 80s, 90s, and early 00s.
What is going on?
Double the 10% level that was seen in the 80s, 90s, and early 00s.
What is going on?

January 8, 2026 at 2:20 PM
Corporate profit margins are nearly 20%.
Double the 10% level that was seen in the 80s, 90s, and early 00s.
What is going on?
Double the 10% level that was seen in the 80s, 90s, and early 00s.
What is going on?
Reposted by Eric Basmajian

This is a great explainer on what really matters in the business cycle.
TL;DR: Look out for
- Durable Goods Consumption (Consumers)
- Residential Investment (Consumers)
- Business Equipment Investment (Companies)
The rest is noise.
TL;DR: Look out for
- Durable Goods Consumption (Consumers)
- Residential Investment (Consumers)
- Business Equipment Investment (Companies)
The rest is noise.
January 6, 2026 at 2:53 PM
This is a great explainer on what really matters in the business cycle.
TL;DR: Look out for
- Durable Goods Consumption (Consumers)
- Residential Investment (Consumers)
- Business Equipment Investment (Companies)
The rest is noise.
TL;DR: Look out for
- Durable Goods Consumption (Consumers)
- Residential Investment (Consumers)
- Business Equipment Investment (Companies)
The rest is noise.
Reposted by Eric Basmajian
‘It’s clear that the AI-driven investment surge in narrow computer equipment is masking what would otherwise be a broad contraction in the traditional cyclical and interest rate-sensitive sectors.’ blog.epbresearch.com/p/43-gdp-gro... by @epbresearch.bsky.social

December 26, 2025 at 4:11 PM
‘It’s clear that the AI-driven investment surge in narrow computer equipment is masking what would otherwise be a broad contraction in the traditional cyclical and interest rate-sensitive sectors.’ blog.epbresearch.com/p/43-gdp-gro... by @epbresearch.bsky.social
The University of Michigan Current Conditions Index declined to the lowest level in recorded history in December.

December 19, 2025 at 5:26 PM
The University of Michigan Current Conditions Index declined to the lowest level in recorded history in December.
The labor market remains...
No fire (stable initial claims)
No hire (higher unemployment rate)
No fire (stable initial claims)
No hire (higher unemployment rate)

December 11, 2025 at 8:04 PM
The labor market remains...
No fire (stable initial claims)
No hire (higher unemployment rate)
No fire (stable initial claims)
No hire (higher unemployment rate)
You could have seen the 2008 recession coming.
A global banking crisis? Not so much.
Here are three charts that signaled the recession 18 months early.
blog.epbresearch.com/p/you-could-...
A global banking crisis? Not so much.
Here are three charts that signaled the recession 18 months early.
blog.epbresearch.com/p/you-could-...

You Could Have Seen 2008 Coming. Here's Exactly How.
The three charts that signaled the recession 18 months early.
blog.epbresearch.com
December 11, 2025 at 7:58 PM
You could have seen the 2008 recession coming.
A global banking crisis? Not so much.
Here are three charts that signaled the recession 18 months early.
blog.epbresearch.com/p/you-could-...
A global banking crisis? Not so much.
Here are three charts that signaled the recession 18 months early.
blog.epbresearch.com/p/you-could-...
For the private sector, the job opening rate is stable.
Hiring rate and quits are remain extremely weak while the layoff rate ticked up slightly.
It remains an extremely tough labor market for new entrants and those looking for a job.
Layoffs are still generally low.
Hiring rate and quits are remain extremely weak while the layoff rate ticked up slightly.
It remains an extremely tough labor market for new entrants and those looking for a job.
Layoffs are still generally low.

December 9, 2025 at 3:30 PM
For the private sector, the job opening rate is stable.
Hiring rate and quits are remain extremely weak while the layoff rate ticked up slightly.
It remains an extremely tough labor market for new entrants and those looking for a job.
Layoffs are still generally low.
Hiring rate and quits are remain extremely weak while the layoff rate ticked up slightly.
It remains an extremely tough labor market for new entrants and those looking for a job.
Layoffs are still generally low.
Production of consumer autos & trucks is declining sharply 📉
Production of business vehicles is exploding 📈
What's the best explanation for this?
Production of business vehicles is exploding 📈
What's the best explanation for this?

December 6, 2025 at 5:40 PM
Production of consumer autos & trucks is declining sharply 📉
Production of business vehicles is exploding 📈
What's the best explanation for this?
Production of business vehicles is exploding 📈
What's the best explanation for this?
The 20% of the Economy That Drives 100% of Recessions
Why conventional analysis fails — and the three sectors you should actually be watching.
epbresearch.substack.com/p/the-20-of-...
Why conventional analysis fails — and the three sectors you should actually be watching.
epbresearch.substack.com/p/the-20-of-...

The 20% of the Economy That Drives 100% of Recessions
Why conventional analysis fails — and the three sectors you should actually be watching.
epbresearch.substack.com
December 6, 2025 at 4:01 PM
The 20% of the Economy That Drives 100% of Recessions
Why conventional analysis fails — and the three sectors you should actually be watching.
epbresearch.substack.com/p/the-20-of-...
Why conventional analysis fails — and the three sectors you should actually be watching.
epbresearch.substack.com/p/the-20-of-...
Government transfer payments account for almost 20% of total personal income.
But roughly 60% of those transfer payments are directed at the older demographic (Social Security and Medicare).
But roughly 60% of those transfer payments are directed at the older demographic (Social Security and Medicare).
December 2, 2025 at 5:58 PM
Government transfer payments account for almost 20% of total personal income.
But roughly 60% of those transfer payments are directed at the older demographic (Social Security and Medicare).
But roughly 60% of those transfer payments are directed at the older demographic (Social Security and Medicare).
Unemployment rate trends by age cohort.

November 20, 2025 at 6:50 PM
Unemployment rate trends by age cohort.
Sizable increase in the unemployment rate in September, despite better nonfarm payroll gains.

November 20, 2025 at 4:06 PM
Sizable increase in the unemployment rate in September, despite better nonfarm payroll gains.
The wealth concentration continues.

November 18, 2025 at 8:46 PM
The wealth concentration continues.
Where will the effective tariff rate settle at the end of the year?

August 22, 2025 at 8:18 PM
Where will the effective tariff rate settle at the end of the year?
The housing inventory situation in New York is laughably bad.
Among the worst in the country.
Among the worst in the country.

August 13, 2025 at 1:39 PM
The housing inventory situation in New York is laughably bad.
Among the worst in the country.
Among the worst in the country.
California has about 4% less active inventory in 2025 compared to pre-pandemic.
However, the inventory profile is very different across the state.
This chart breaks down the metro-level inventory data across California.
You can see which areas are better/worse than average.
However, the inventory profile is very different across the state.
This chart breaks down the metro-level inventory data across California.
You can see which areas are better/worse than average.

August 12, 2025 at 12:18 AM
California has about 4% less active inventory in 2025 compared to pre-pandemic.
However, the inventory profile is very different across the state.
This chart breaks down the metro-level inventory data across California.
You can see which areas are better/worse than average.
However, the inventory profile is very different across the state.
This chart breaks down the metro-level inventory data across California.
You can see which areas are better/worse than average.
We just released a new video update on residential construction & home prices.
It covers the full housing cycle & highlights major regional disparities in inventory & price trends.
If you're interested in reports like this, you can find more info here: epbresearch.com/services/
It covers the full housing cycle & highlights major regional disparities in inventory & price trends.
If you're interested in reports like this, you can find more info here: epbresearch.com/services/
August 8, 2025 at 3:44 PM
We just released a new video update on residential construction & home prices.
It covers the full housing cycle & highlights major regional disparities in inventory & price trends.
If you're interested in reports like this, you can find more info here: epbresearch.com/services/
It covers the full housing cycle & highlights major regional disparities in inventory & price trends.
If you're interested in reports like this, you can find more info here: epbresearch.com/services/
Initial jobless claims have been stabilizing over the last few weeks.
Less so for the insured UR rate.
Less so for the insured UR rate.
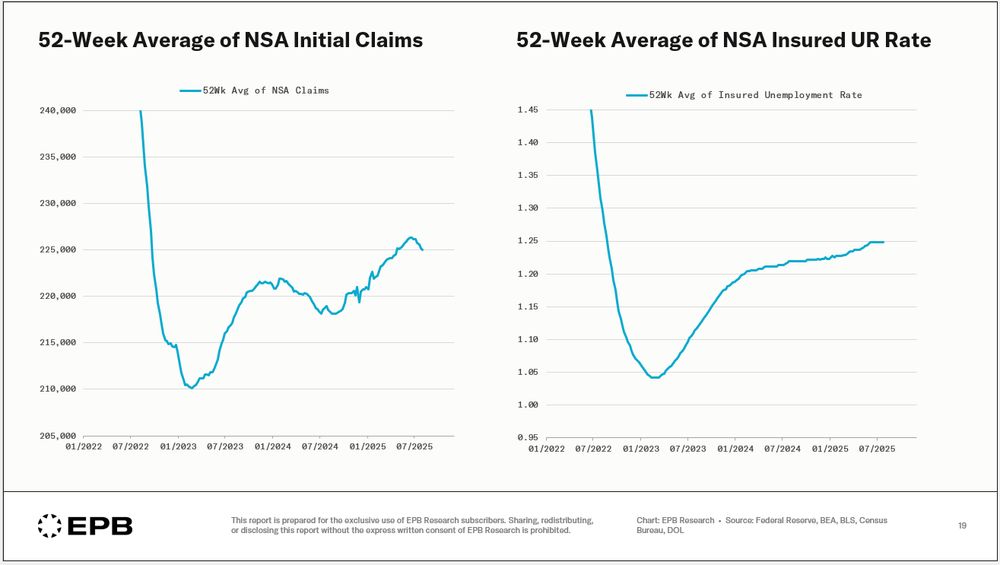
August 7, 2025 at 6:19 PM
Initial jobless claims have been stabilizing over the last few weeks.
Less so for the insured UR rate.
Less so for the insured UR rate.
Reposted by Eric Basmajian

Something important you probably missed in the last jobs report:
Construction and manufacturing employment just turned negative YoY, a classic recession signal.
Credit to @epbresearch.bsky.social for this, the kind of signal Alethia is built to highlight.
writings.alethia.news/cyclical-job...
Construction and manufacturing employment just turned negative YoY, a classic recession signal.
Credit to @epbresearch.bsky.social for this, the kind of signal Alethia is built to highlight.
writings.alethia.news/cyclical-job...

Cyclical Job Losses Begin: Why It Matters More Than the Headline Jobs Number
You won’t find this chart in the headlines, but it might be the most important signal in last week’s employment report.
Construction and manufacturing payrolls just turned negative year-over-year. Th...
writings.alethia.news
August 5, 2025 at 6:45 PM
Something important you probably missed in the last jobs report:
Construction and manufacturing employment just turned negative YoY, a classic recession signal.
Credit to @epbresearch.bsky.social for this, the kind of signal Alethia is built to highlight.
writings.alethia.news/cyclical-job...
Construction and manufacturing employment just turned negative YoY, a classic recession signal.
Credit to @epbresearch.bsky.social for this, the kind of signal Alethia is built to highlight.
writings.alethia.news/cyclical-job...
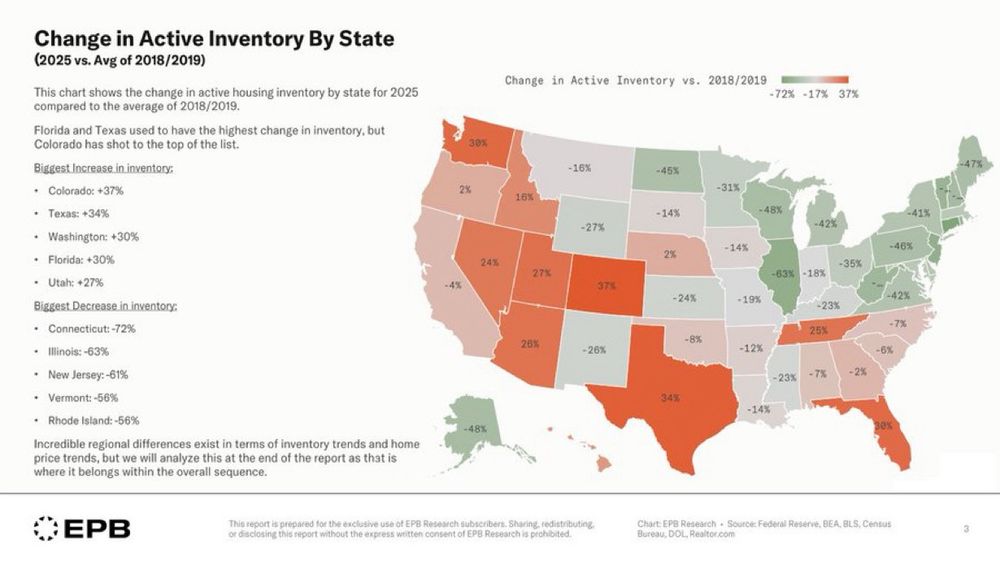
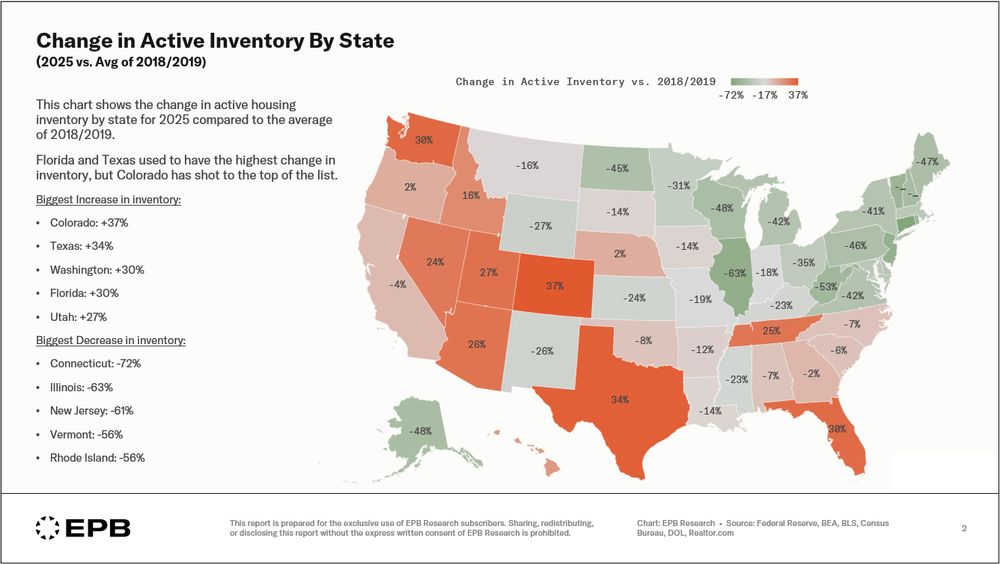
Our next EPB update focuses on residential construction and home prices.
This chart shows active housing inventory in 2025 compared to 2018/2019 levels.
This is the one of the largest variations in inventory and home prices by geography or region in history.
This chart shows active housing inventory in 2025 compared to 2018/2019 levels.
This is the one of the largest variations in inventory and home prices by geography or region in history.
August 5, 2025 at 3:01 PM
Our next EPB update focuses on residential construction and home prices.
This chart shows active housing inventory in 2025 compared to 2018/2019 levels.
This is the one of the largest variations in inventory and home prices by geography or region in history.
This chart shows active housing inventory in 2025 compared to 2018/2019 levels.
This is the one of the largest variations in inventory and home prices by geography or region in history.
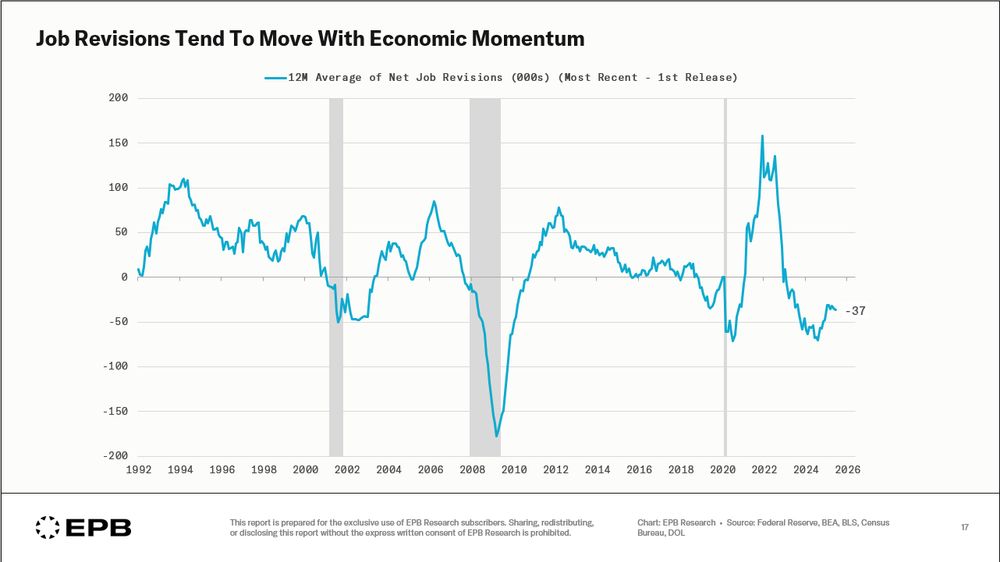
Two comments about the labor data and political noise surrounding revisions:
1] Establishment survey nonfarm payroll revisions tend to move with economic momentum (so much that rolling revisions look like an economic indicator)
2] The unemployment rate is much less revised.
1] Establishment survey nonfarm payroll revisions tend to move with economic momentum (so much that rolling revisions look like an economic indicator)
2] The unemployment rate is much less revised.
August 3, 2025 at 11:21 AM
Two comments about the labor data and political noise surrounding revisions:
1] Establishment survey nonfarm payroll revisions tend to move with economic momentum (so much that rolling revisions look like an economic indicator)
2] The unemployment rate is much less revised.
1] Establishment survey nonfarm payroll revisions tend to move with economic momentum (so much that rolling revisions look like an economic indicator)
2] The unemployment rate is much less revised.