


Eric Basmajian
@epbresearch.bsky.social
Unemployment rate trends by age cohort.

November 20, 2025 at 6:50 PM
Unemployment rate trends by age cohort.
Sizable increase in the unemployment rate in September, despite better nonfarm payroll gains.

November 20, 2025 at 4:06 PM
Sizable increase in the unemployment rate in September, despite better nonfarm payroll gains.
The wealth concentration continues.

November 18, 2025 at 8:46 PM
The wealth concentration continues.
Where will the effective tariff rate settle at the end of the year?

August 22, 2025 at 8:18 PM
Where will the effective tariff rate settle at the end of the year?
The housing inventory situation in New York is laughably bad.
Among the worst in the country.
Among the worst in the country.

August 13, 2025 at 1:39 PM
The housing inventory situation in New York is laughably bad.
Among the worst in the country.
Among the worst in the country.
California has about 4% less active inventory in 2025 compared to pre-pandemic.
However, the inventory profile is very different across the state.
This chart breaks down the metro-level inventory data across California.
You can see which areas are better/worse than average.
However, the inventory profile is very different across the state.
This chart breaks down the metro-level inventory data across California.
You can see which areas are better/worse than average.

August 12, 2025 at 12:18 AM
California has about 4% less active inventory in 2025 compared to pre-pandemic.
However, the inventory profile is very different across the state.
This chart breaks down the metro-level inventory data across California.
You can see which areas are better/worse than average.
However, the inventory profile is very different across the state.
This chart breaks down the metro-level inventory data across California.
You can see which areas are better/worse than average.
We just released a new video update on residential construction & home prices.
It covers the full housing cycle & highlights major regional disparities in inventory & price trends.
If you're interested in reports like this, you can find more info here: epbresearch.com/services/
It covers the full housing cycle & highlights major regional disparities in inventory & price trends.
If you're interested in reports like this, you can find more info here: epbresearch.com/services/
August 8, 2025 at 3:44 PM
We just released a new video update on residential construction & home prices.
It covers the full housing cycle & highlights major regional disparities in inventory & price trends.
If you're interested in reports like this, you can find more info here: epbresearch.com/services/
It covers the full housing cycle & highlights major regional disparities in inventory & price trends.
If you're interested in reports like this, you can find more info here: epbresearch.com/services/
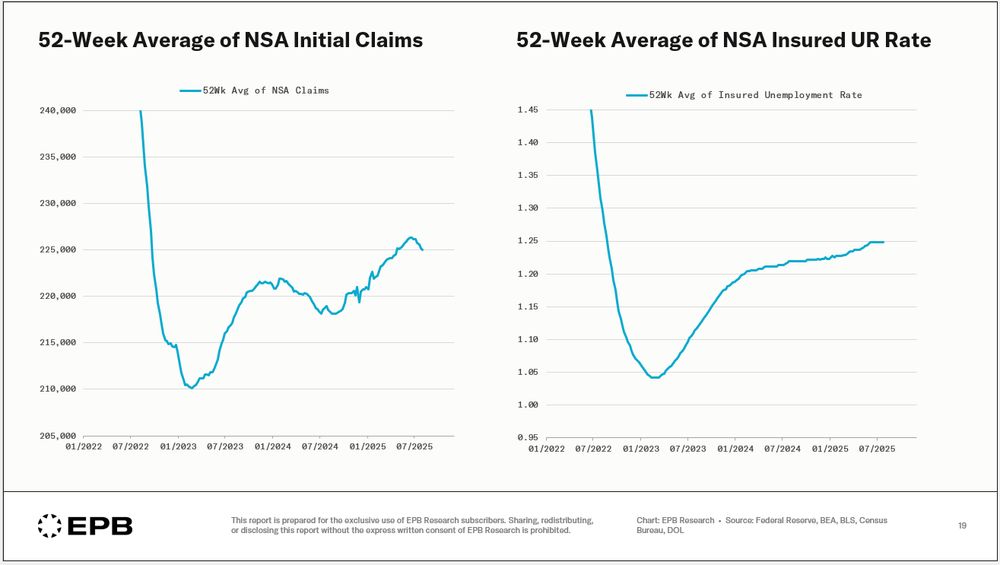
Initial jobless claims have been stabilizing over the last few weeks.
Less so for the insured UR rate.
Less so for the insured UR rate.
August 7, 2025 at 6:19 PM
Initial jobless claims have been stabilizing over the last few weeks.
Less so for the insured UR rate.
Less so for the insured UR rate.
Our next EPB update focuses on residential construction and home prices.
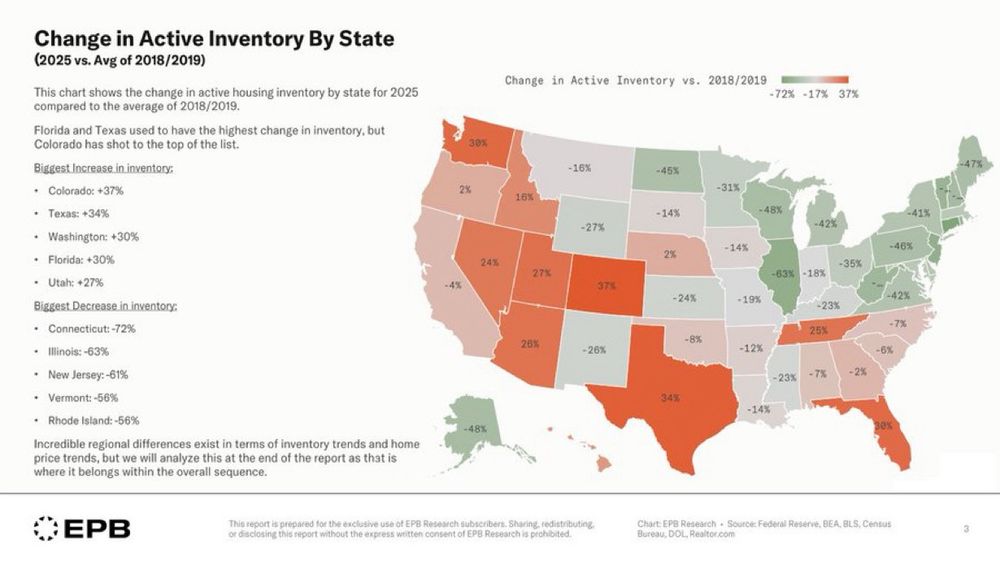
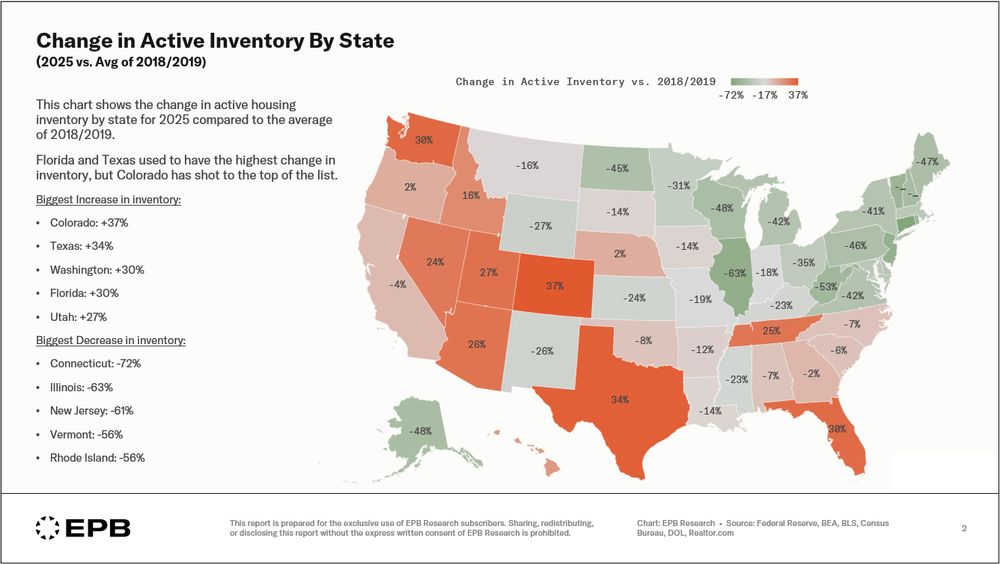
This chart shows active housing inventory in 2025 compared to 2018/2019 levels.
This is the one of the largest variations in inventory and home prices by geography or region in history.
This chart shows active housing inventory in 2025 compared to 2018/2019 levels.
This is the one of the largest variations in inventory and home prices by geography or region in history.
August 5, 2025 at 3:01 PM
Our next EPB update focuses on residential construction and home prices.
This chart shows active housing inventory in 2025 compared to 2018/2019 levels.
This is the one of the largest variations in inventory and home prices by geography or region in history.
This chart shows active housing inventory in 2025 compared to 2018/2019 levels.
This is the one of the largest variations in inventory and home prices by geography or region in history.
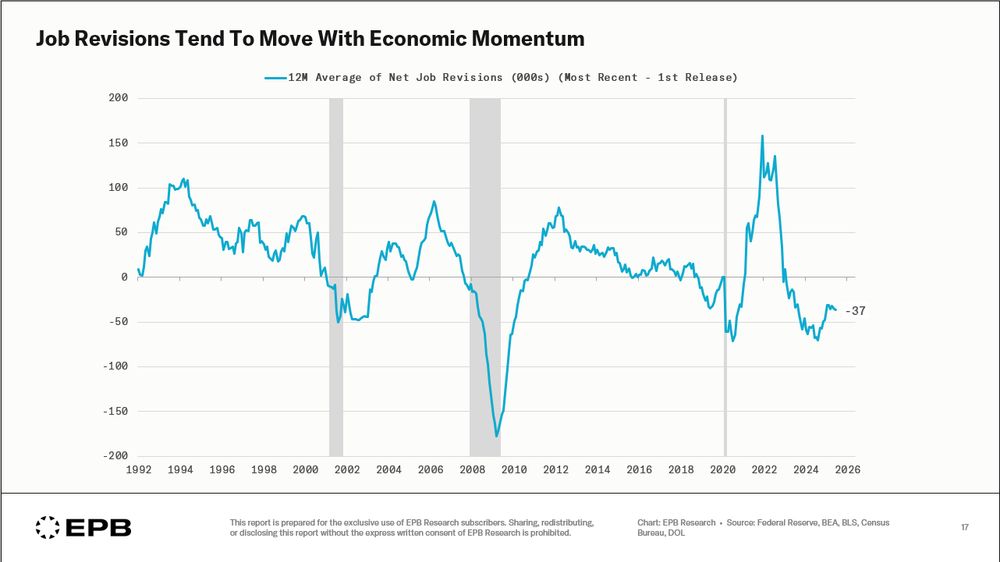
Two comments about the labor data and political noise surrounding revisions:
1] Establishment survey nonfarm payroll revisions tend to move with economic momentum (so much that rolling revisions look like an economic indicator)
2] The unemployment rate is much less revised.
1] Establishment survey nonfarm payroll revisions tend to move with economic momentum (so much that rolling revisions look like an economic indicator)
2] The unemployment rate is much less revised.
August 3, 2025 at 11:21 AM
Two comments about the labor data and political noise surrounding revisions:
1] Establishment survey nonfarm payroll revisions tend to move with economic momentum (so much that rolling revisions look like an economic indicator)
2] The unemployment rate is much less revised.
1] Establishment survey nonfarm payroll revisions tend to move with economic momentum (so much that rolling revisions look like an economic indicator)
2] The unemployment rate is much less revised.
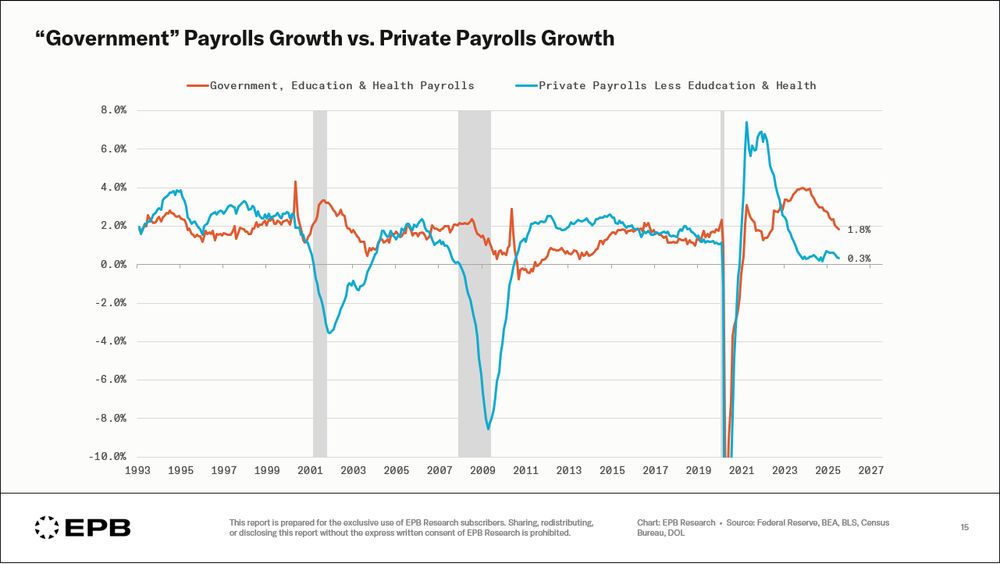
What is different this cycle is the length of time private jobs growth has held below 1% (25 straight months).
Unusual outside of recessionary periods.
Unusual outside of recessionary periods.

August 2, 2025 at 7:24 PM
What is different this cycle is the length of time private jobs growth has held below 1% (25 straight months).
Unusual outside of recessionary periods.
Unusual outside of recessionary periods.
Government & quasi-government jobs (32% of total) are growing at 1.8%.
"Private" sector jobs (68% of total) are growing at 0.3%.
This split is textbook late-cycle labor dynamics.
"Private" sector jobs (68% of total) are growing at 0.3%.
This split is textbook late-cycle labor dynamics.
August 2, 2025 at 7:24 PM
Government & quasi-government jobs (32% of total) are growing at 1.8%.
"Private" sector jobs (68% of total) are growing at 0.3%.
This split is textbook late-cycle labor dynamics.
"Private" sector jobs (68% of total) are growing at 0.3%.
This split is textbook late-cycle labor dynamics.
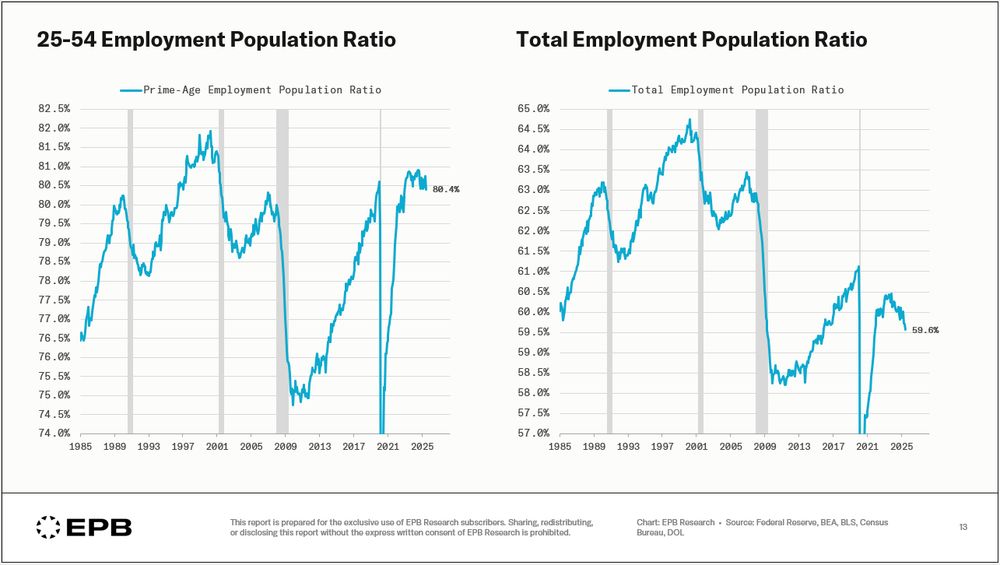
Demographics at play, but yikes, the total employment-population ratio looks bad.
August 2, 2025 at 6:40 PM
Demographics at play, but yikes, the total employment-population ratio looks bad.
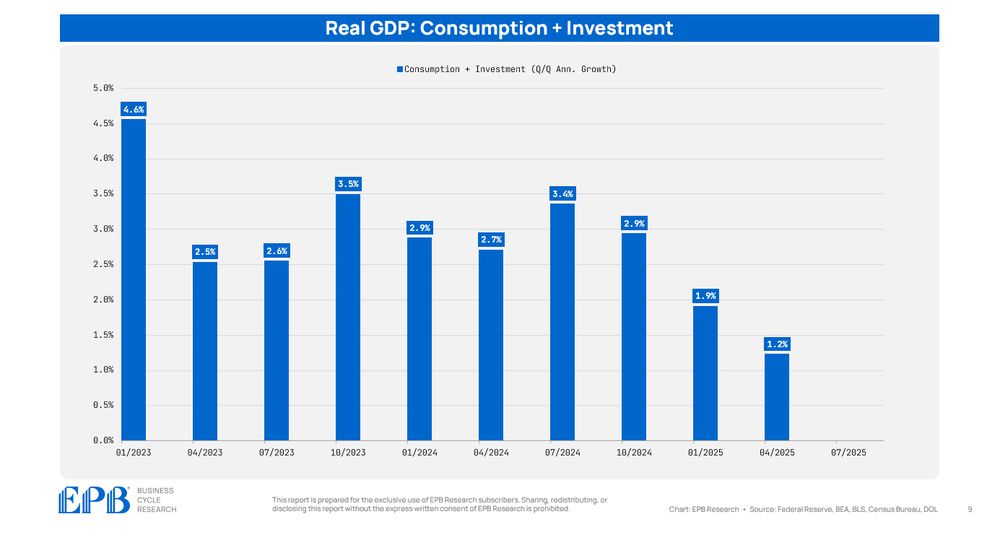
Consumption + investment (87% of GDP) decelerated to 1.2% growth in Q2.
Q324: 3.4%
Q424: 2.9%
Q125: 1.9%
Q225: 1.2%
Q324: 3.4%
Q424: 2.9%
Q125: 1.9%
Q225: 1.2%
July 30, 2025 at 4:28 PM
Consumption + investment (87% of GDP) decelerated to 1.2% growth in Q2.
Q324: 3.4%
Q424: 2.9%
Q125: 1.9%
Q225: 1.2%
Q324: 3.4%
Q424: 2.9%
Q125: 1.9%
Q225: 1.2%
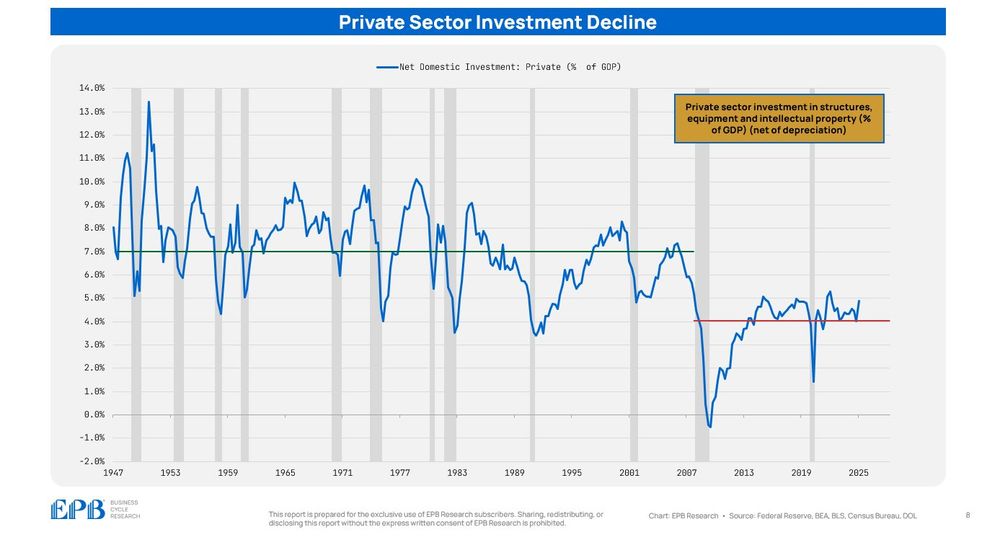
The most effective way for an economy to grow is for the private sector to invest & grow the capital stock.
From 1947-07, the private sector invested ~7% of GDP in new structures, equipment & IP.
From 07-today, it's been ~4%.
This is around $1T of missing investment per year!
From 1947-07, the private sector invested ~7% of GDP in new structures, equipment & IP.
From 07-today, it's been ~4%.
This is around $1T of missing investment per year!
July 21, 2025 at 10:33 AM
The most effective way for an economy to grow is for the private sector to invest & grow the capital stock.
From 1947-07, the private sector invested ~7% of GDP in new structures, equipment & IP.
From 07-today, it's been ~4%.
This is around $1T of missing investment per year!
From 1947-07, the private sector invested ~7% of GDP in new structures, equipment & IP.
From 07-today, it's been ~4%.
This is around $1T of missing investment per year!
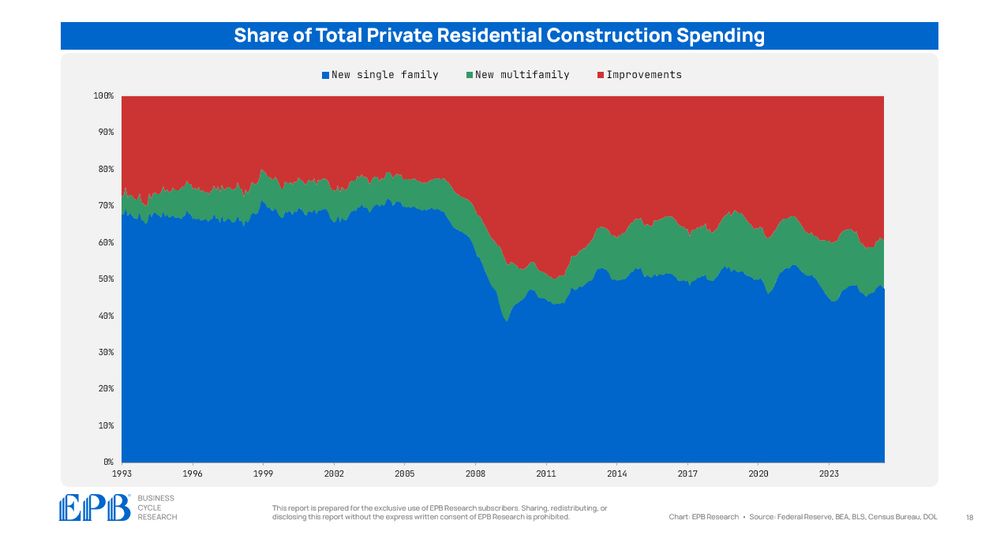
The nature of residential construction spending has shifted.
In the early 90s, 70% of residential construction spending was on new single-family buildings.
Today, it's 47%.
Remodeling and new multi-family buildings have increased their share from a combined 30% to over 50%.
In the early 90s, 70% of residential construction spending was on new single-family buildings.
Today, it's 47%.
Remodeling and new multi-family buildings have increased their share from a combined 30% to over 50%.
July 19, 2025 at 5:14 PM
The nature of residential construction spending has shifted.
In the early 90s, 70% of residential construction spending was on new single-family buildings.
Today, it's 47%.
Remodeling and new multi-family buildings have increased their share from a combined 30% to over 50%.
In the early 90s, 70% of residential construction spending was on new single-family buildings.
Today, it's 47%.
Remodeling and new multi-family buildings have increased their share from a combined 30% to over 50%.
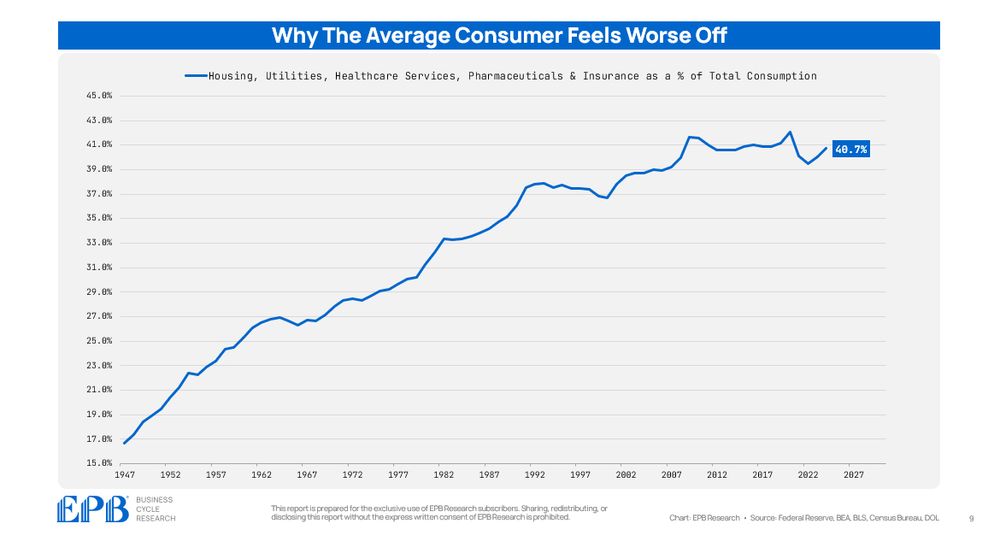
Why does the average consumer feel worse off?
Because 41% of consumer spending goes to: housing, utilities, healthcare, medications, and insurance.
This was 16% in 1947, 30% in 1980, and 35% in 1990.
Fewer consumer dollars are left for true discretionary spending.
Because 41% of consumer spending goes to: housing, utilities, healthcare, medications, and insurance.
This was 16% in 1947, 30% in 1980, and 35% in 1990.
Fewer consumer dollars are left for true discretionary spending.
July 15, 2025 at 6:40 PM
Why does the average consumer feel worse off?
Because 41% of consumer spending goes to: housing, utilities, healthcare, medications, and insurance.
This was 16% in 1947, 30% in 1980, and 35% in 1990.
Fewer consumer dollars are left for true discretionary spending.
Because 41% of consumer spending goes to: housing, utilities, healthcare, medications, and insurance.
This was 16% in 1947, 30% in 1980, and 35% in 1990.
Fewer consumer dollars are left for true discretionary spending.
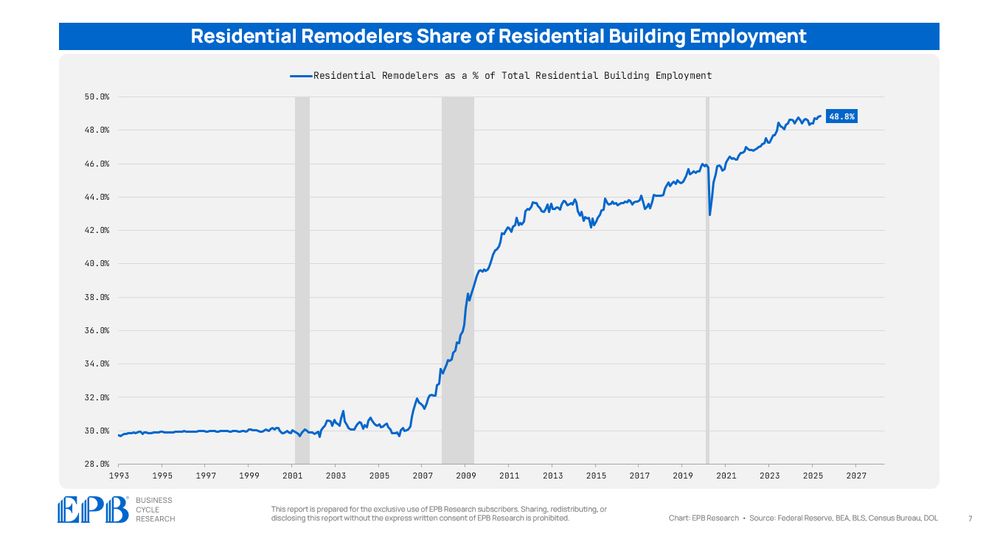
Residential building is one of the most important categories of employment for the business cycle.
Residential building includes single & multi-family building as well as remodelers.
Remodeling has increased from 30% to nearly 50% of total residential building employment.
Residential building includes single & multi-family building as well as remodelers.
Remodeling has increased from 30% to nearly 50% of total residential building employment.
July 15, 2025 at 1:23 PM
Residential building is one of the most important categories of employment for the business cycle.
Residential building includes single & multi-family building as well as remodelers.
Remodeling has increased from 30% to nearly 50% of total residential building employment.
Residential building includes single & multi-family building as well as remodelers.
Remodeling has increased from 30% to nearly 50% of total residential building employment.
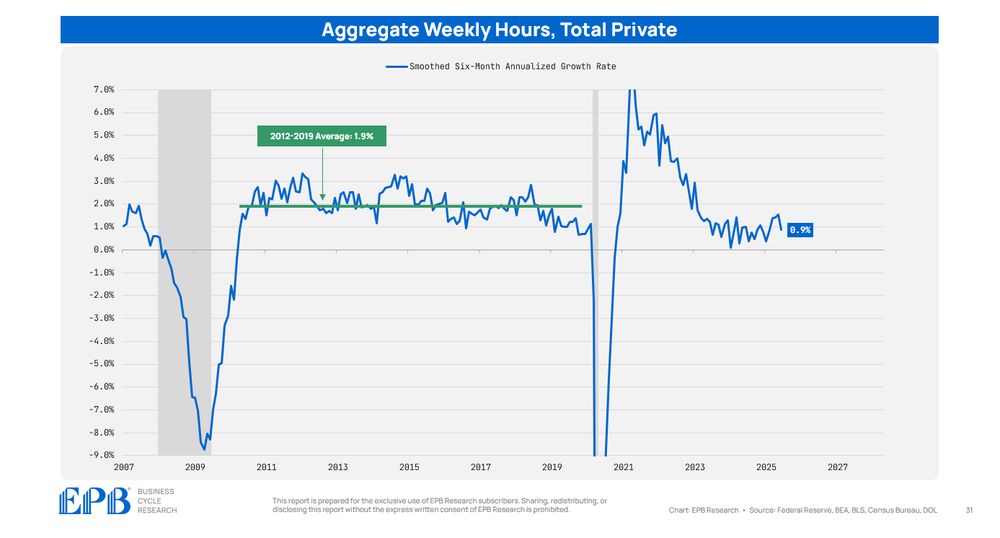
Aggregate hours worked in the private sector are growing at a 0.9% annualized rate.
This compares to an average rate of 1.9% in the pre-pandemic expansion.
The private sector labor market is weak for a non-recessionary period.
This compares to an average rate of 1.9% in the pre-pandemic expansion.
The private sector labor market is weak for a non-recessionary period.
July 9, 2025 at 9:08 PM
Aggregate hours worked in the private sector are growing at a 0.9% annualized rate.
This compares to an average rate of 1.9% in the pre-pandemic expansion.
The private sector labor market is weak for a non-recessionary period.
This compares to an average rate of 1.9% in the pre-pandemic expansion.
The private sector labor market is weak for a non-recessionary period.
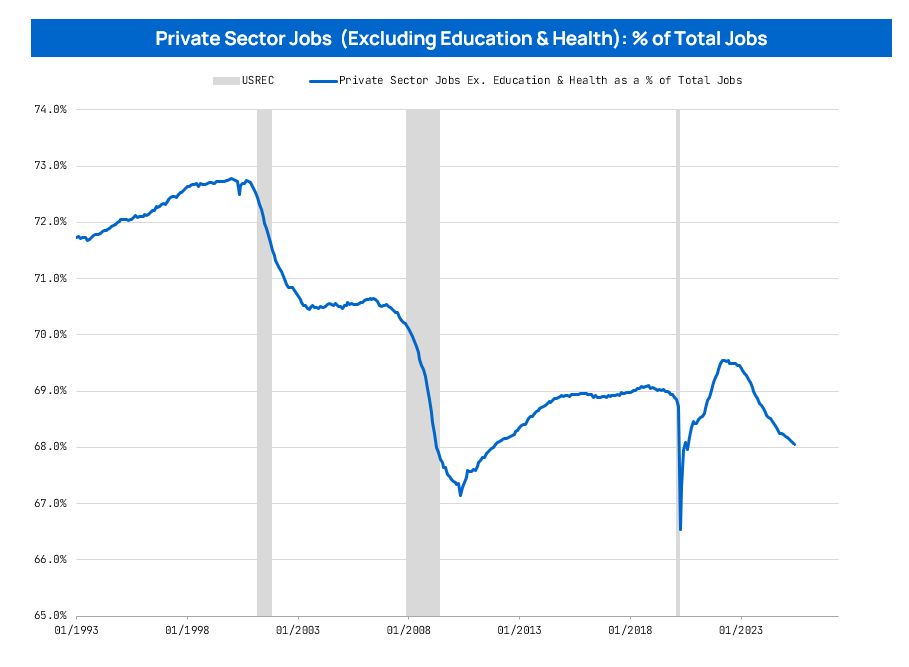
Private sector jobs (excluding education & healthcare) fell to 68% of total jobs in the economy.
Normally, the private sector share of jobs falls in recessions, not expansions.
The labor market gains continue to be dominated by government, and quasi-government jobs.
Normally, the private sector share of jobs falls in recessions, not expansions.
The labor market gains continue to be dominated by government, and quasi-government jobs.
July 5, 2025 at 4:09 PM
Private sector jobs (excluding education & healthcare) fell to 68% of total jobs in the economy.
Normally, the private sector share of jobs falls in recessions, not expansions.
The labor market gains continue to be dominated by government, and quasi-government jobs.
Normally, the private sector share of jobs falls in recessions, not expansions.
The labor market gains continue to be dominated by government, and quasi-government jobs.
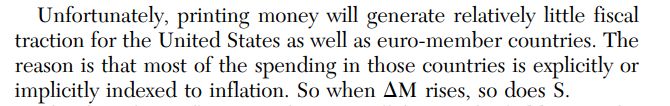
How do you solve a primary deficit problem with inflation, when the majority of the primary deficit is indexed to inflation?
July 4, 2025 at 6:10 AM
How do you solve a primary deficit problem with inflation, when the majority of the primary deficit is indexed to inflation?
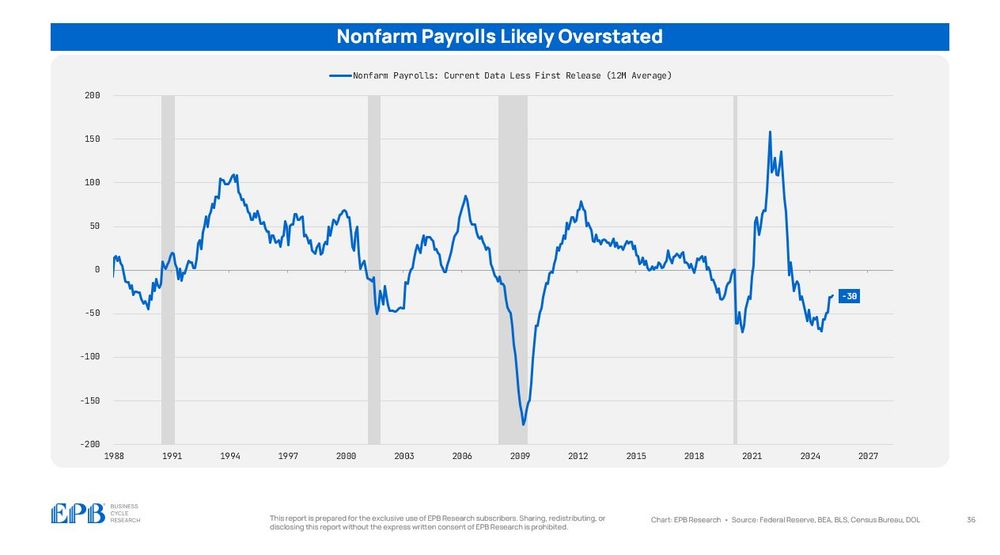
Nonfarm payrolls continue to be overstated.
Over the last 12 months, nonfarm payrolls were revised lower by an average of 30,000 per month.
Current data suggests we are adding ~1.6 million jobs per year. The pace is likely closer to 1.25 million, a 20% difference.
Over the last 12 months, nonfarm payrolls were revised lower by an average of 30,000 per month.
Current data suggests we are adding ~1.6 million jobs per year. The pace is likely closer to 1.25 million, a 20% difference.
June 23, 2025 at 8:14 PM
Nonfarm payrolls continue to be overstated.
Over the last 12 months, nonfarm payrolls were revised lower by an average of 30,000 per month.
Current data suggests we are adding ~1.6 million jobs per year. The pace is likely closer to 1.25 million, a 20% difference.
Over the last 12 months, nonfarm payrolls were revised lower by an average of 30,000 per month.
Current data suggests we are adding ~1.6 million jobs per year. The pace is likely closer to 1.25 million, a 20% difference.
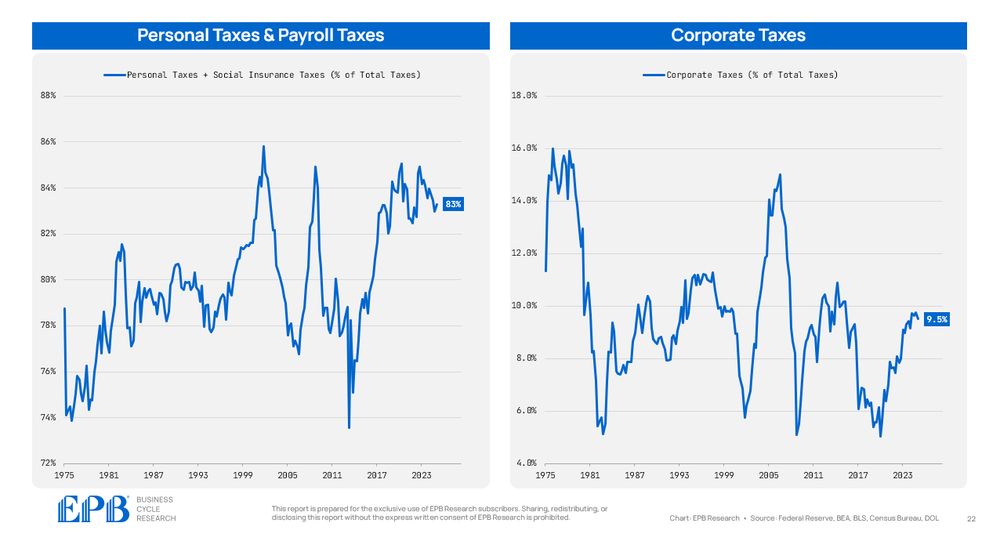
More than 90% of all federal receipts are personal taxes, payroll taxes, and corporate taxes.
Over the last 50 years, more taxes have shifted to personal & payroll and a bit less on corporations.
Over the last 50 years, more taxes have shifted to personal & payroll and a bit less on corporations.
June 20, 2025 at 6:17 PM
More than 90% of all federal receipts are personal taxes, payroll taxes, and corporate taxes.
Over the last 50 years, more taxes have shifted to personal & payroll and a bit less on corporations.
Over the last 50 years, more taxes have shifted to personal & payroll and a bit less on corporations.
Federal government receipts have been relatively stable at 18% of GDP over the last 50 years.

June 20, 2025 at 6:17 PM
Federal government receipts have been relatively stable at 18% of GDP over the last 50 years.
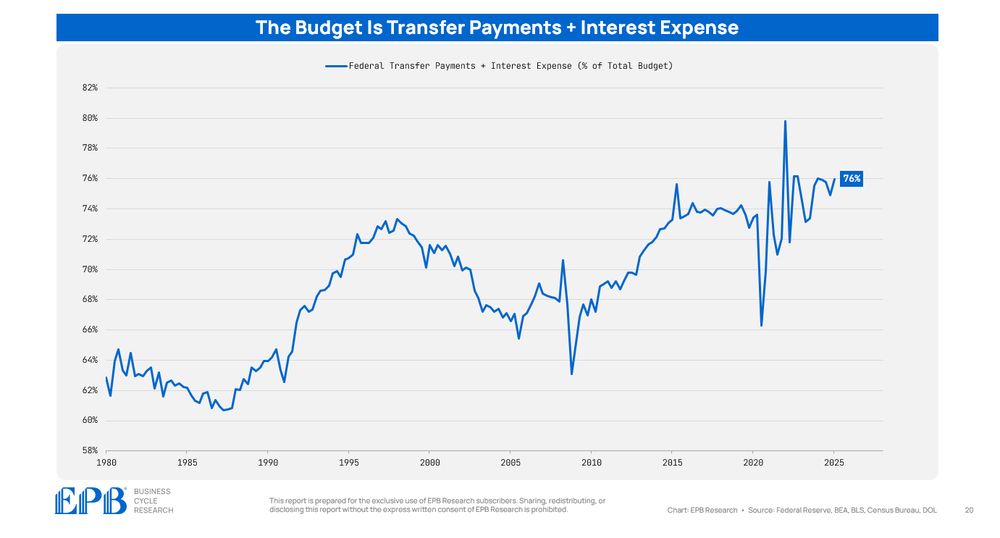
76% of the total budget is transfer payments and interest.
Any budget conversation that doesn't address transfer payments is not a serious one.
Any budget conversation that doesn't address transfer payments is not a serious one.
June 19, 2025 at 7:32 PM
76% of the total budget is transfer payments and interest.
Any budget conversation that doesn't address transfer payments is not a serious one.
Any budget conversation that doesn't address transfer payments is not a serious one.