


Political Scientist. Professor at NYU’s Center for Global Affairs. Experiments, data analysis, guitar, drums, fan of comedy. Make guides for @statacorp.bsky.social users. Two boys and exhausted all the time. More at www.johnvkane.com .. more
Political Scientist. Professor at NYU’s Center for Global Affairs. Experiments, data analysis, guitar, drums, fan of comedy. Make guides for @statacorp.bsky.social users. Two boys and exhausted all the time. More at www.johnvkane.com
Do you do survey experiments? This article is for you! 7 things that increase the risk of null/non-significant results & how to detect/prevent them. It's one of my fav things I've ever written so I hope you enjoy ☺️ polisky
cup.org/3OQhKNv
Reposted by David Darmofal

Using some @electionstudies.bsky.social data, the answer seems to be: Yes, but not dramatically so, and there's a tendency for more experience with higher ed. to be associated w/ more positive ratings. 👍

But it still might be unlikely. For reference, Richard Nixon—Nixon!—left office at 24%. That’s probably the real “floor,” not 0%.
Reposted by John Kane


amazing Stata Gallery. The piece covers how and why graphs with two y-axes can be so deceiving. Includes an applied example (with code). Hope it's useful! 😁 Link 👇

@statacorp.bsky.social adds something like a "top" option (like how "citop" exists for CIs in -coefplot-), it might (?) be the best way to do it...

@statacorp.bsky.social graphs? If so, you've probably noticed that the lines go *behind* bars/bins. 🤷🏻♂️
Today I discovered a hack to fix this. Instead of using e.g., "xline()", use "scatteri". Ref lines will go *on top* of bars, not behind. Code in thread 👇
But when the effect is negative, this flips: same-sign→less negative, opposite-sign→too negative. 👍
Suppose caloric intake (Z) is negatively correlated with X, and positively correlated with Y, but we don't control for Z.
The estimated effect of X on Y will be *too negative*: high exercise people are ALSO low-calorie people (and vice versa).
When Z has opposite relations with X and Y (➖X,➕Y), the bias makes the effect *more negative*. 😯
But what about when the true effect is 𝐧𝐞𝐠𝐚𝐭𝐢𝐯𝐞? Is OVB just the mirror opposite, biasing the effect to be too negative? No.👇
Definition: The increasing feeling of dread (felt among teachers/professors while grading a paper) that a student's work was written, at least in part, by AI.
Example: "It took forever to get my grading done because I was feeling intense parAInoia."
Reposted by David Rosnick, Nathan P. Kalmoe

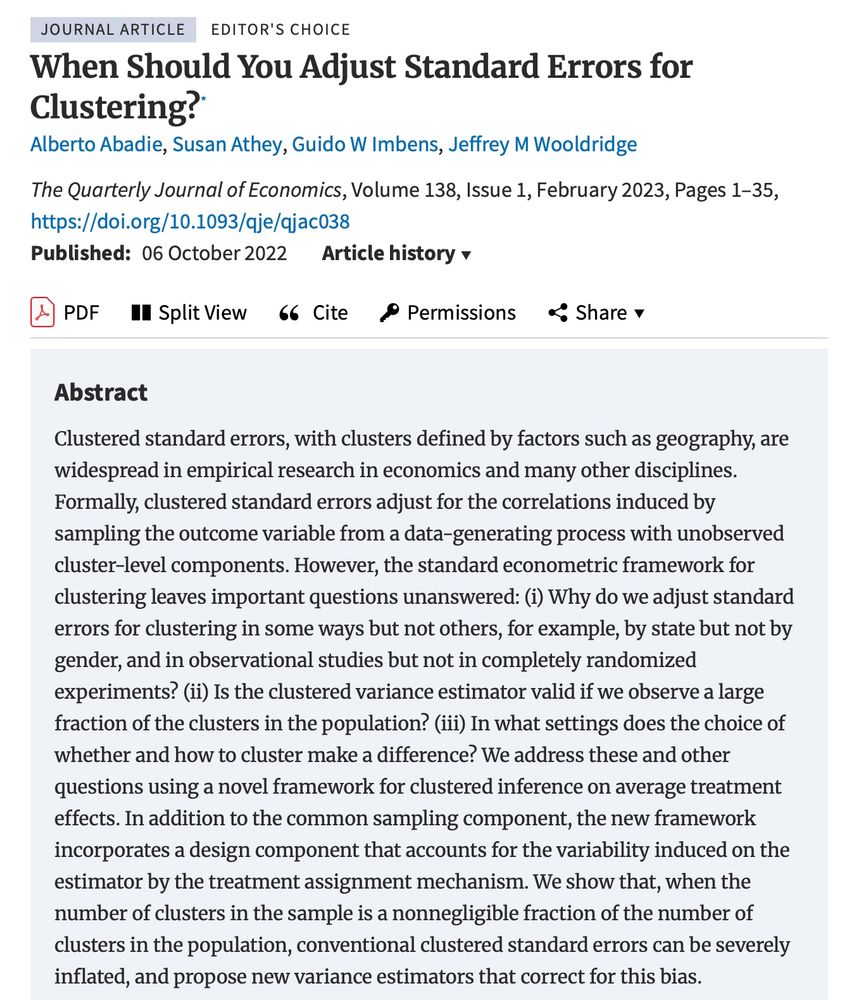
In that graph I posted, it's clear that residuals are positively correlated, which is why I thought to cluster. But this article says no 🤯
Reposted by Efrén O. Pérez

This week I learned that spatially correlated residuals in FE models (w/ data from Bailey's great book) probably doesn't require clustering SEs. Thx to @nickchk.com's AMAZING website--what a resource! 🙏
At its best, qual research feels like shining a huge light inside the black box that quant folks often ignore. 👍
At its worst, qual research feels like a scatterplot for which the researcher gets to choose which dots to show. 😬
Reposted by John Kane, Laura K. Taylor, Matti Vuorre


Join us as we repeat ourselves tomorrow.
Tomorrow, we repeat ourselves. Join us!
Not sure Daniel has anywhere near enough time (and not totally sure I have anywhere near enough experience doing meta science). That said, thinking about null results is kind of an obsession of mine, so I’ll keep it in mind for the future! 🙏
FWIW, one argument I find persuasive is that, yes, high SES kids have advantages on the SAT that are unrelated to the underlying trait.
BUT—banning it would give more weight to things that high SES kids are *even more* advantaged on (rec letters, HS quality, etc) 🤔
For example, rule out an alternative explanation via showing it's non-significant, which serves as more evidence for one's significant effect. 🤔
Ultimately I thought better to go with something that evokes “going up” (and maybe something less violent lol)
I esp loved the discussion of reverse p-hacking as a means of purposely generating null results. I could picture this happening more as null results become more acceptable--it'd be yet another way of creating a "clear story." Might I suggest calling it: "p-stacking"? 😉
