


Нерегулярное напоминание: gnuplot решает половину ваших отладочных проблем, вы просто этого ещё не знаете.
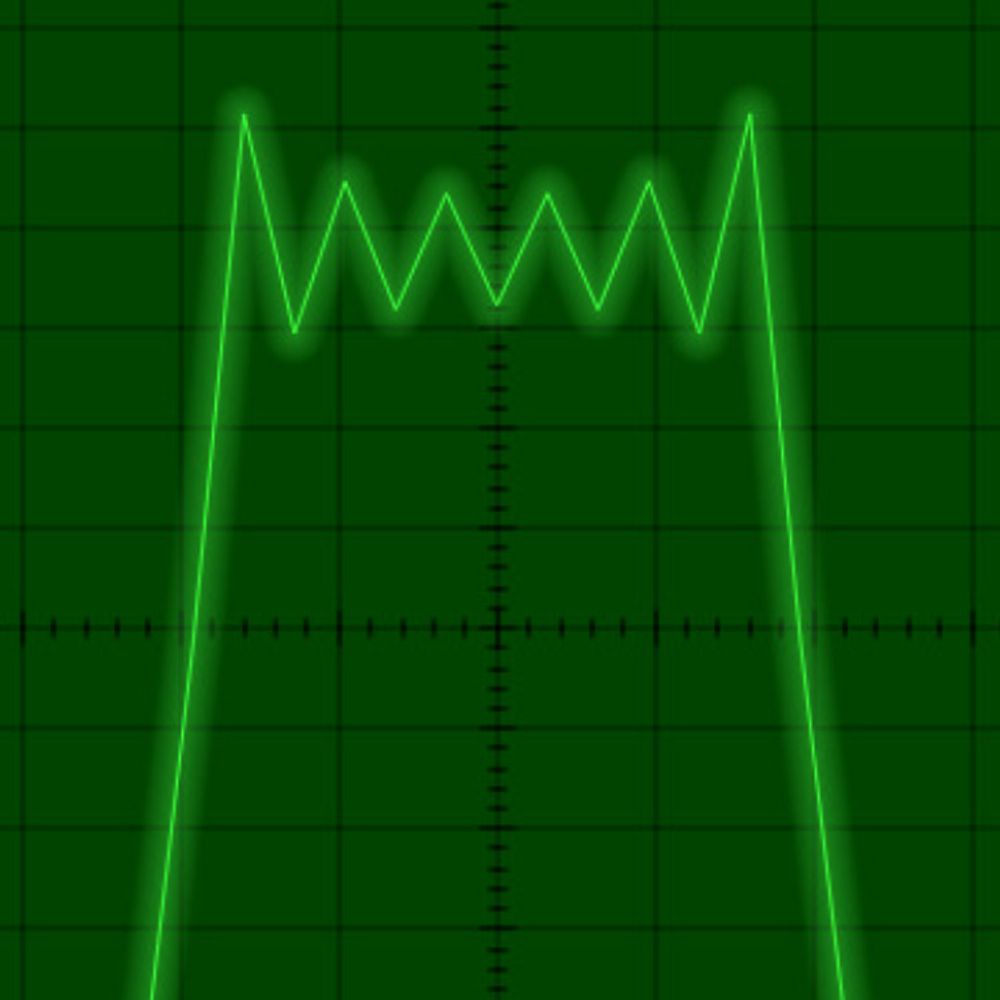
(на картинке визуализация candump-лога программирования ECU по UDS: слева вендорское решение, справа я; йеп, абсолютный fs_seek() на медленной флэшке)
(на картинке визуализация candump-лога программирования ECU по UDS: слева вендорское решение, справа я; йеп, абсолютный fs_seek() на медленной флэшке)

November 1, 2025 at 8:22 PM
Нерегулярное напоминание: gnuplot решает половину ваших отладочных проблем, вы просто этого ещё не знаете.
(на картинке визуализация candump-лога программирования ECU по UDS: слева вендорское решение, справа я; йеп, абсолютный fs_seek() на медленной флэшке)
(на картинке визуализация candump-лога программирования ECU по UDS: слева вендорское решение, справа я; йеп, абсолютный fs_seek() на медленной флэшке)

They're custom made for this/curl. All graphs are generated with gnuplot using the stats scripts available at github.com/curl/stats all the graphs are updated daily and are visible at curl.se/dashboard.html

GitHub - curl/stats: Scripts for generating project statistics and for plotting them as graphs.
Scripts for generating project statistics and for plotting them as graphs. - curl/stats
github.com
September 16, 2025 at 7:32 AM
They're custom made for this/curl. All graphs are generated with gnuplot using the stats scripts available at github.com/curl/stats all the graphs are updated daily and are visible at curl.se/dashboard.html
like this, but, like, way more in depth and black background HTML and probably gnuplot
Visualise the randomness of random generators
Visualising the randomness is a simple fun way to test randomness and see how a random generator behaves. The post demonstrate how to do it in OCaml with the library camlimages...
typeocaml.com
September 12, 2024 at 2:38 AM
like this, but, like, way more in depth and black background HTML and probably gnuplot
FTR, this paper was written entirely in #orgmode in #emacs: a simple export to LaTeX and then upload resulting files (including images created via src blocks, e.g. with #gnuplot, #graphviz, and #plantuml) to #arxiv. Thank you to all the code developers for all those tools for creating such a […]
Original post on fediscience.org
fediscience.org
January 17, 2025 at 8:35 AM

==> Fetching dependencies for gnuplot: libcerf, lua, assimp, dbus, double-conversion, hunspell, libmng, md4c and qt
ok I'll bite: why does gnuplot want all that?
ok I'll bite: why does gnuplot want all that?
April 28, 2025 at 11:21 AM
==> Fetching dependencies for gnuplot: libcerf, lua, assimp, dbus, double-conversion, hunspell, libmng, md4c and qt
ok I'll bite: why does gnuplot want all that?
ok I'll bite: why does gnuplot want all that?
On Website Technicals (2025-01) - Tech updates: audio kbps, intensity, heater priority, indexed, gnuplot bar chart offset, stats glitches... - https://m.earth.org.uk/note-on-site-technicals-92.html

On Website Technicals (2025-01)
Tech updates: audio kbps, intensity...
m.earth.org.uk
January 28, 2025 at 3:27 AM
On Website Technicals (2025-01) - Tech updates: audio kbps, intensity, heater priority, indexed, gnuplot bar chart offset, stats glitches... - https://m.earth.org.uk/note-on-site-technicals-92.html

No me pidas hacer una sustitución de Weierstrass para integrar, pero por alguna razón absolutamente incomprensible sigo acordándome de todos los comandos de gnuplot.
April 21, 2025 at 2:20 PM
No me pidas hacer una sustitución de Weierstrass para integrar, pero por alguna razón absolutamente incomprensible sigo acordándome de todos los comandos de gnuplot.
... in the sense that it just translates Julia to gnuplot. The package ends up being simpler, more robust, but with syntax that can express most of gnuplot's features.
July 3, 2025 at 1:29 PM
... in the sense that it just translates Julia to gnuplot. The package ends up being simpler, more robust, but with syntax that can express most of gnuplot's features.

For Datavis: Tableau, Plotly, LabPlot (free alternative to OriginPlot), GnuPlot, GraphPadPrism
If you have at least some willigness to learn e.g. python, have a look at the python graph gallery or the seaborn gallery for sample visualisations and code. Jupyter as an IDE is recommended
If you have at least some willigness to learn e.g. python, have a look at the python graph gallery or the seaborn gallery for sample visualisations and code. Jupyter as an IDE is recommended
September 3, 2025 at 6:37 PM
For Datavis: Tableau, Plotly, LabPlot (free alternative to OriginPlot), GnuPlot, GraphPadPrism
If you have at least some willigness to learn e.g. python, have a look at the python graph gallery or the seaborn gallery for sample visualisations and code. Jupyter as an IDE is recommended
If you have at least some willigness to learn e.g. python, have a look at the python graph gallery or the seaborn gallery for sample visualisations and code. Jupyter as an IDE is recommended

연구: vim + c + python + gnuplot
논문: overleaf (LaTeX) + zotero
논문: overleaf (LaTeX) + zotero
September 26, 2025 at 1:36 AM
연구: vim + c + python + gnuplot
논문: overleaf (LaTeX) + zotero
논문: overleaf (LaTeX) + zotero

3D描画よくわかんないだよな。
gnuplotでいいのかな。
gnuplotでいいのかな。
September 9, 2024 at 1:47 AM
3D描画よくわかんないだよな。
gnuplotでいいのかな。
gnuplotでいいのかな。

This made me wonder how many people still use gnuplot.

For #rstats people working on computing environments without GUI, you should check out the package `txtplot`.
E.g. this density plot is pretty useful to get an idea what my data looks like:
E.g. this density plot is pretty useful to get an idea what my data looks like:

April 21, 2025 at 10:12 AM
This made me wonder how many people still use gnuplot.

Analyzing IPv4 Trades with Gnuplot

Analyzing ipv4 trades with gnuplot.
Table of Contents
ipv4a-5539ad.gitlab.io
June 9, 2025 at 1:41 PM
Analyzing IPv4 Trades with Gnuplot


Ubuntuで動かしてるからかわからんけどgnuplot君が俺的に見栄えいいグラフ出してくれなくて本当にやだ
November 1, 2024 at 4:17 AM
Ubuntuで動かしてるからかわからんけどgnuplot君が俺的に見栄えいいグラフ出してくれなくて本当にやだ

scientist pride flag (gnuplot viridis)
November 24, 2024 at 11:17 AM
scientist pride flag (gnuplot viridis)

I don't think I ever followed this up. In the end I used a scatterplot and manually assembled the y-axis and its ticks.
See gist[1] for the shell one-liner, which leans on jq to do all the pre-processing. If you have easier ways, let me know!
[1]: gist.github.com/weeble/2a8ca...
See gist[1] for the shell one-liner, which leans on jq to do all the pre-processing. If you have easier ways, let me know!
[1]: gist.github.com/weeble/2a8ca...


November 26, 2024 at 2:29 PM
I don't think I ever followed this up. In the end I used a scatterplot and manually assembled the y-axis and its ticks.
See gist[1] for the shell one-liner, which leans on jq to do all the pre-processing. If you have easier ways, let me know!
[1]: gist.github.com/weeble/2a8ca...
See gist[1] for the shell one-liner, which leans on jq to do all the pre-processing. If you have easier ways, let me know!
[1]: gist.github.com/weeble/2a8ca...

gnuplot still beats everything else. Period.
June 15, 2023 at 9:25 AM
gnuplot still beats everything else. Period.

Playing around with gnuplot. This is one powerful thing!!
December 2, 2024 at 4:14 PM
Playing around with gnuplot. This is one powerful thing!!

Gimp is a seriously great program. That and gnuplot.

Yesterday I was asked by roomie if there was Photoshop for Linux. So I walked him through installing The GIMP
It's not Photoshop, but...
We fired it up after he got it installed and loaded a photo and his mind was blown
It's not Photoshop, but...
We fired it up after he got it installed and loaded a photo and his mind was blown
January 2, 2025 at 10:06 PM
Gimp is a seriously great program. That and gnuplot.

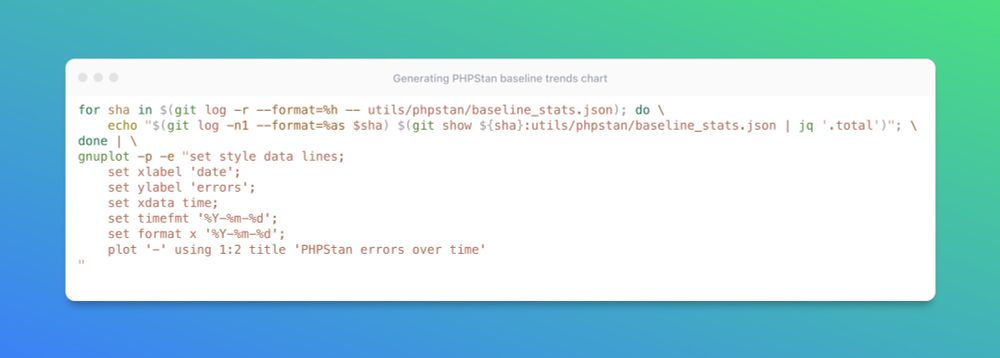
The chart is generated by `gnuplot`, and the input data is retrieved from Git history of a JSON file that stores #PHPStan errors' stats (cherry-picking total value using awesome `jq` tool). It is simple Proof of Concept, but it works great 😃.
March 11, 2025 at 7:22 AM
The chart is generated by `gnuplot`, and the input data is retrieved from Git history of a JSON file that stores #PHPStan errors' stats (cherry-picking total value using awesome `jq` tool). It is simple Proof of Concept, but it works great 😃.
Version 2.0 of Gaston, a Julia package for plotting using gnuplot, has been released: mbaz.github.io/Gaston.jl/v2/
#JuliaLang #gnuplot
#JuliaLang #gnuplot
Introduction – Gaston.jl
mbaz.github.io
July 1, 2025 at 2:01 PM
Version 2.0 of Gaston, a Julia package for plotting using gnuplot, has been released: mbaz.github.io/Gaston.jl/v2/
#JuliaLang #gnuplot
#JuliaLang #gnuplot


My lightning talk from the recent Joyent engineering meetup combines two big themes of my career: gnuplot and pathological firmware https://www.youtube.com/watch?v=XW-RQ3cclXs
November 3, 2024 at 4:59 AM
My lightning talk from the recent Joyent engineering meetup combines two big themes of my career: gnuplot and pathological firmware https://www.youtube.com/watch?v=XW-RQ3cclXs

gnuplot – Ein Bild sagt mehr als 1000 Zahlen … has been released on media.ccc.de https://media.ccc.de/v/clt24-285-gnuplot-ein-bild-sagt-mehr-als-1000-zahlen
March 18, 2024 at 7:46 PM
gnuplot – Ein Bild sagt mehr als 1000 Zahlen … has been released on media.ccc.de https://media.ccc.de/v/clt24-285-gnuplot-ein-bild-sagt-mehr-als-1000-zahlen