


Zack Labe
@zacklabe.com
Climate Scientist at @climatecentral.org | PhD | Passionate about improving science communication through data-driven stories | Harrisburg, PA | https://zacklabe.com/
Views, thoughts, and opinions expressed here are only my own.
Views, thoughts, and opinions expressed here are only my own.
Pinned
Zack Labe
@zacklabe.com
· Nov 30
🧵 Looking for (polar) climate data visualizations? Start here! 📈📉🧪⚒️🌊
+ Polar climate change: zacklabe.com/arctic-sea-i...
+ Global climate change indicators: zacklabe.com/climate-chan...
+ #Arctic sea ice extent: zacklabe.com/arctic-sea-i...
+ #Antarctic sea ice: zacklabe.com/antarctic-se...
+ Polar climate change: zacklabe.com/arctic-sea-i...
+ Global climate change indicators: zacklabe.com/climate-chan...
+ #Arctic sea ice extent: zacklabe.com/arctic-sea-i...
+ #Antarctic sea ice: zacklabe.com/antarctic-se...
Impossible to ignore what’s happening to #Arctic temperatures in the month of November...
Data from @copernicusecmwf.bsky.social ERA5 reanalysis.
Data from @copernicusecmwf.bsky.social ERA5 reanalysis.

November 11, 2025 at 12:10 AM
Impossible to ignore what’s happening to #Arctic temperatures in the month of November...
Data from @copernicusecmwf.bsky.social ERA5 reanalysis.
Data from @copernicusecmwf.bsky.social ERA5 reanalysis.
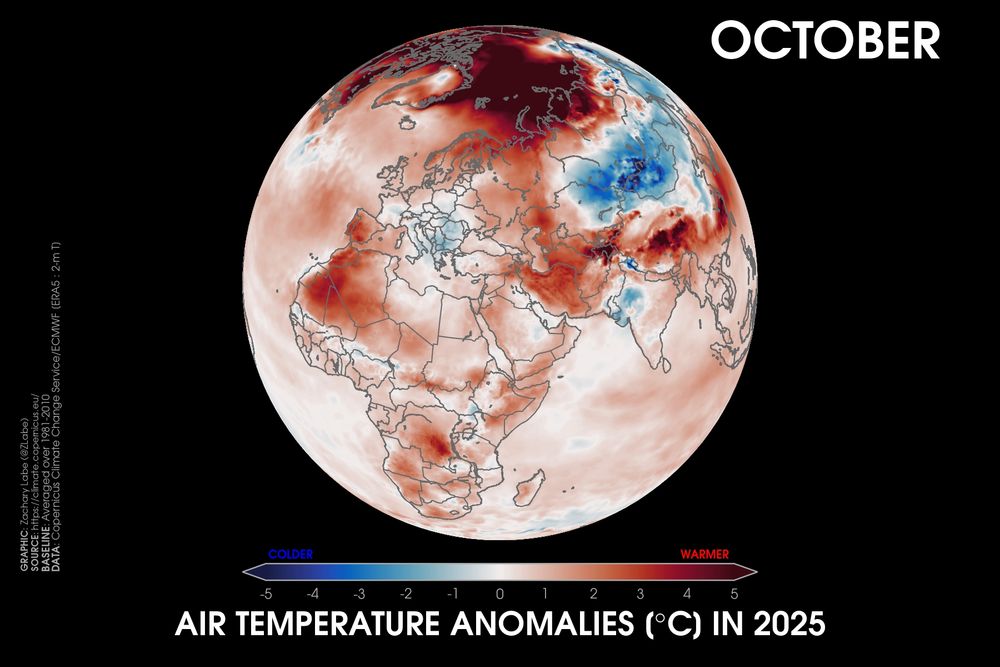
Here is a map view of the record high temperatures in October 2025 across the #Antarctic. Compare this blob of anomalies greater than 5°C with the Arctic from my earlier post. Yikes!
Data from doi.org/10.24381/cds... using a 1981-2010 reference period.
Data from doi.org/10.24381/cds... using a 1981-2010 reference period.

November 10, 2025 at 5:56 PM
Here is a map view of the record high temperatures in October 2025 across the #Antarctic. Compare this blob of anomalies greater than 5°C with the Arctic from my earlier post. Yikes!
Data from doi.org/10.24381/cds... using a 1981-2010 reference period.
Data from doi.org/10.24381/cds... using a 1981-2010 reference period.
Reposted by Zack Labe

Who from Climate Central is on Bluesky? We have a starter pack for that! ⬇️
November 7, 2025 at 9:30 PM
Who from Climate Central is on Bluesky? We have a starter pack for that! ⬇️
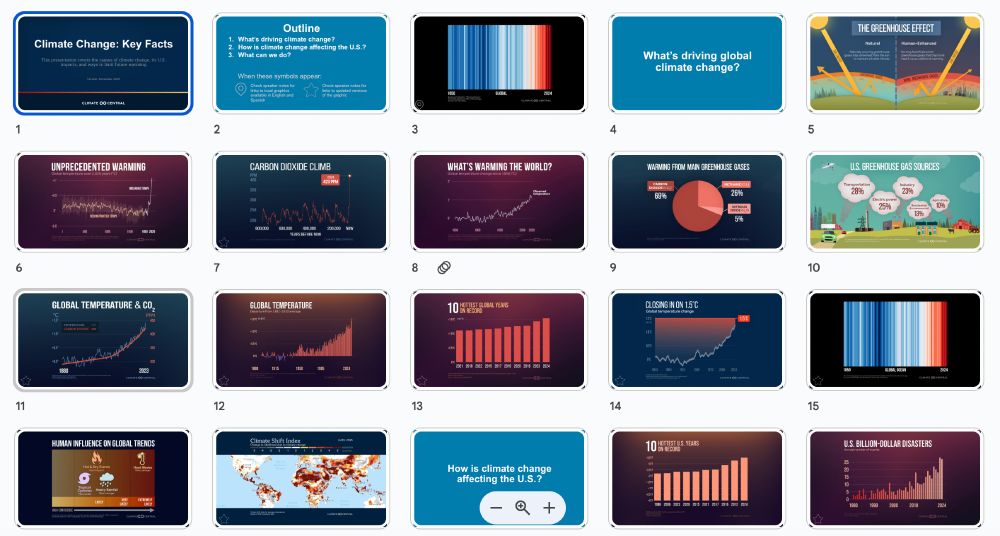
📣 We just released a new free resource at @climatecentral.org - a 72-slide deck introducing key facts about climate change, including its causes, impacts, and solutions. It also comes with speaker notes and links for local storytelling.
➡️ www.climatecentral.org/climate-matt... (English & Spanish)
➡️ www.climatecentral.org/climate-matt... (English & Spanish)
November 10, 2025 at 12:52 PM
📣 We just released a new free resource at @climatecentral.org - a 72-slide deck introducing key facts about climate change, including its causes, impacts, and solutions. It also comes with speaker notes and links for local storytelling.
➡️ www.climatecentral.org/climate-matt... (English & Spanish)
➡️ www.climatecentral.org/climate-matt... (English & Spanish)
Record high ocean temperatures continued across the North Pacific in October 2025, with recent warming really amplifying since the early 2000s.
This graph shows the average for a band across the midlatitudes for every October from 1854-2025 using
NOAA ERSSTv5 data (psl.noaa.gov/data/gridded...).
This graph shows the average for a band across the midlatitudes for every October from 1854-2025 using
NOAA ERSSTv5 data (psl.noaa.gov/data/gridded...).

November 9, 2025 at 5:43 PM
Record high ocean temperatures continued across the North Pacific in October 2025, with recent warming really amplifying since the early 2000s.
This graph shows the average for a band across the midlatitudes for every October from 1854-2025 using
NOAA ERSSTv5 data (psl.noaa.gov/data/gridded...).
This graph shows the average for a band across the midlatitudes for every October from 1854-2025 using
NOAA ERSSTv5 data (psl.noaa.gov/data/gridded...).
Here's a look at the extent of the "warmth" across the #Arctic in October. This map uses my normal anomaly scaling for each month, but it clearly doesn't work for something this extreme.
Data from doi.org/10.24381/cds...
Data from doi.org/10.24381/cds...

November 9, 2025 at 2:04 PM
Here's a look at the extent of the "warmth" across the #Arctic in October. This map uses my normal anomaly scaling for each month, but it clearly doesn't work for something this extreme.
Data from doi.org/10.24381/cds...
Data from doi.org/10.24381/cds...
October 2025 was the 3rd warmest October on record for our planet, following 2023 (1st place) and 2024 (2nd place). This month was about 1.55°C above the 1850-1900 pre-industrial average. The last 12-months have been about 1.50°C above it.
Summary of month: climate.copernicus.eu/surface-air-... 🛠️🧪🌊
Summary of month: climate.copernicus.eu/surface-air-... 🛠️🧪🌊


November 8, 2025 at 10:31 PM
October 2025 was the 3rd warmest October on record for our planet, following 2023 (1st place) and 2024 (2nd place). This month was about 1.55°C above the 1850-1900 pre-industrial average. The last 12-months have been about 1.50°C above it.
Summary of month: climate.copernicus.eu/surface-air-... 🛠️🧪🌊
Summary of month: climate.copernicus.eu/surface-air-... 🛠️🧪🌊
It's not every day that both poles set new monthly temperature records (see my earlier post). Last month also observed the warmest October on record for the #Arctic Circle. Not great!!
Data provided by doi.org/10.24381/cds....
Data provided by doi.org/10.24381/cds....

November 8, 2025 at 2:07 PM
It's not every day that both poles set new monthly temperature records (see my earlier post). Last month also observed the warmest October on record for the #Arctic Circle. Not great!!
Data provided by doi.org/10.24381/cds....
Data provided by doi.org/10.24381/cds....
The @wmo-global.bsky.social provisional report on the State of the Global Climate in 2025 was released: wmo.int/publication-...
"Other climate indicators continue to sound alarm
bells, and more extreme weather had major global impacts on
economies and all aspects of sustainable development." #COP30
"Other climate indicators continue to sound alarm
bells, and more extreme weather had major global impacts on
economies and all aspects of sustainable development." #COP30

November 7, 2025 at 8:13 PM
The @wmo-global.bsky.social provisional report on the State of the Global Climate in 2025 was released: wmo.int/publication-...
"Other climate indicators continue to sound alarm
bells, and more extreme weather had major global impacts on
economies and all aspects of sustainable development." #COP30
"Other climate indicators continue to sound alarm
bells, and more extreme weather had major global impacts on
economies and all aspects of sustainable development." #COP30
🚨 Last month observed the highest average temperature for the month of October across the #Antarctic Circle, with clearly 2025 well above any prior year in the satellite era.
Data from doi.org/10.24381/cds...
Data from doi.org/10.24381/cds...

November 7, 2025 at 5:40 PM
🚨 Last month observed the highest average temperature for the month of October across the #Antarctic Circle, with clearly 2025 well above any prior year in the satellite era.
Data from doi.org/10.24381/cds...
Data from doi.org/10.24381/cds...
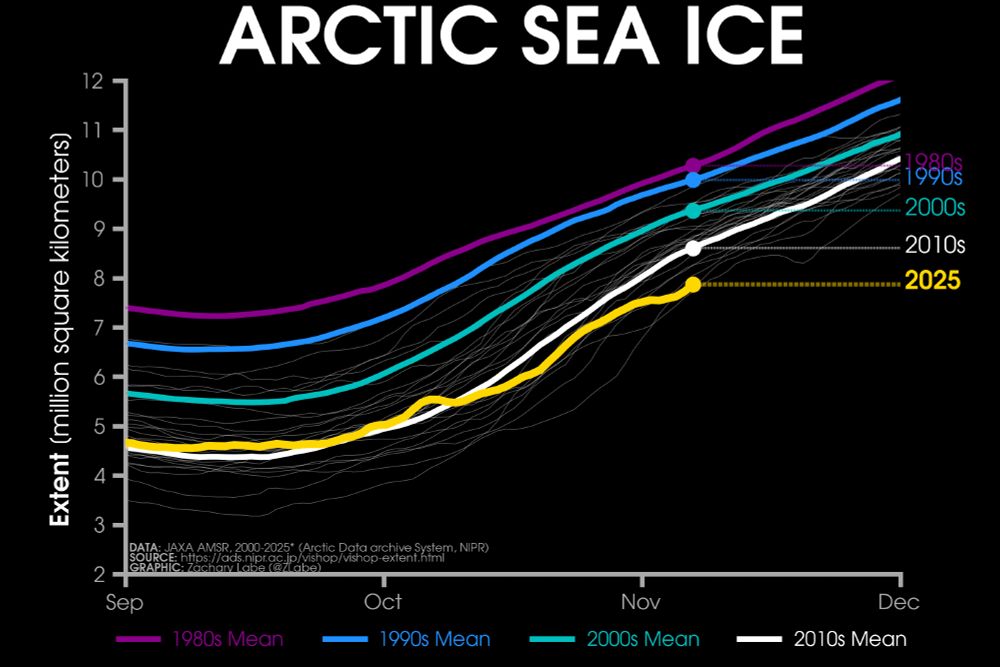
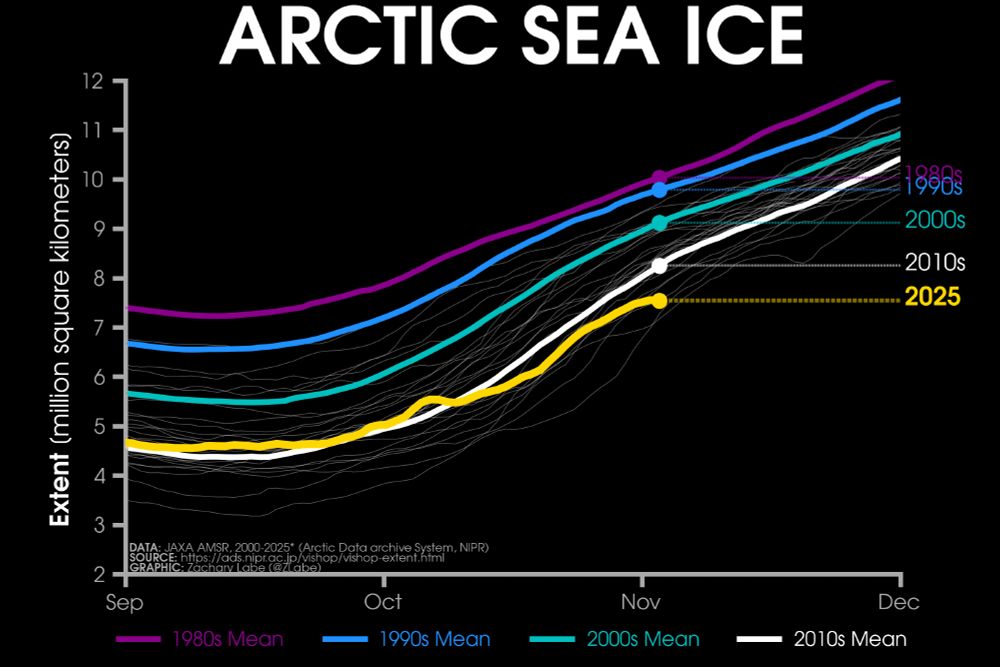
Friday ice update - #Arctic sea ice extent is currently the 3rd lowest on record (JAXA data)
• about 740,000 km² below the 2010s mean
• about 1,500,000 km² below the 2000s mean
• about 2,120,000 km² below the 1990s mean
• about 2,400,000 km² below the 1980s mean
More: zacklabe.com/arctic-sea-i...
• about 740,000 km² below the 2010s mean
• about 1,500,000 km² below the 2000s mean
• about 2,120,000 km² below the 1990s mean
• about 2,400,000 km² below the 1980s mean
More: zacklabe.com/arctic-sea-i...
November 7, 2025 at 1:55 PM
Friday ice update - #Arctic sea ice extent is currently the 3rd lowest on record (JAXA data)
• about 740,000 km² below the 2010s mean
• about 1,500,000 km² below the 2000s mean
• about 2,120,000 km² below the 1990s mean
• about 2,400,000 km² below the 1980s mean
More: zacklabe.com/arctic-sea-i...
• about 740,000 km² below the 2010s mean
• about 1,500,000 km² below the 2000s mean
• about 2,120,000 km² below the 1990s mean
• about 2,400,000 km² below the 1980s mean
More: zacklabe.com/arctic-sea-i...
Patterns of November temperatures in the #Antarctic when averaged by decade... There is a warming trend.
Data from @copernicusecmwf.bsky.social ERA5 reanalysis.
Data from @copernicusecmwf.bsky.social ERA5 reanalysis.

November 7, 2025 at 12:28 PM
Patterns of November temperatures in the #Antarctic when averaged by decade... There is a warming trend.
Data from @copernicusecmwf.bsky.social ERA5 reanalysis.
Data from @copernicusecmwf.bsky.social ERA5 reanalysis.
Not every month will set a new record, but the warming trend is obvious. This graphic shows #Arctic air temperature rank by month over the satellite era - now updated through October 2025... 🧪
+ Ranks: 1=warmest (red), 46/47=coldest (blue)
+ Download higher resolution: zacklabe.com/arctic-tempe...
+ Ranks: 1=warmest (red), 46/47=coldest (blue)
+ Download higher resolution: zacklabe.com/arctic-tempe...

November 6, 2025 at 8:59 PM
Not every month will set a new record, but the warming trend is obvious. This graphic shows #Arctic air temperature rank by month over the satellite era - now updated through October 2025... 🧪
+ Ranks: 1=warmest (red), 46/47=coldest (blue)
+ Download higher resolution: zacklabe.com/arctic-tempe...
+ Ranks: 1=warmest (red), 46/47=coldest (blue)
+ Download higher resolution: zacklabe.com/arctic-tempe...
Reposted by Zack Labe
🌎 Share the facts on climate change with a new slide deck from Climate Central, available in English and Spanish. 🌎 www.climatecentral.org/climate-matt...
November 5, 2025 at 5:43 PM
🌎 Share the facts on climate change with a new slide deck from Climate Central, available in English and Spanish. 🌎 www.climatecentral.org/climate-matt...
Reconstructing October #Arctic sea ice extent since 1850...
Data from @nsidc.bsky.social at doi.org/10.7265/jj4s...
Data from @nsidc.bsky.social at doi.org/10.7265/jj4s...

November 6, 2025 at 12:20 PM
Reconstructing October #Arctic sea ice extent since 1850...
Data from @nsidc.bsky.social at doi.org/10.7265/jj4s...
Data from @nsidc.bsky.social at doi.org/10.7265/jj4s...
Reposted by Zack Labe
🌡Every month, Climate Central breaks down the latest on climate change, so you don’t have to.
Our free monthly newsletter delivers:
▶️Localized climate impact insights
▶️Science-backed updates
▶️User-friendly tools/visualizations
Subscribe today!
bit.ly/3JB64Pe
Our free monthly newsletter delivers:
▶️Localized climate impact insights
▶️Science-backed updates
▶️User-friendly tools/visualizations
Subscribe today!
bit.ly/3JB64Pe

November 4, 2025 at 4:03 PM
🌡Every month, Climate Central breaks down the latest on climate change, so you don’t have to.
Our free monthly newsletter delivers:
▶️Localized climate impact insights
▶️Science-backed updates
▶️User-friendly tools/visualizations
Subscribe today!
bit.ly/3JB64Pe
Our free monthly newsletter delivers:
▶️Localized climate impact insights
▶️Science-backed updates
▶️User-friendly tools/visualizations
Subscribe today!
bit.ly/3JB64Pe
Trends in November temperatures over land areas (where we live) for the last 50 years... 🔥
Data from NOAAGlobalTempv6.0.0. (www.ncei.noaa.gov/products/lan...)
Data from NOAAGlobalTempv6.0.0. (www.ncei.noaa.gov/products/lan...)

November 6, 2025 at 1:37 AM
Trends in November temperatures over land areas (where we live) for the last 50 years... 🔥
Data from NOAAGlobalTempv6.0.0. (www.ncei.noaa.gov/products/lan...)
Data from NOAAGlobalTempv6.0.0. (www.ncei.noaa.gov/products/lan...)
October 2025 #Arctic sea ice extent was the 8th lowest on record for the month...
This was 2,030,000 km² below the 1981-2010 average. October ice extent is decreasing at about 9.39% per decade. Data @nsidc.bsky.social: nsidc.org/data/seaice_...
This was 2,030,000 km² below the 1981-2010 average. October ice extent is decreasing at about 9.39% per decade. Data @nsidc.bsky.social: nsidc.org/data/seaice_...
November 5, 2025 at 12:46 PM
October 2025 #Arctic sea ice extent was the 8th lowest on record for the month...
This was 2,030,000 km² below the 1981-2010 average. October ice extent is decreasing at about 9.39% per decade. Data @nsidc.bsky.social: nsidc.org/data/seaice_...
This was 2,030,000 km² below the 1981-2010 average. October ice extent is decreasing at about 9.39% per decade. Data @nsidc.bsky.social: nsidc.org/data/seaice_...
Last month was the 3rd lowest #Antarctic sea ice extent on record for the month of October.
This was 1,140,000 km² below the 1981-2010 October average. Data from the @nsidc.bsky.social: nsidc.org/data/seaice_...
This was 1,140,000 km² below the 1981-2010 October average. Data from the @nsidc.bsky.social: nsidc.org/data/seaice_...
November 4, 2025 at 12:10 AM
Last month was the 3rd lowest #Antarctic sea ice extent on record for the month of October.
This was 1,140,000 km² below the 1981-2010 October average. Data from the @nsidc.bsky.social: nsidc.org/data/seaice_...
This was 1,140,000 km² below the 1981-2010 October average. Data from the @nsidc.bsky.social: nsidc.org/data/seaice_...
"But perhaps the most consequential long-term loss for federal science is that of institutional knowledge and expertise — and the downstream effects on the training of early-career researchers."
"We lost people with decades of experience and everyone who was very early career, ...”
"We lost people with decades of experience and everyone who was very early career, ...”

Dismantling of US federal agencies will ‘destroy science’
From NASA to the National Institutes of Health, federal agencies conduct research that universities cannot. Agency scientists speak out about the irreplaceable facilities, institutional knowledge and ...
www.nature.com
November 3, 2025 at 7:59 PM
"But perhaps the most consequential long-term loss for federal science is that of institutional knowledge and expertise — and the downstream effects on the training of early-career researchers."
"We lost people with decades of experience and everyone who was very early career, ...”
"We lost people with decades of experience and everyone who was very early career, ...”
Monday ice update - #Arctic sea ice extent is currently the 3rd lowest on record (JAXA data)
• about 710,000 km² below the 2010s mean
• about 1,580,000 km² below the 2000s mean
• about 2,250,000 km² below the 1990s mean
• about 2,490,000 km² below the 1980s mean
More: zacklabe.com/arctic-sea-i...
• about 710,000 km² below the 2010s mean
• about 1,580,000 km² below the 2000s mean
• about 2,250,000 km² below the 1990s mean
• about 2,490,000 km² below the 1980s mean
More: zacklabe.com/arctic-sea-i...
November 3, 2025 at 1:47 PM
Monday ice update - #Arctic sea ice extent is currently the 3rd lowest on record (JAXA data)
• about 710,000 km² below the 2010s mean
• about 1,580,000 km² below the 2000s mean
• about 2,250,000 km² below the 1990s mean
• about 2,490,000 km² below the 1980s mean
More: zacklabe.com/arctic-sea-i...
• about 710,000 km² below the 2010s mean
• about 1,580,000 km² below the 2000s mean
• about 2,250,000 km² below the 1990s mean
• about 2,490,000 km² below the 1980s mean
More: zacklabe.com/arctic-sea-i...
Simulated reconstruction of November #Arctic sea ice thickness since 1901. Watch for the last 10 years or so...
Information about this data set is available at psc.apl.uw.edu/research/pro.... Note that it is only updated through 2010 due to ERA-20C forcing.
Information about this data set is available at psc.apl.uw.edu/research/pro.... Note that it is only updated through 2010 due to ERA-20C forcing.
November 3, 2025 at 12:32 PM
Simulated reconstruction of November #Arctic sea ice thickness since 1901. Watch for the last 10 years or so...
Information about this data set is available at psc.apl.uw.edu/research/pro.... Note that it is only updated through 2010 due to ERA-20C forcing.
Information about this data set is available at psc.apl.uw.edu/research/pro.... Note that it is only updated through 2010 due to ERA-20C forcing.
Reposted by Zack Labe
Not what people ANYWHERE on the Pacific coast need. #akwx #AlaskaSky
"The National Oceanic and Atmospheric Administration is halting a contract that makes it possible for the federal agency to…monitor for potential tsunamis…and quickly warn at-risk communities."
alaskapublic.org/news/alaska-...
"The National Oceanic and Atmospheric Administration is halting a contract that makes it possible for the federal agency to…monitor for potential tsunamis…and quickly warn at-risk communities."
alaskapublic.org/news/alaska-...

NOAA cancels funding for data collection crucial to tsunami warning systems
The Alaska Earthquake Center has long provided NOAA with seismic data for tsunami monitoring and warning purposes. That work will wind down in November, after the federal agency said it can no longer ...
alaskapublic.org
November 2, 2025 at 6:39 PM
Not what people ANYWHERE on the Pacific coast need. #akwx #AlaskaSky
"The National Oceanic and Atmospheric Administration is halting a contract that makes it possible for the federal agency to…monitor for potential tsunamis…and quickly warn at-risk communities."
alaskapublic.org/news/alaska-...
"The National Oceanic and Atmospheric Administration is halting a contract that makes it possible for the federal agency to…monitor for potential tsunamis…and quickly warn at-risk communities."
alaskapublic.org/news/alaska-...
100 years of changing November sea ice...
Total data set available from 1850 through 2017. Summary of methods: www.carbonbrief.org/guest-post-p.... More sea ice reconstructions at zacklabe.com/arctic-sea-i....
Total data set available from 1850 through 2017. Summary of methods: www.carbonbrief.org/guest-post-p.... More sea ice reconstructions at zacklabe.com/arctic-sea-i....
November 2, 2025 at 12:57 PM
100 years of changing November sea ice...
Total data set available from 1850 through 2017. Summary of methods: www.carbonbrief.org/guest-post-p.... More sea ice reconstructions at zacklabe.com/arctic-sea-i....
Total data set available from 1850 through 2017. Summary of methods: www.carbonbrief.org/guest-post-p.... More sea ice reconstructions at zacklabe.com/arctic-sea-i....
Saturday ice update - #Arctic sea ice extent is currently the 4th lowest on record (JAXA data)
• about 520,000 km² below the 2010s mean
• about 1,440,000 km² below the 2000s mean
• about 2,170,000 km² below the 1990s mean
• about 2,410,000 km² below the 1980s mean
More zacklabe.com/arctic-sea-i...
• about 520,000 km² below the 2010s mean
• about 1,440,000 km² below the 2000s mean
• about 2,170,000 km² below the 1990s mean
• about 2,410,000 km² below the 1980s mean
More zacklabe.com/arctic-sea-i...

November 1, 2025 at 11:56 PM
Saturday ice update - #Arctic sea ice extent is currently the 4th lowest on record (JAXA data)
• about 520,000 km² below the 2010s mean
• about 1,440,000 km² below the 2000s mean
• about 2,170,000 km² below the 1990s mean
• about 2,410,000 km² below the 1980s mean
More zacklabe.com/arctic-sea-i...
• about 520,000 km² below the 2010s mean
• about 1,440,000 km² below the 2000s mean
• about 2,170,000 km² below the 1990s mean
• about 2,410,000 km² below the 1980s mean
More zacklabe.com/arctic-sea-i...