


Zack Labe
@zacklabe.com
Climate Scientist at @climatecentral.org | PhD | Passionate about improving science communication through data-driven stories | Harrisburg, PA | https://zacklabe.com/
Views, thoughts, and opinions expressed here are only my own.
Views, thoughts, and opinions expressed here are only my own.
Temperature anomalies over the last month (left), 3 months (center), and 12 months (right) across the Southern Hemisphere. Red areas denote warmer than average temperatures and blue areas colder than average.
Data from @copernicusecmwf.bsky.social ERA5 reanalysis.
Data from @copernicusecmwf.bsky.social ERA5 reanalysis.

November 13, 2025 at 10:35 PM
Temperature anomalies over the last month (left), 3 months (center), and 12 months (right) across the Southern Hemisphere. Red areas denote warmer than average temperatures and blue areas colder than average.
Data from @copernicusecmwf.bsky.social ERA5 reanalysis.
Data from @copernicusecmwf.bsky.social ERA5 reanalysis.
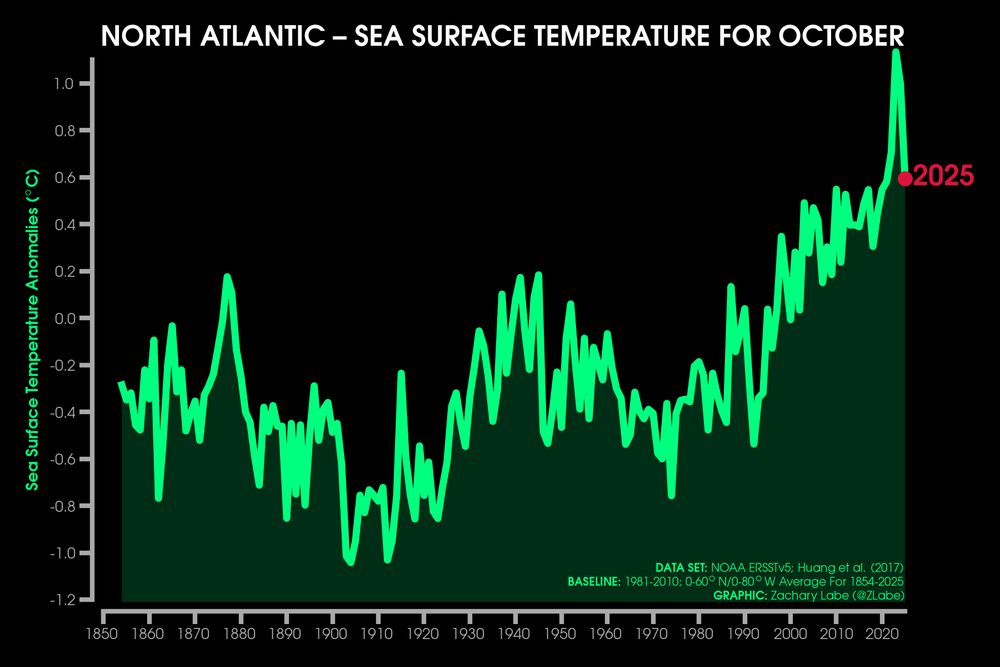
While still warmer than any other years since the mid-1800s, sea surface temperatures in the northern half of the Atlantic Ocean remain well below their recent peak (i.e., climate change and climate variability).
Graphic using NOAA ERSSTv5 data (www.ncei.noaa.gov/products/ext...).
Graphic using NOAA ERSSTv5 data (www.ncei.noaa.gov/products/ext...).
November 12, 2025 at 12:57 PM
While still warmer than any other years since the mid-1800s, sea surface temperatures in the northern half of the Atlantic Ocean remain well below their recent peak (i.e., climate change and climate variability).
Graphic using NOAA ERSSTv5 data (www.ncei.noaa.gov/products/ext...).
Graphic using NOAA ERSSTv5 data (www.ncei.noaa.gov/products/ext...).
Average temperature departures by month in the #Antarctic since the year 1940.
Data from @copernicusecmwf.bsky.social ERA5 reanalysis.
Data from @copernicusecmwf.bsky.social ERA5 reanalysis.

November 11, 2025 at 11:57 PM
Average temperature departures by month in the #Antarctic since the year 1940.
Data from @copernicusecmwf.bsky.social ERA5 reanalysis.
Data from @copernicusecmwf.bsky.social ERA5 reanalysis.
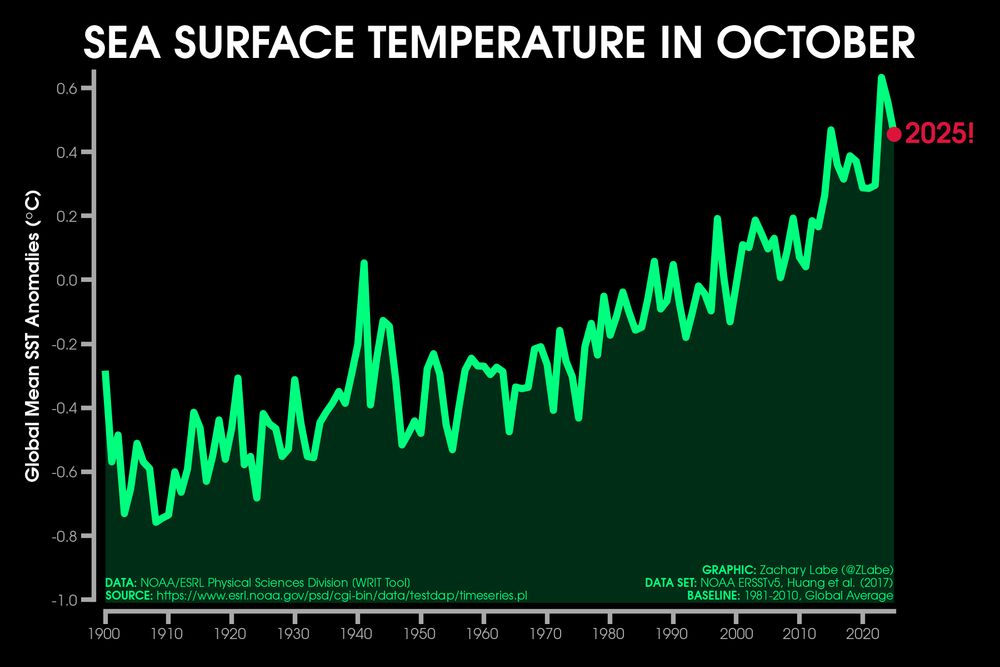
Last month was the 4th warmest October on record for the average global sea surface temperature... 🌊
Graphic using NOAA ERSSTv5 data. Methods described in doi.org/10.1175/JCLI....
Graphic using NOAA ERSSTv5 data. Methods described in doi.org/10.1175/JCLI....
November 11, 2025 at 2:31 PM
Last month was the 4th warmest October on record for the average global sea surface temperature... 🌊
Graphic using NOAA ERSSTv5 data. Methods described in doi.org/10.1175/JCLI....
Graphic using NOAA ERSSTv5 data. Methods described in doi.org/10.1175/JCLI....
Impossible to ignore what’s happening to #Arctic temperatures in the month of November...
Data from @copernicusecmwf.bsky.social ERA5 reanalysis.
Data from @copernicusecmwf.bsky.social ERA5 reanalysis.

November 11, 2025 at 12:10 AM
Impossible to ignore what’s happening to #Arctic temperatures in the month of November...
Data from @copernicusecmwf.bsky.social ERA5 reanalysis.
Data from @copernicusecmwf.bsky.social ERA5 reanalysis.
Here is a map view of the record high temperatures in October 2025 across the #Antarctic. Compare this blob of anomalies greater than 5°C with the Arctic from my earlier post. Yikes!
Data from doi.org/10.24381/cds... using a 1981-2010 reference period.
Data from doi.org/10.24381/cds... using a 1981-2010 reference period.

November 10, 2025 at 5:56 PM
Here is a map view of the record high temperatures in October 2025 across the #Antarctic. Compare this blob of anomalies greater than 5°C with the Arctic from my earlier post. Yikes!
Data from doi.org/10.24381/cds... using a 1981-2010 reference period.
Data from doi.org/10.24381/cds... using a 1981-2010 reference period.
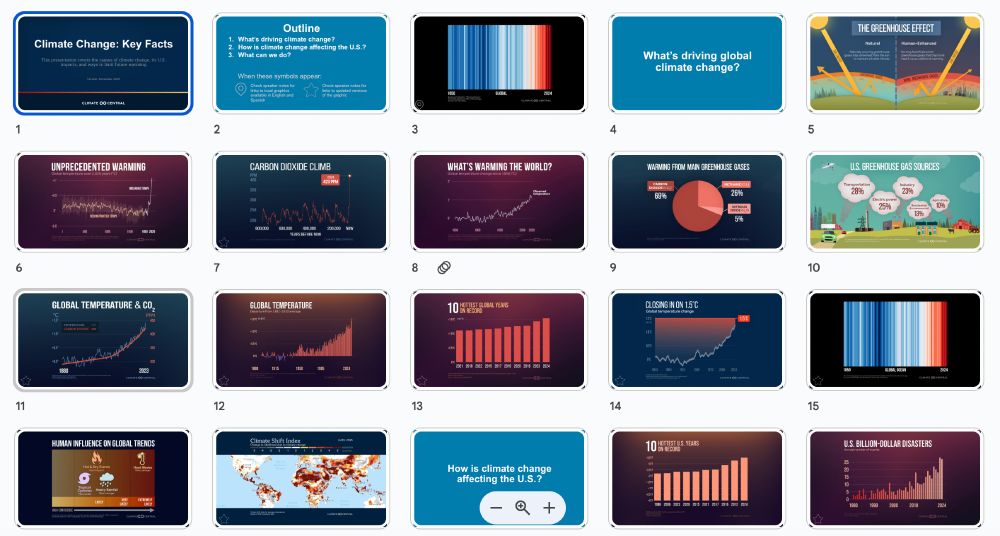
📣 We just released a new free resource at @climatecentral.org - a 72-slide deck introducing key facts about climate change, including its causes, impacts, and solutions. It also comes with speaker notes and links for local storytelling.
➡️ www.climatecentral.org/climate-matt... (English & Spanish)
➡️ www.climatecentral.org/climate-matt... (English & Spanish)
November 10, 2025 at 12:52 PM
📣 We just released a new free resource at @climatecentral.org - a 72-slide deck introducing key facts about climate change, including its causes, impacts, and solutions. It also comes with speaker notes and links for local storytelling.
➡️ www.climatecentral.org/climate-matt... (English & Spanish)
➡️ www.climatecentral.org/climate-matt... (English & Spanish)
Record high ocean temperatures continued across the North Pacific in October 2025, with recent warming really amplifying since the early 2000s.
This graph shows the average for a band across the midlatitudes for every October from 1854-2025 using
NOAA ERSSTv5 data (psl.noaa.gov/data/gridded...).
This graph shows the average for a band across the midlatitudes for every October from 1854-2025 using
NOAA ERSSTv5 data (psl.noaa.gov/data/gridded...).

November 9, 2025 at 5:43 PM
Record high ocean temperatures continued across the North Pacific in October 2025, with recent warming really amplifying since the early 2000s.
This graph shows the average for a band across the midlatitudes for every October from 1854-2025 using
NOAA ERSSTv5 data (psl.noaa.gov/data/gridded...).
This graph shows the average for a band across the midlatitudes for every October from 1854-2025 using
NOAA ERSSTv5 data (psl.noaa.gov/data/gridded...).
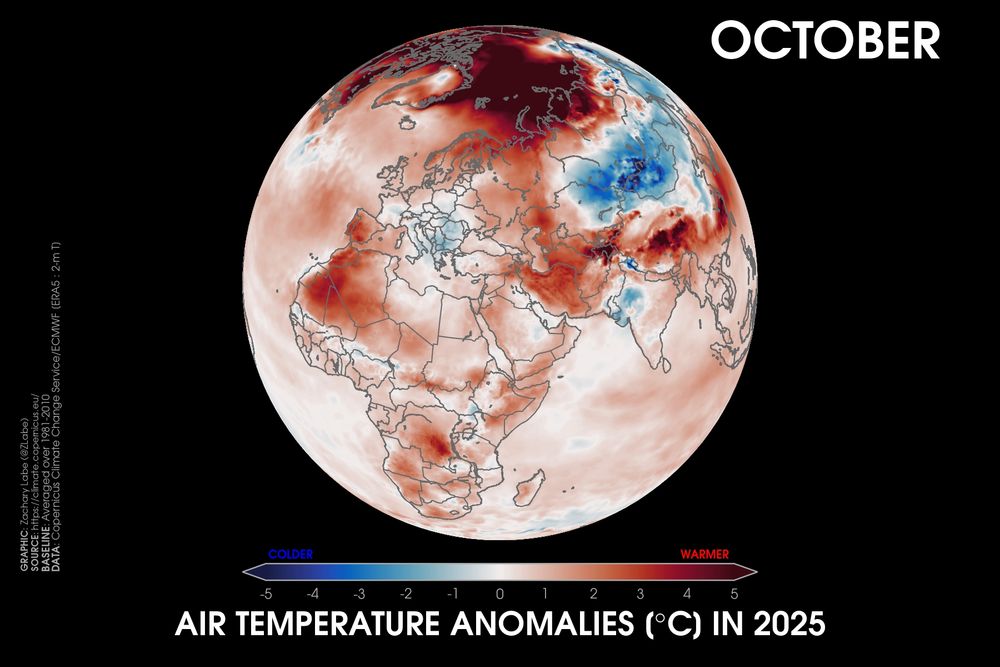
Here's a look at the extent of the "warmth" across the #Arctic in October. This map uses my normal anomaly scaling for each month, but it clearly doesn't work for something this extreme.
Data from doi.org/10.24381/cds...
Data from doi.org/10.24381/cds...

November 9, 2025 at 2:04 PM
Here's a look at the extent of the "warmth" across the #Arctic in October. This map uses my normal anomaly scaling for each month, but it clearly doesn't work for something this extreme.
Data from doi.org/10.24381/cds...
Data from doi.org/10.24381/cds...
October 2025 was the 3rd warmest October on record for our planet, following 2023 (1st place) and 2024 (2nd place). This month was about 1.55°C above the 1850-1900 pre-industrial average. The last 12-months have been about 1.50°C above it.
Summary of month: climate.copernicus.eu/surface-air-... 🛠️🧪🌊
Summary of month: climate.copernicus.eu/surface-air-... 🛠️🧪🌊


November 8, 2025 at 10:31 PM
October 2025 was the 3rd warmest October on record for our planet, following 2023 (1st place) and 2024 (2nd place). This month was about 1.55°C above the 1850-1900 pre-industrial average. The last 12-months have been about 1.50°C above it.
Summary of month: climate.copernicus.eu/surface-air-... 🛠️🧪🌊
Summary of month: climate.copernicus.eu/surface-air-... 🛠️🧪🌊
It's not every day that both poles set new monthly temperature records (see my earlier post). Last month also observed the warmest October on record for the #Arctic Circle. Not great!!
Data provided by doi.org/10.24381/cds....
Data provided by doi.org/10.24381/cds....

November 8, 2025 at 2:07 PM
It's not every day that both poles set new monthly temperature records (see my earlier post). Last month also observed the warmest October on record for the #Arctic Circle. Not great!!
Data provided by doi.org/10.24381/cds....
Data provided by doi.org/10.24381/cds....
The @wmo-global.bsky.social provisional report on the State of the Global Climate in 2025 was released: wmo.int/publication-...
"Other climate indicators continue to sound alarm
bells, and more extreme weather had major global impacts on
economies and all aspects of sustainable development." #COP30
"Other climate indicators continue to sound alarm
bells, and more extreme weather had major global impacts on
economies and all aspects of sustainable development." #COP30

November 7, 2025 at 8:13 PM
The @wmo-global.bsky.social provisional report on the State of the Global Climate in 2025 was released: wmo.int/publication-...
"Other climate indicators continue to sound alarm
bells, and more extreme weather had major global impacts on
economies and all aspects of sustainable development." #COP30
"Other climate indicators continue to sound alarm
bells, and more extreme weather had major global impacts on
economies and all aspects of sustainable development." #COP30
🚨 Last month observed the highest average temperature for the month of October across the #Antarctic Circle, with clearly 2025 well above any prior year in the satellite era.
Data from doi.org/10.24381/cds...
Data from doi.org/10.24381/cds...

November 7, 2025 at 5:40 PM
🚨 Last month observed the highest average temperature for the month of October across the #Antarctic Circle, with clearly 2025 well above any prior year in the satellite era.
Data from doi.org/10.24381/cds...
Data from doi.org/10.24381/cds...
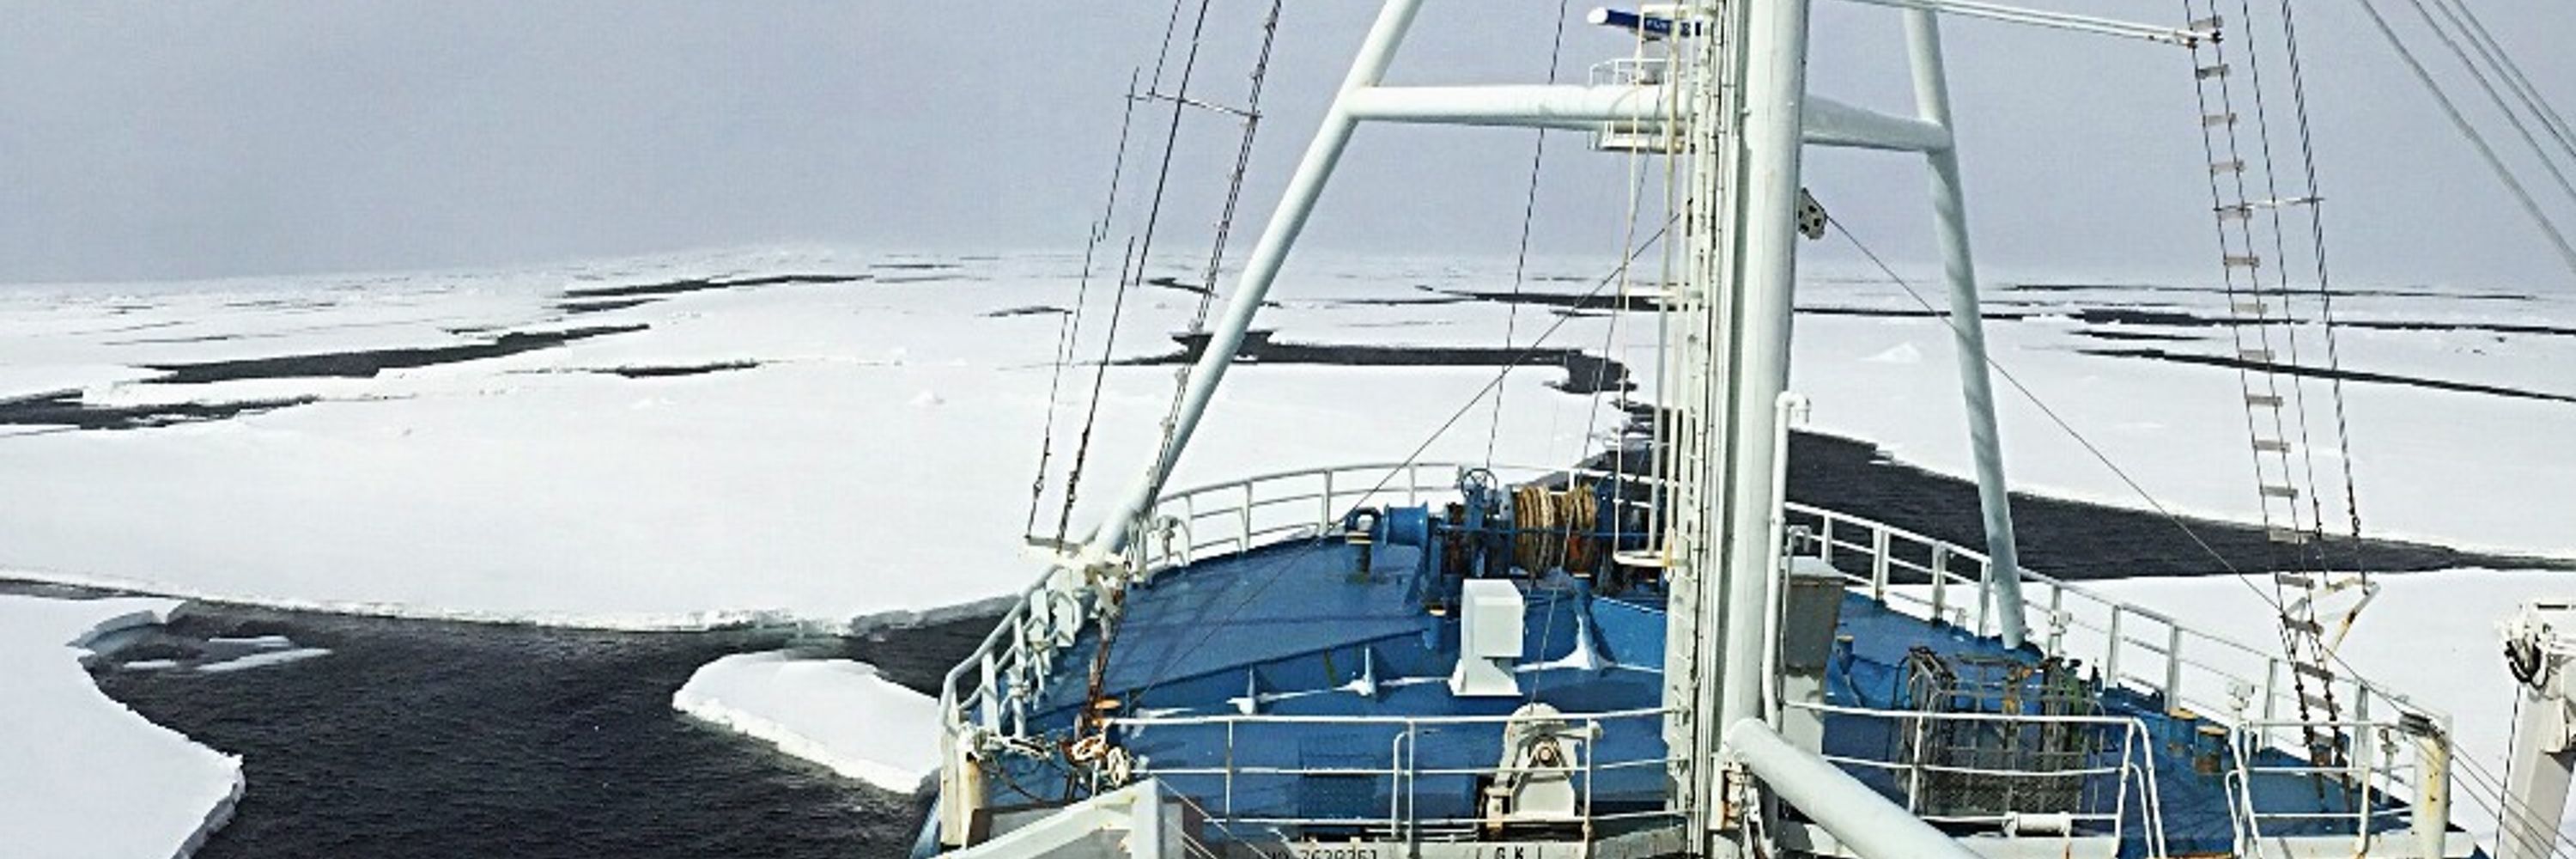
Friday ice update - #Arctic sea ice extent is currently the 3rd lowest on record (JAXA data)
• about 740,000 km² below the 2010s mean
• about 1,500,000 km² below the 2000s mean
• about 2,120,000 km² below the 1990s mean
• about 2,400,000 km² below the 1980s mean
More: zacklabe.com/arctic-sea-i...
• about 740,000 km² below the 2010s mean
• about 1,500,000 km² below the 2000s mean
• about 2,120,000 km² below the 1990s mean
• about 2,400,000 km² below the 1980s mean
More: zacklabe.com/arctic-sea-i...
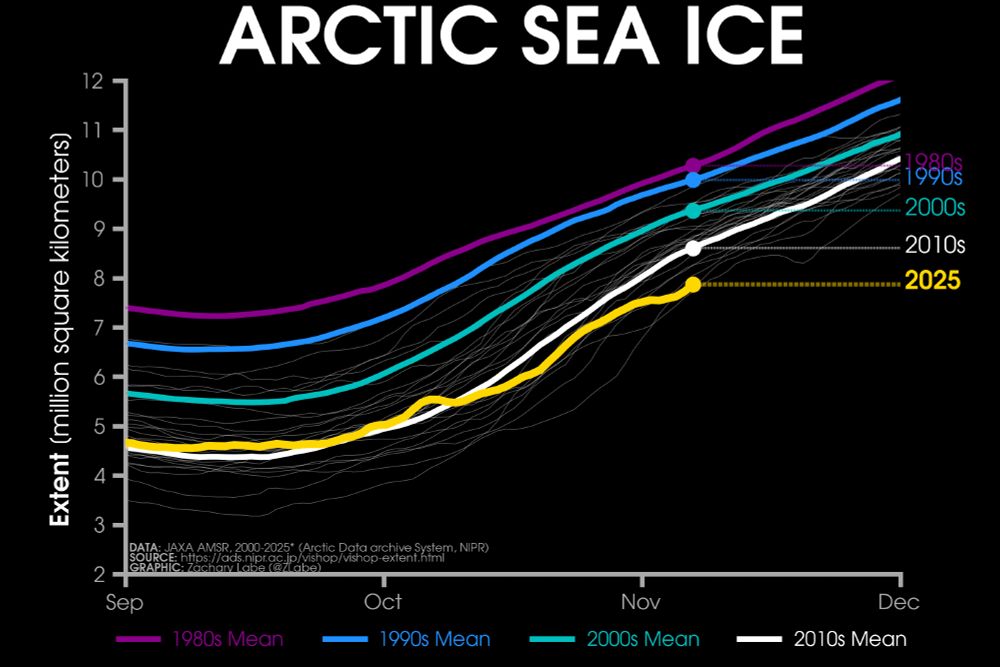
November 7, 2025 at 1:55 PM
Friday ice update - #Arctic sea ice extent is currently the 3rd lowest on record (JAXA data)
• about 740,000 km² below the 2010s mean
• about 1,500,000 km² below the 2000s mean
• about 2,120,000 km² below the 1990s mean
• about 2,400,000 km² below the 1980s mean
More: zacklabe.com/arctic-sea-i...
• about 740,000 km² below the 2010s mean
• about 1,500,000 km² below the 2000s mean
• about 2,120,000 km² below the 1990s mean
• about 2,400,000 km² below the 1980s mean
More: zacklabe.com/arctic-sea-i...
Patterns of November temperatures in the #Antarctic when averaged by decade... There is a warming trend.
Data from @copernicusecmwf.bsky.social ERA5 reanalysis.
Data from @copernicusecmwf.bsky.social ERA5 reanalysis.

November 7, 2025 at 12:28 PM
Patterns of November temperatures in the #Antarctic when averaged by decade... There is a warming trend.
Data from @copernicusecmwf.bsky.social ERA5 reanalysis.
Data from @copernicusecmwf.bsky.social ERA5 reanalysis.
Not every month will set a new record, but the warming trend is obvious. This graphic shows #Arctic air temperature rank by month over the satellite era - now updated through October 2025... 🧪
+ Ranks: 1=warmest (red), 46/47=coldest (blue)
+ Download higher resolution: zacklabe.com/arctic-tempe...
+ Ranks: 1=warmest (red), 46/47=coldest (blue)
+ Download higher resolution: zacklabe.com/arctic-tempe...

November 6, 2025 at 8:59 PM
Not every month will set a new record, but the warming trend is obvious. This graphic shows #Arctic air temperature rank by month over the satellite era - now updated through October 2025... 🧪
+ Ranks: 1=warmest (red), 46/47=coldest (blue)
+ Download higher resolution: zacklabe.com/arctic-tempe...
+ Ranks: 1=warmest (red), 46/47=coldest (blue)
+ Download higher resolution: zacklabe.com/arctic-tempe...
Reconstructing October #Arctic sea ice extent since 1850...
Data from @nsidc.bsky.social at doi.org/10.7265/jj4s...
Data from @nsidc.bsky.social at doi.org/10.7265/jj4s...

November 6, 2025 at 12:20 PM
Reconstructing October #Arctic sea ice extent since 1850...
Data from @nsidc.bsky.social at doi.org/10.7265/jj4s...
Data from @nsidc.bsky.social at doi.org/10.7265/jj4s...
Trends in November temperatures over land areas (where we live) for the last 50 years... 🔥
Data from NOAAGlobalTempv6.0.0. (www.ncei.noaa.gov/products/lan...)
Data from NOAAGlobalTempv6.0.0. (www.ncei.noaa.gov/products/lan...)

November 6, 2025 at 1:37 AM
Trends in November temperatures over land areas (where we live) for the last 50 years... 🔥
Data from NOAAGlobalTempv6.0.0. (www.ncei.noaa.gov/products/lan...)
Data from NOAAGlobalTempv6.0.0. (www.ncei.noaa.gov/products/lan...)
October 2025 #Arctic sea ice extent was the 8th lowest on record for the month...
This was 2,030,000 km² below the 1981-2010 average. October ice extent is decreasing at about 9.39% per decade. Data @nsidc.bsky.social: nsidc.org/data/seaice_...
This was 2,030,000 km² below the 1981-2010 average. October ice extent is decreasing at about 9.39% per decade. Data @nsidc.bsky.social: nsidc.org/data/seaice_...
November 5, 2025 at 12:46 PM
October 2025 #Arctic sea ice extent was the 8th lowest on record for the month...
This was 2,030,000 km² below the 1981-2010 average. October ice extent is decreasing at about 9.39% per decade. Data @nsidc.bsky.social: nsidc.org/data/seaice_...
This was 2,030,000 km² below the 1981-2010 average. October ice extent is decreasing at about 9.39% per decade. Data @nsidc.bsky.social: nsidc.org/data/seaice_...
Last month was the 3rd lowest #Antarctic sea ice extent on record for the month of October.
This was 1,140,000 km² below the 1981-2010 October average. Data from the @nsidc.bsky.social: nsidc.org/data/seaice_...
This was 1,140,000 km² below the 1981-2010 October average. Data from the @nsidc.bsky.social: nsidc.org/data/seaice_...
November 4, 2025 at 12:10 AM
Last month was the 3rd lowest #Antarctic sea ice extent on record for the month of October.
This was 1,140,000 km² below the 1981-2010 October average. Data from the @nsidc.bsky.social: nsidc.org/data/seaice_...
This was 1,140,000 km² below the 1981-2010 October average. Data from the @nsidc.bsky.social: nsidc.org/data/seaice_...
Monday ice update - #Arctic sea ice extent is currently the 3rd lowest on record (JAXA data)
• about 710,000 km² below the 2010s mean
• about 1,580,000 km² below the 2000s mean
• about 2,250,000 km² below the 1990s mean
• about 2,490,000 km² below the 1980s mean
More: zacklabe.com/arctic-sea-i...
• about 710,000 km² below the 2010s mean
• about 1,580,000 km² below the 2000s mean
• about 2,250,000 km² below the 1990s mean
• about 2,490,000 km² below the 1980s mean
More: zacklabe.com/arctic-sea-i...
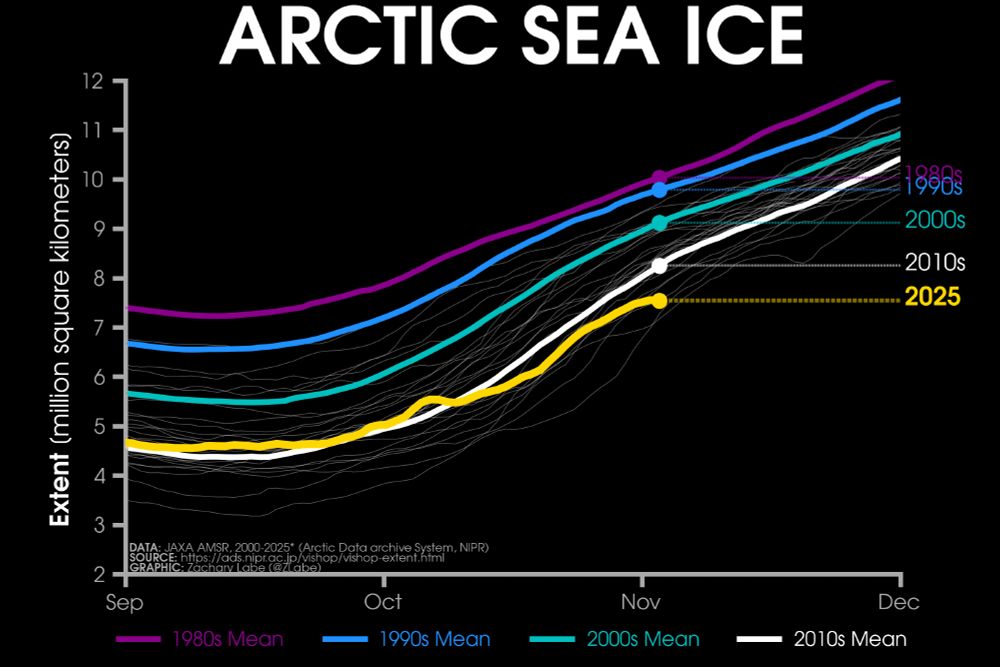
November 3, 2025 at 1:47 PM
Monday ice update - #Arctic sea ice extent is currently the 3rd lowest on record (JAXA data)
• about 710,000 km² below the 2010s mean
• about 1,580,000 km² below the 2000s mean
• about 2,250,000 km² below the 1990s mean
• about 2,490,000 km² below the 1980s mean
More: zacklabe.com/arctic-sea-i...
• about 710,000 km² below the 2010s mean
• about 1,580,000 km² below the 2000s mean
• about 2,250,000 km² below the 1990s mean
• about 2,490,000 km² below the 1980s mean
More: zacklabe.com/arctic-sea-i...
Simulated reconstruction of November #Arctic sea ice thickness since 1901. Watch for the last 10 years or so...
Information about this data set is available at psc.apl.uw.edu/research/pro.... Note that it is only updated through 2010 due to ERA-20C forcing.
Information about this data set is available at psc.apl.uw.edu/research/pro.... Note that it is only updated through 2010 due to ERA-20C forcing.
November 3, 2025 at 12:32 PM
Simulated reconstruction of November #Arctic sea ice thickness since 1901. Watch for the last 10 years or so...
Information about this data set is available at psc.apl.uw.edu/research/pro.... Note that it is only updated through 2010 due to ERA-20C forcing.
Information about this data set is available at psc.apl.uw.edu/research/pro.... Note that it is only updated through 2010 due to ERA-20C forcing.
100 years of changing November sea ice...
Total data set available from 1850 through 2017. Summary of methods: www.carbonbrief.org/guest-post-p.... More sea ice reconstructions at zacklabe.com/arctic-sea-i....
Total data set available from 1850 through 2017. Summary of methods: www.carbonbrief.org/guest-post-p.... More sea ice reconstructions at zacklabe.com/arctic-sea-i....
November 2, 2025 at 12:57 PM
100 years of changing November sea ice...
Total data set available from 1850 through 2017. Summary of methods: www.carbonbrief.org/guest-post-p.... More sea ice reconstructions at zacklabe.com/arctic-sea-i....
Total data set available from 1850 through 2017. Summary of methods: www.carbonbrief.org/guest-post-p.... More sea ice reconstructions at zacklabe.com/arctic-sea-i....
Saturday ice update - #Arctic sea ice extent is currently the 4th lowest on record (JAXA data)
• about 520,000 km² below the 2010s mean
• about 1,440,000 km² below the 2000s mean
• about 2,170,000 km² below the 1990s mean
• about 2,410,000 km² below the 1980s mean
More zacklabe.com/arctic-sea-i...
• about 520,000 km² below the 2010s mean
• about 1,440,000 km² below the 2000s mean
• about 2,170,000 km² below the 1990s mean
• about 2,410,000 km² below the 1980s mean
More zacklabe.com/arctic-sea-i...

November 1, 2025 at 11:56 PM
Saturday ice update - #Arctic sea ice extent is currently the 4th lowest on record (JAXA data)
• about 520,000 km² below the 2010s mean
• about 1,440,000 km² below the 2000s mean
• about 2,170,000 km² below the 1990s mean
• about 2,410,000 km² below the 1980s mean
More zacklabe.com/arctic-sea-i...
• about 520,000 km² below the 2010s mean
• about 1,440,000 km² below the 2000s mean
• about 2,170,000 km² below the 1990s mean
• about 2,410,000 km² below the 1980s mean
More zacklabe.com/arctic-sea-i...
Welcome to November! Here's a look at how temperatures have changed around our planet over the last four decades...
Data from doi.org/10.24381/cds...
Data from doi.org/10.24381/cds...

November 1, 2025 at 1:13 PM
Welcome to November! Here's a look at how temperatures have changed around our planet over the last four decades...
Data from doi.org/10.24381/cds...
Data from doi.org/10.24381/cds...