


@squirl-ness.bsky.social
Reposted

I take a deep dive into the Polar Vortex in my new vid:
Recent Polar Vortex Splitting, Displacement, and Elongation is Driving Our Bizarre Weather
youtu.be/Wrm_eYmOQTM?si…#climatet#ClimateEducationo#weathere#WeatherForecasts#ClimateActiono#atmospherer#NCARA#sciencec#educationon
Recent Polar Vortex Splitting, Displacement, and Elongation is Driving Our Bizarre Weather
youtu.be/Wrm_eYmOQTM?si…#climatet#ClimateEducationo#weathere#WeatherForecasts#ClimateActiono#atmospherer#NCARA#sciencec#educationon

Recent Polar Vortex Splitting, Displacement, and Elongation is Driving Our Bizarre Weather
YouTube video by Paul Beckwith
https://youtu.be/Wrm_eYmOQTM?si…
December 21, 2025 at 1:16 AM
I take a deep dive into the Polar Vortex in my new vid:
Recent Polar Vortex Splitting, Displacement, and Elongation is Driving Our Bizarre Weather
youtu.be/Wrm_eYmOQTM?si…#climatet#ClimateEducationo#weathere#WeatherForecasts#ClimateActiono#atmospherer#NCARA#sciencec#educationon
Recent Polar Vortex Splitting, Displacement, and Elongation is Driving Our Bizarre Weather
youtu.be/Wrm_eYmOQTM?si…#climatet#ClimateEducationo#weathere#WeatherForecasts#ClimateActiono#atmospherer#NCARA#sciencec#educationon
Reposted

Oh no... Seeing the direct tweet is even more frightening. Every day is a new crisis, and the repercussions are unimaginable.

An absolute bedrock institution for understanding how the planet works, just civilization-scaled vandalism by the most incurious morons on Earth

December 17, 2025 at 2:56 AM
Oh no... Seeing the direct tweet is even more frightening. Every day is a new crisis, and the repercussions are unimaginable.
Reposted
Carbon dioxide (CO₂) averaged about 426 ppm in November 2025
10 years ago November averaged about 400 ppm
Data available at gml.noaa.gov/ccgg/trends/
10 years ago November averaged about 400 ppm
Data available at gml.noaa.gov/ccgg/trends/

December 7, 2025 at 2:11 PM
Carbon dioxide (CO₂) averaged about 426 ppm in November 2025
10 years ago November averaged about 400 ppm
Data available at gml.noaa.gov/ccgg/trends/
10 years ago November averaged about 400 ppm
Data available at gml.noaa.gov/ccgg/trends/
Reposted
October 2025 was the warmest October on record for the #Arctic. Arctic sea-ice extent is currently the lowest on record for late November. My newest 'climate viz of the month' summarizes some of this latest data: zacklabe.com/climate-viz-...
#ClimateChange #SciComm #OpenScience #OpenData #DataViz
#ClimateChange #SciComm #OpenScience #OpenData #DataViz

Climate Viz of the Month
October 2025 Hi everyone! Instead of designing a new special feature visualization, this next ‘climate viz of the month’ blog will focus on briefly summarizing the recent extremes in th…
zacklabe.com
November 29, 2025 at 8:42 PM
October 2025 was the warmest October on record for the #Arctic. Arctic sea-ice extent is currently the lowest on record for late November. My newest 'climate viz of the month' summarizes some of this latest data: zacklabe.com/climate-viz-...
#ClimateChange #SciComm #OpenScience #OpenData #DataViz
#ClimateChange #SciComm #OpenScience #OpenData #DataViz
Reposted
Climate Change Impacts on Everything; Many Very Surprising Insights… Paul’s Back:)
youtu.be/sfivua9O_Gg?...
#climate #ClimateCrisis #ClimateTech #ClimateScience #COP30 #weather #science
youtu.be/sfivua9O_Gg?...
#climate #ClimateCrisis #ClimateTech #ClimateScience #COP30 #weather #science

Climate Change Impacts on Everything; Many Very Surprising Insights… Paul’s Back…
YouTube video by Paul Beckwith
youtu.be
November 8, 2025 at 8:28 PM
Climate Change Impacts on Everything; Many Very Surprising Insights… Paul’s Back:)
youtu.be/sfivua9O_Gg?...
#climate #ClimateCrisis #ClimateTech #ClimateScience #COP30 #weather #science
youtu.be/sfivua9O_Gg?...
#climate #ClimateCrisis #ClimateTech #ClimateScience #COP30 #weather #science
Reposted
It's not every day that both poles set new monthly temperature records (see my earlier post). Last month also observed the warmest October on record for the #Arctic Circle. Not great!!
Data provided by doi.org/10.24381/cds....
Data provided by doi.org/10.24381/cds....

November 8, 2025 at 2:07 PM
It's not every day that both poles set new monthly temperature records (see my earlier post). Last month also observed the warmest October on record for the #Arctic Circle. Not great!!
Data provided by doi.org/10.24381/cds....
Data provided by doi.org/10.24381/cds....
Reposted
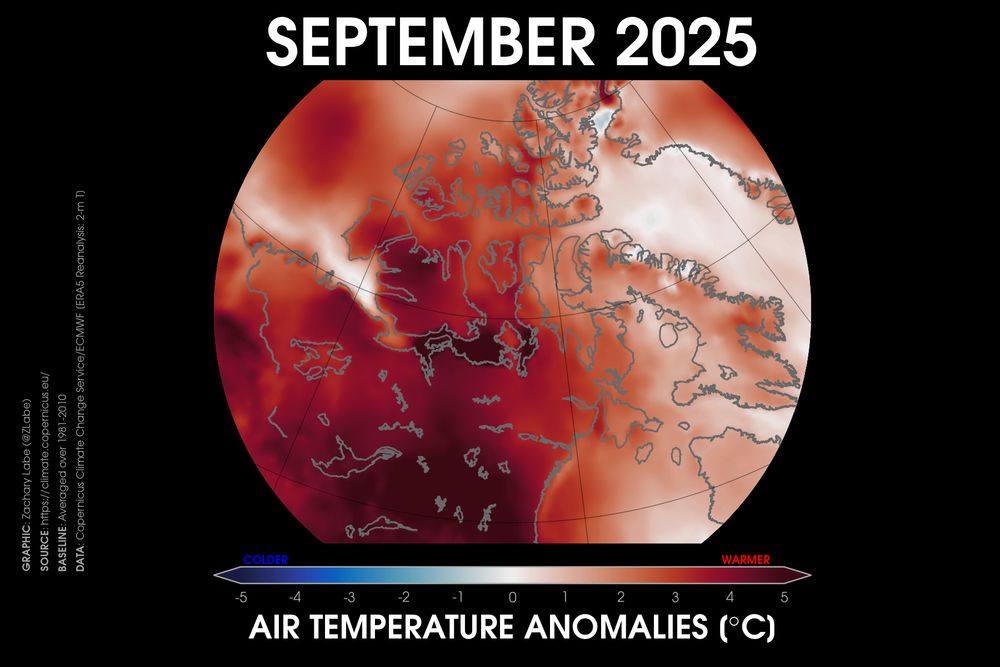
Temperatures were warmer than 5°C above the 1981-2010 average in September 2025 across northern Canada and into the Canadian Arctic Archipelago. The southern route of the Northwest Passage was ice-free and open for transit this past melt season.
Data freely available from doi.org/10.24381/cds...
Data freely available from doi.org/10.24381/cds...
October 12, 2025 at 1:13 PM
Temperatures were warmer than 5°C above the 1981-2010 average in September 2025 across northern Canada and into the Canadian Arctic Archipelago. The southern route of the Northwest Passage was ice-free and open for transit this past melt season.
Data freely available from doi.org/10.24381/cds...
Data freely available from doi.org/10.24381/cds...
Reposted
Last month observed temperature departures more than 5°C above the 1981-2010 average across nearly the entire Kara Sea region and across parts of northern Siberia.
Data from doi.org/10.24381/cds...
Data from doi.org/10.24381/cds...
September 13, 2025 at 1:11 PM
Last month observed temperature departures more than 5°C above the 1981-2010 average across nearly the entire Kara Sea region and across parts of northern Siberia.
Data from doi.org/10.24381/cds...
Data from doi.org/10.24381/cds...
Reposted
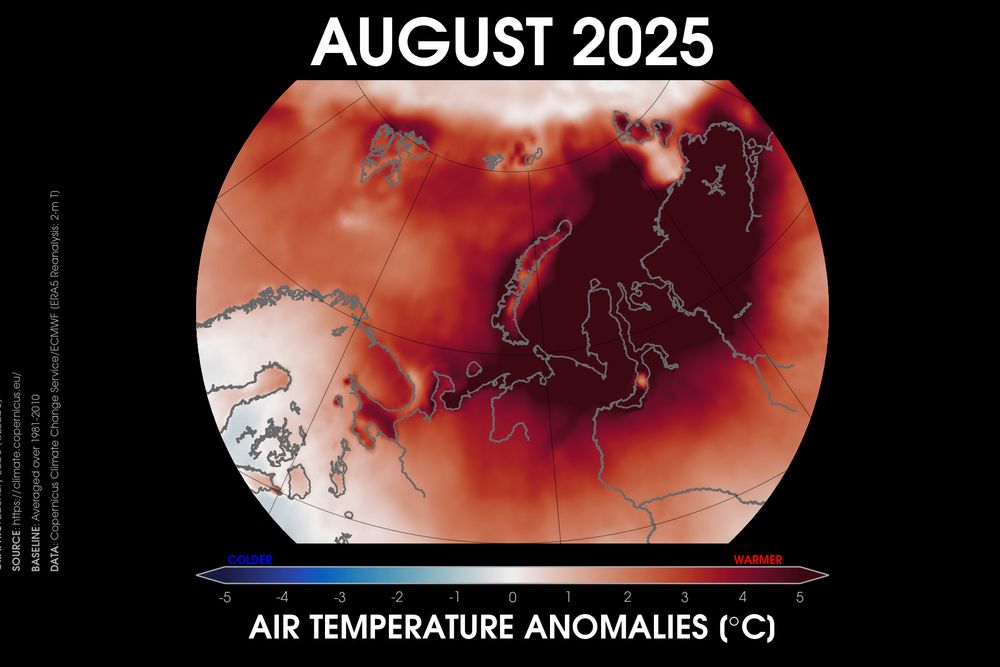
The massive extreme marine heatwave continues to stretch across the entire northern Pacific Ocean. In fact, the magnitude of the sea surface temperature anomalies even grew in August 2025 compared to earlier in the summer. Yikes... 🫠
Data from OISSTv2.1 (psl.noaa.gov/data/gridded...). 🌊
Data from OISSTv2.1 (psl.noaa.gov/data/gridded...). 🌊

September 11, 2025 at 4:38 PM
The massive extreme marine heatwave continues to stretch across the entire northern Pacific Ocean. In fact, the magnitude of the sea surface temperature anomalies even grew in August 2025 compared to earlier in the summer. Yikes... 🫠
Data from OISSTv2.1 (psl.noaa.gov/data/gridded...). 🌊
Data from OISSTv2.1 (psl.noaa.gov/data/gridded...). 🌊
Reposted
My new video…
One of my most important videos ever…
No kidding…
Antarctica Tipping Points: Why I Now Predict an Antarctic Blue Ocean Event Within 10-15 Years
youtu.be/kz_MilyXkk0?...
#ClimateCrisis #climate #ClimateTech #Arctic #Antarctic #Antarctica #weather
One of my most important videos ever…
No kidding…
Antarctica Tipping Points: Why I Now Predict an Antarctic Blue Ocean Event Within 10-15 Years
youtu.be/kz_MilyXkk0?...
#ClimateCrisis #climate #ClimateTech #Arctic #Antarctic #Antarctica #weather

Antarctica Tipping Points: Why I Now Predict an Antarctic Blue Ocean Event within 10-15 Years
YouTube video by Paul Beckwith
youtu.be
August 22, 2025 at 9:35 PM
My new video…
One of my most important videos ever…
No kidding…
Antarctica Tipping Points: Why I Now Predict an Antarctic Blue Ocean Event Within 10-15 Years
youtu.be/kz_MilyXkk0?...
#ClimateCrisis #climate #ClimateTech #Arctic #Antarctic #Antarctica #weather
One of my most important videos ever…
No kidding…
Antarctica Tipping Points: Why I Now Predict an Antarctic Blue Ocean Event Within 10-15 Years
youtu.be/kz_MilyXkk0?...
#ClimateCrisis #climate #ClimateTech #Arctic #Antarctic #Antarctica #weather
Reposted
Climate data highlights from this month:
⚠️ Arctic ice extent lowest on record for time of year: bsky.app/profile/zack...
⚠️ New ocean heat content record: bsky.app/profile/zack...
⚠️ Temperatures over land record high (Jan-May): bsky.app/profile/zack...
⚠️ New CO₂ record high: bsky.app/profile/zack...
⚠️ Arctic ice extent lowest on record for time of year: bsky.app/profile/zack...
⚠️ New ocean heat content record: bsky.app/profile/zack...
⚠️ Temperatures over land record high (Jan-May): bsky.app/profile/zack...
⚠️ New CO₂ record high: bsky.app/profile/zack...
🚨 Carbon dioxide (CO₂) levels set a new monthly *record high* in May 2025 - 430.51 ppm (seasonal maximum)
This is the second largest May-May increase in this dataset (3.6 ppm higher than 2024). This is not good... 🫣
Data from gml.noaa.gov/ccgg/trends/
This is the second largest May-May increase in this dataset (3.6 ppm higher than 2024). This is not good... 🫣
Data from gml.noaa.gov/ccgg/trends/

June 29, 2025 at 1:17 PM
Climate data highlights from this month:
⚠️ Arctic ice extent lowest on record for time of year: bsky.app/profile/zack...
⚠️ New ocean heat content record: bsky.app/profile/zack...
⚠️ Temperatures over land record high (Jan-May): bsky.app/profile/zack...
⚠️ New CO₂ record high: bsky.app/profile/zack...
⚠️ Arctic ice extent lowest on record for time of year: bsky.app/profile/zack...
⚠️ New ocean heat content record: bsky.app/profile/zack...
⚠️ Temperatures over land record high (Jan-May): bsky.app/profile/zack...
⚠️ New CO₂ record high: bsky.app/profile/zack...
Reposted
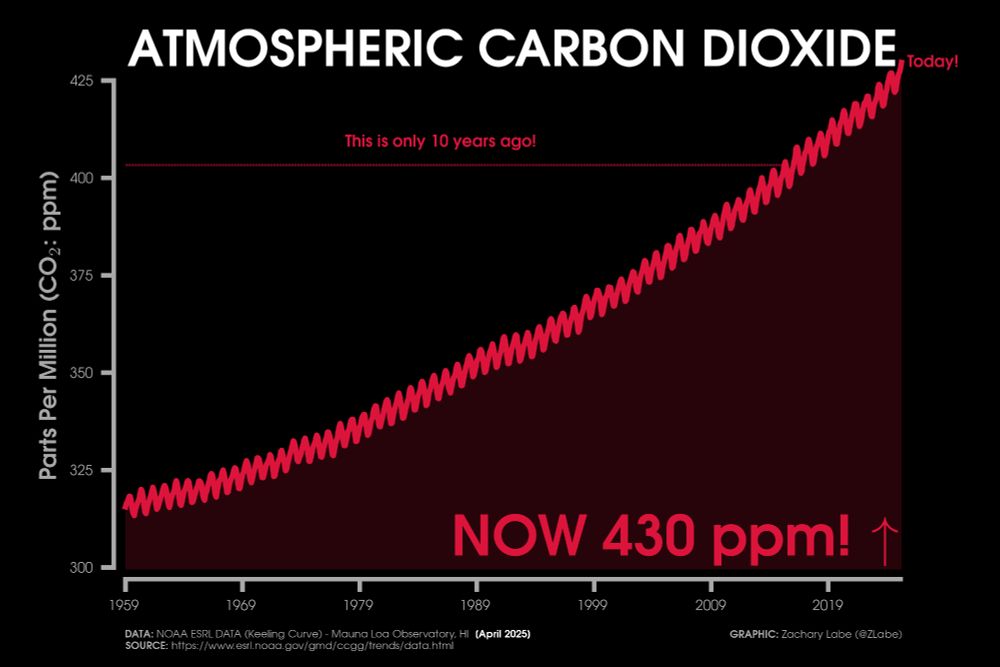
Carbon dioxide (CO₂) averaged nearly 430 ppm in April 2025 (new record high)
10 years ago April averaged about 404 ppm. Preliminary data from gml.noaa.gov/ccgg/trends/...
This isn't going away. The longer we wait to address climate change, the greater the impacts and the harder it becomes to solve
10 years ago April averaged about 404 ppm. Preliminary data from gml.noaa.gov/ccgg/trends/...
This isn't going away. The longer we wait to address climate change, the greater the impacts and the harder it becomes to solve
May 6, 2025 at 11:49 AM
Carbon dioxide (CO₂) averaged nearly 430 ppm in April 2025 (new record high)
10 years ago April averaged about 404 ppm. Preliminary data from gml.noaa.gov/ccgg/trends/...
This isn't going away. The longer we wait to address climate change, the greater the impacts and the harder it becomes to solve
10 years ago April averaged about 404 ppm. Preliminary data from gml.noaa.gov/ccgg/trends/...
This isn't going away. The longer we wait to address climate change, the greater the impacts and the harder it becomes to solve
Reposted


Reposted
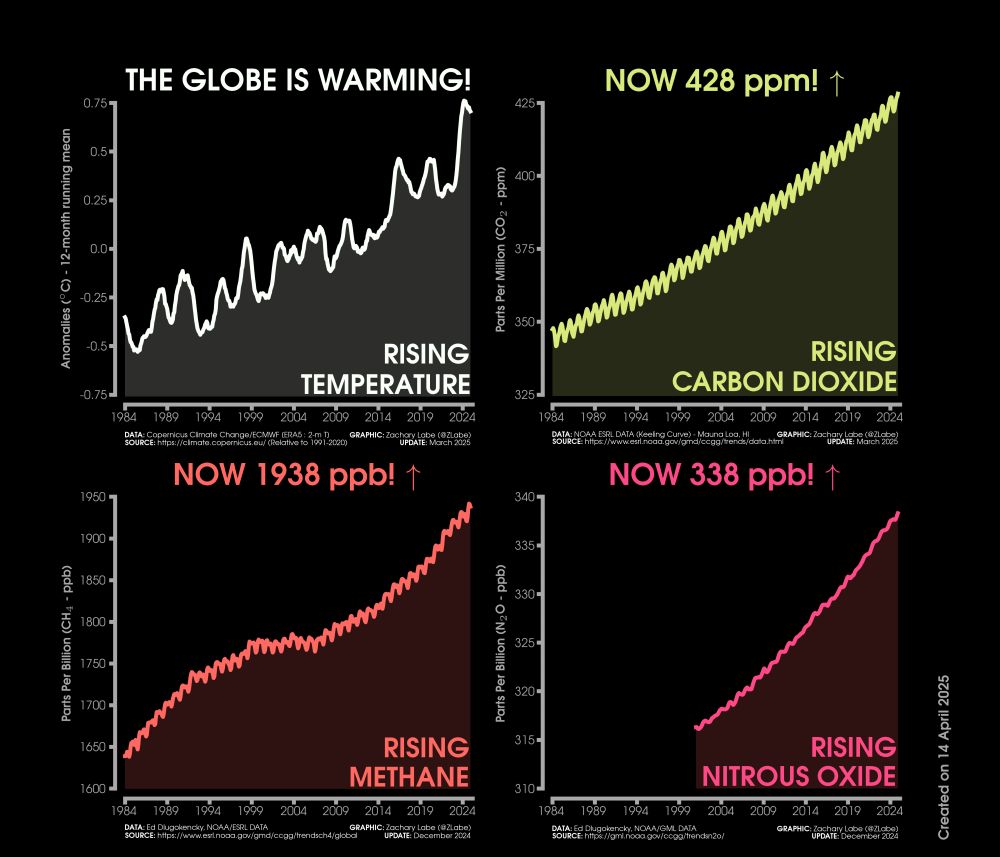
My climate change dashboard is updated for this month...
Higher resolution graphic available at zacklabe.com/climate-chan... 🧪⚒️
Higher resolution graphic available at zacklabe.com/climate-chan... 🧪⚒️
April 17, 2025 at 3:36 AM
My climate change dashboard is updated for this month...
Higher resolution graphic available at zacklabe.com/climate-chan... 🧪⚒️
Higher resolution graphic available at zacklabe.com/climate-chan... 🧪⚒️
Reposted
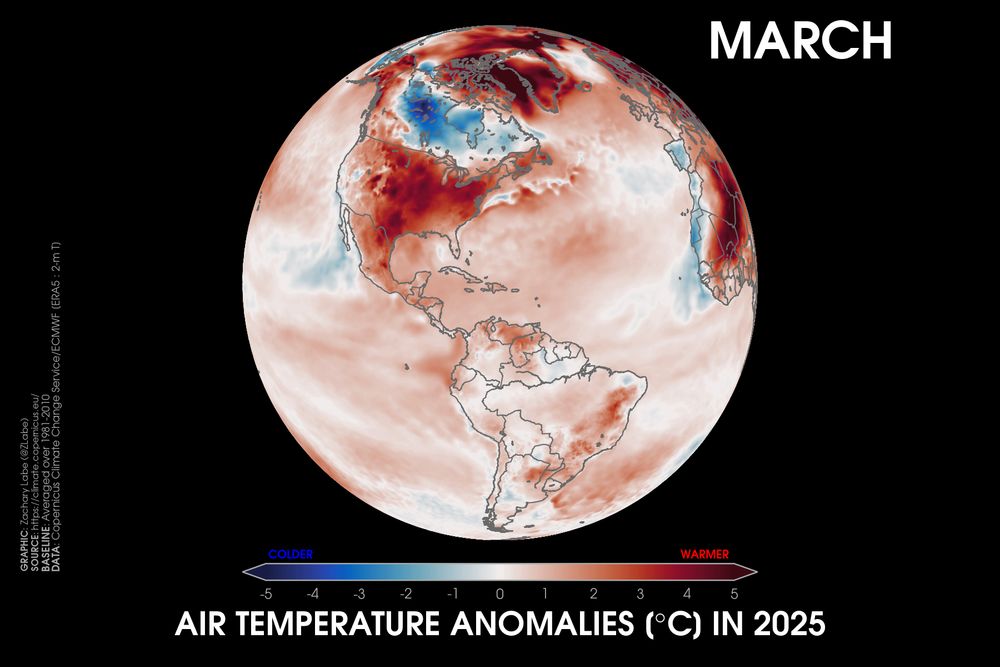
Last month was the 2nd warmest March on record globally (after last year). Some of the largest warm departures were found over Baffin Bay and eastern Europe. The USA was quite warm as well.
Summary of the month at climate.copernicus.eu/surface-air-.... Data from @copernicusecmwf.bsky.social ERA5.
Summary of the month at climate.copernicus.eu/surface-air-.... Data from @copernicusecmwf.bsky.social ERA5.

April 8, 2025 at 1:19 PM
Last month was the 2nd warmest March on record globally (after last year). Some of the largest warm departures were found over Baffin Bay and eastern Europe. The USA was quite warm as well.
Summary of the month at climate.copernicus.eu/surface-air-.... Data from @copernicusecmwf.bsky.social ERA5.
Summary of the month at climate.copernicus.eu/surface-air-.... Data from @copernicusecmwf.bsky.social ERA5.
Reposted
Less sea ice compared to average could be found around almost the entire #Arctic sea ice edge during March 2025, which contributed to its record low total ice extent.
+ Data: nsidc.org/data/g02202/...
+ Concentration = fraction of sea ice in a location
+ Data: nsidc.org/data/g02202/...
+ Concentration = fraction of sea ice in a location

April 4, 2025 at 11:59 AM
Less sea ice compared to average could be found around almost the entire #Arctic sea ice edge during March 2025, which contributed to its record low total ice extent.
+ Data: nsidc.org/data/g02202/...
+ Concentration = fraction of sea ice in a location
+ Data: nsidc.org/data/g02202/...
+ Concentration = fraction of sea ice in a location
Reposted

I'm predicting that the Mauna Loa CO2 average for March, 2025 will be 428.15 ± 0.01 ppm, a jump of 2.77 ppm from March, 2024.
Stay tuned.
Stay tuned.
April 1, 2025 at 9:15 PM
I'm predicting that the Mauna Loa CO2 average for March, 2025 will be 428.15 ± 0.01 ppm, a jump of 2.77 ppm from March, 2024.
Stay tuned.
Stay tuned.
Reposted
The global mean surface air temperature anomaly (departure from average) so far this year now placed in historical context.
Data from NOAAGlobalTemp v6.0.0 averaged over January to February.
Data from NOAAGlobalTemp v6.0.0 averaged over January to February.

March 29, 2025 at 2:02 PM
The global mean surface air temperature anomaly (departure from average) so far this year now placed in historical context.
Data from NOAAGlobalTemp v6.0.0 averaged over January to February.
Data from NOAAGlobalTemp v6.0.0 averaged over January to February.
Reposted
Looking at temperature departures over the last month (left), 3 months (center), and 12 months (right) around the world.
Now is definitely not the time to stop researching and talking about "climate"
Data for the maps available at: doi.org/10.24381/cds...
Now is definitely not the time to stop researching and talking about "climate"
Data for the maps available at: doi.org/10.24381/cds...

March 28, 2025 at 12:04 AM
Looking at temperature departures over the last month (left), 3 months (center), and 12 months (right) around the world.
Now is definitely not the time to stop researching and talking about "climate"
Data for the maps available at: doi.org/10.24381/cds...
Now is definitely not the time to stop researching and talking about "climate"
Data for the maps available at: doi.org/10.24381/cds...
Reposted
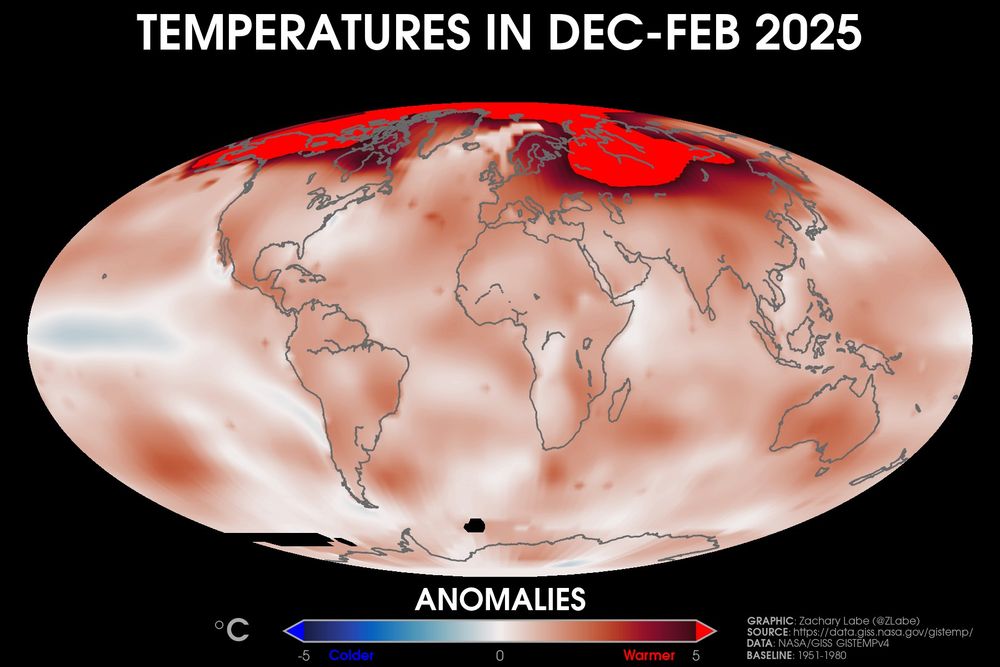
Now looking at a spatial view of temperature anomalies during the December to February 2025 period again highlights the relative Arctic warmth and lack of cold departures to be found anywhere outside of the central Pacific.
Data information at (NASA/GISS GISTEMPv4): data.giss.nasa.gov/gistemp/faq/
Data information at (NASA/GISS GISTEMPv4): data.giss.nasa.gov/gistemp/faq/
March 24, 2025 at 12:39 PM
Now looking at a spatial view of temperature anomalies during the December to February 2025 period again highlights the relative Arctic warmth and lack of cold departures to be found anywhere outside of the central Pacific.
Data information at (NASA/GISS GISTEMPv4): data.giss.nasa.gov/gistemp/faq/
Data information at (NASA/GISS GISTEMPv4): data.giss.nasa.gov/gistemp/faq/
Reposted
Last month was the warmest February on record across the #Arctic Circle...
Dataset from @noaa.gov: www.ncei.noaa.gov/products/lan...
Dataset from @noaa.gov: www.ncei.noaa.gov/products/lan...
March 22, 2025 at 2:01 PM
Last month was the warmest February on record across the #Arctic Circle...
Dataset from @noaa.gov: www.ncei.noaa.gov/products/lan...
Dataset from @noaa.gov: www.ncei.noaa.gov/products/lan...
Reposted

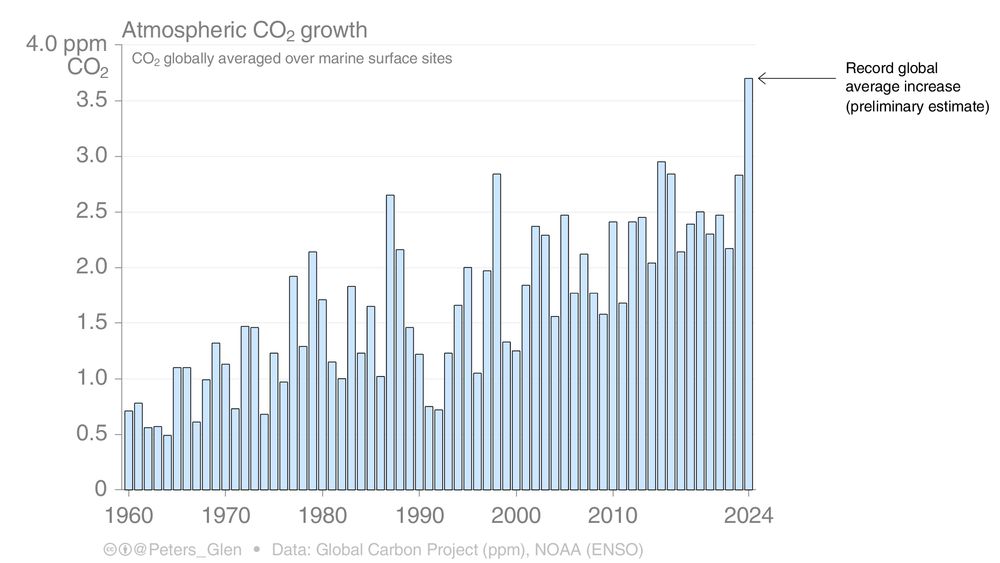
Preliminary data suggests that the global average increase in atmospheric CO2 concentration in 2024 will be a record.
Not just a little record, but 25% higher than the previous record.
(This is the global average, as opposed to Moana Loa)
gml.noaa.gov/ccgg/trends/...
1/
Not just a little record, but 25% higher than the previous record.
(This is the global average, as opposed to Moana Loa)
gml.noaa.gov/ccgg/trends/...
1/
March 19, 2025 at 8:33 AM
Preliminary data suggests that the global average increase in atmospheric CO2 concentration in 2024 will be a record.
Not just a little record, but 25% higher than the previous record.
(This is the global average, as opposed to Moana Loa)
gml.noaa.gov/ccgg/trends/...
1/
Not just a little record, but 25% higher than the previous record.
(This is the global average, as opposed to Moana Loa)
gml.noaa.gov/ccgg/trends/...
1/
Reposted
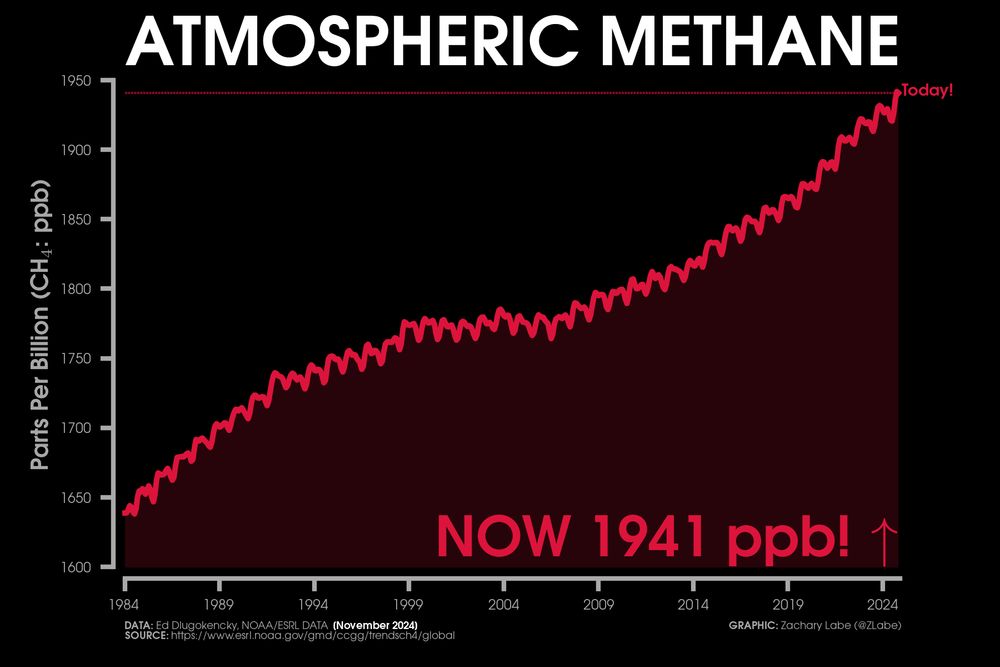
Methane (CH₄) is a potent greenhouse gas. Here are the latest monthly observations... 🧪⚒️
November 2024 - 1940.75 ppb
November 2023 - 1931.75 ppb
+ Data: gml.noaa.gov/ccgg/trends_...
+ More info on trends: www.pnas.org/doi/abs/10.1...
November 2024 - 1940.75 ppb
November 2023 - 1931.75 ppb
+ Data: gml.noaa.gov/ccgg/trends_...
+ More info on trends: www.pnas.org/doi/abs/10.1...
March 16, 2025 at 12:34 AM
Methane (CH₄) is a potent greenhouse gas. Here are the latest monthly observations... 🧪⚒️
November 2024 - 1940.75 ppb
November 2023 - 1931.75 ppb
+ Data: gml.noaa.gov/ccgg/trends_...
+ More info on trends: www.pnas.org/doi/abs/10.1...
November 2024 - 1940.75 ppb
November 2023 - 1931.75 ppb
+ Data: gml.noaa.gov/ccgg/trends_...
+ More info on trends: www.pnas.org/doi/abs/10.1...
Reposted
#Arctic climate rankings are now in for February 2025: zacklabe.com/archive-2025/. This was a historic month for the region with record warm conditions and record low sea ice relative to any prior February.
#DataViz #SciComm #OpenData #Openscience
#DataViz #SciComm #OpenData #Openscience

Data Ranking Archive – 2025
December 2025 November 2025 October 2025 September 2025 August 2025 July 2025 June 2025 May 2025 April 2025 March 2025 February 2025 January 2025 Other climate year statistics: Data Archive –…
zacklabe.com
March 15, 2025 at 1:05 AM
#Arctic climate rankings are now in for February 2025: zacklabe.com/archive-2025/. This was a historic month for the region with record warm conditions and record low sea ice relative to any prior February.
#DataViz #SciComm #OpenData #Openscience
#DataViz #SciComm #OpenData #Openscience
Reposted
I just updated my #Arctic sea-ice thickness and volume graphics for February 2025 using PIOMAS data: zacklabe.com/arctic-sea-i...
This month was the 2nd lowest February volume on record.
#SciComm #DataViz #OpenScience #OpenData
This month was the 2nd lowest February volume on record.
#SciComm #DataViz #OpenScience #OpenData

Arctic: Sea-Ice Thickness/Volume
My visualizations: Arctic Climate Seasonality and Variability Arctic Sea Ice Extent and Concentration Arctic Sea Ice Volume and Thickness Arctic Temperatures Antarctic Sea Ice Extent and Concentrat…
zacklabe.com
March 14, 2025 at 1:10 AM
I just updated my #Arctic sea-ice thickness and volume graphics for February 2025 using PIOMAS data: zacklabe.com/arctic-sea-i...
This month was the 2nd lowest February volume on record.
#SciComm #DataViz #OpenScience #OpenData
This month was the 2nd lowest February volume on record.
#SciComm #DataViz #OpenScience #OpenData