


Rees Cat Ophuls
@reescatophuls.bsky.social
Analytical Graphics for Climate Change and Planetary Boundaries. Some graphics risk being impenetrable ¯\_(ツ)_/¯
Fan of Williams' Rees, Catton, Ophuls
https://ParisAgreementTemperatureIndex.com/climate-graphics
Fan of Williams' Rees, Catton, Ophuls
https://ParisAgreementTemperatureIndex.com/climate-graphics
Sure. The data is freely available and is referenced from my website. I added a new version of the graphic, which includes the data sources. See bottom of page: parisagreementtemperatureindex.com/co2-global-w...
November 20, 2025 at 2:51 PM
Sure. The data is freely available and is referenced from my website. I added a new version of the graphic, which includes the data sources. See bottom of page: parisagreementtemperatureindex.com/co2-global-w...
Sounds like fun. I could combine these subgraphs weighted by land area. I might try a few combinations to get "globe minus el nino region", e.g. including the Atlantic and Indian ocean, but excluding a region of the Pacific.
November 17, 2025 at 5:59 PM
Sounds like fun. I could combine these subgraphs weighted by land area. I might try a few combinations to get "globe minus el nino region", e.g. including the Atlantic and Indian ocean, but excluding a region of the Pacific.
As per Gavin Schmidt, Director of NASA GISS: 2025 looks set to be between 2023/2024 temperature anomalies ... another data point to suggest that my graphic will stay unchanged, with the colour for 2025 remaining the same as 2023/2024.
bsky.app/profile/clim...
bsky.app/profile/clim...

Now that the Sept and Oct data are (belatedly) in, it looks like 2025 will be the second warmest year in the record (~80% probability). The last three years are in a class of their own.

November 15, 2025 at 6:30 PM
As per Gavin Schmidt, Director of NASA GISS: 2025 looks set to be between 2023/2024 temperature anomalies ... another data point to suggest that my graphic will stay unchanged, with the colour for 2025 remaining the same as 2023/2024.
bsky.app/profile/clim...
bsky.app/profile/clim...
However you like. My handle is in the bottom right.
If you want a slightly revised version let me know: different labels, plain, without provisional 2025 colour.
My website page has the sanity checks: parisagreementtemperatureindex.com/co2-global-w...
I appreciate your work.
If you want a slightly revised version let me know: different labels, plain, without provisional 2025 colour.
My website page has the sanity checks: parisagreementtemperatureindex.com/co2-global-w...
I appreciate your work.
November 13, 2025 at 7:10 AM
However you like. My handle is in the bottom right.
If you want a slightly revised version let me know: different labels, plain, without provisional 2025 colour.
My website page has the sanity checks: parisagreementtemperatureindex.com/co2-global-w...
I appreciate your work.
If you want a slightly revised version let me know: different labels, plain, without provisional 2025 colour.
My website page has the sanity checks: parisagreementtemperatureindex.com/co2-global-w...
I appreciate your work.
I should have added that the vertical colour bar for the year 2025 is "pending", although at this level of granularity, the data we already have for 2025, and the protections for the end of the year, the colour is likely to stay unchanged.
November 12, 2025 at 10:38 PM
I should have added that the vertical colour bar for the year 2025 is "pending", although at this level of granularity, the data we already have for 2025, and the protections for the end of the year, the colour is likely to stay unchanged.
bsky.app/profile/clim...
Eliot Jacobson has called the 3-year-running average.
I seem to be running a tiny bit ahead/warmer (4 days / 0.001C) over the 3 years. That's close enough for me. I'm not going to stress over that difference.
Eliot Jacobson has called the 3-year-running average.
I seem to be running a tiny bit ahead/warmer (4 days / 0.001C) over the 3 years. That's close enough for me. I'm not going to stress over that difference.

Breaking News!
Code UFB!!!
The three-year running mean for the global surface temperature anomaly now exceeds 1.50°C over the pre-industrial baseline, as of November 8, 2025.
Are you there, COP 30? It's me, the Paris Agreement.
Code UFB!!!
The three-year running mean for the global surface temperature anomaly now exceeds 1.50°C over the pre-industrial baseline, as of November 8, 2025.
Are you there, COP 30? It's me, the Paris Agreement.

November 10, 2025 at 8:53 PM
bsky.app/profile/clim...
Eliot Jacobson has called the 3-year-running average.
I seem to be running a tiny bit ahead/warmer (4 days / 0.001C) over the 3 years. That's close enough for me. I'm not going to stress over that difference.
Eliot Jacobson has called the 3-year-running average.
I seem to be running a tiny bit ahead/warmer (4 days / 0.001C) over the 3 years. That's close enough for me. I'm not going to stress over that difference.
Note that 2025 is expected to average under 1.5C (around 1.48C), and at the same time the 3 year average will be over 1.5C. ERA5 data.
2023: 1.48
2024: 1.60
2025: 1.48 ?
The graph has a somewhat weird metric "longest running average, for a give date, which equals 1.5C"
I found it interesting.
2023: 1.48
2024: 1.60
2025: 1.48 ?
The graph has a somewhat weird metric "longest running average, for a give date, which equals 1.5C"
I found it interesting.
November 7, 2025 at 8:08 AM
Note that 2025 is expected to average under 1.5C (around 1.48C), and at the same time the 3 year average will be over 1.5C. ERA5 data.
2023: 1.48
2024: 1.60
2025: 1.48 ?
The graph has a somewhat weird metric "longest running average, for a give date, which equals 1.5C"
I found it interesting.
2023: 1.48
2024: 1.60
2025: 1.48 ?
The graph has a somewhat weird metric "longest running average, for a give date, which equals 1.5C"
I found it interesting.
@timlagor.bsky.social
Regarding your question "How often does a year have a higher average than the 10-year average centered on it?"
This is the graphic I mentioned, which is in that area. It does take a bit of working out. Probably worth starting with my first post from today, and then this one.
Regarding your question "How often does a year have a higher average than the 10-year average centered on it?"
This is the graphic I mentioned, which is in that area. It does take a bit of working out. Probably worth starting with my first post from today, and then this one.
November 6, 2025 at 10:25 AM
@timlagor.bsky.social
Regarding your question "How often does a year have a higher average than the 10-year average centered on it?"
This is the graphic I mentioned, which is in that area. It does take a bit of working out. Probably worth starting with my first post from today, and then this one.
Regarding your question "How often does a year have a higher average than the 10-year average centered on it?"
This is the graphic I mentioned, which is in that area. It does take a bit of working out. Probably worth starting with my first post from today, and then this one.
My previous post begs for this one
It asks the question: Has waiting for a 20 year average made much difference in the past?
This new graphic takes the previous one (longest running average for a given date), and for each point on the graph, draws a line back to the “centred-moving-average” date
It asks the question: Has waiting for a 20 year average made much difference in the past?
This new graphic takes the previous one (longest running average for a given date), and for each point on the graph, draws a line back to the “centred-moving-average” date

November 6, 2025 at 9:46 AM
My previous post begs for this one
It asks the question: Has waiting for a 20 year average made much difference in the past?
This new graphic takes the previous one (longest running average for a given date), and for each point on the graph, draws a line back to the “centred-moving-average” date
It asks the question: Has waiting for a 20 year average made much difference in the past?
This new graphic takes the previous one (longest running average for a given date), and for each point on the graph, draws a line back to the “centred-moving-average” date
2023: 1.48 (climate.copernicus.eu/global-clima...)
2024: 1.60 (climate.copernicus.eu/global-clima...)
2025: climate casino: 1.48C
3 year average: 1.52C (if climate casino correct).
2024: 1.60 (climate.copernicus.eu/global-clima...)
2025: climate casino: 1.48C
3 year average: 1.52C (if climate casino correct).
October 26, 2025 at 5:58 PM
2023: 1.48 (climate.copernicus.eu/global-clima...)
2024: 1.60 (climate.copernicus.eu/global-clima...)
2025: climate casino: 1.48C
3 year average: 1.52C (if climate casino correct).
2024: 1.60 (climate.copernicus.eu/global-clima...)
2025: climate casino: 1.48C
3 year average: 1.52C (if climate casino correct).
October 26, 2025 at 5:54 PM
2023: 1.48 (climate.copernicus.eu/global-clima...)
2024: 1.60 (climate.copernicus.eu/global-clima...)
2025: climate casino: 1.48C
3 year average: 1.52C (if climate casino correct).
2024: 1.60 (climate.copernicus.eu/global-clima...)
2025: climate casino: 1.48C
3 year average: 1.52C (if climate casino correct).
I have a graphic ready, which is in this area. Just waiting for Copernicus ERA5 data 3-year-running average to cross 1.5C. should be well within the next two months. It is over 1.495C at the moment
October 26, 2025 at 5:30 PM
I have a graphic ready, which is in this area. Just waiting for Copernicus ERA5 data 3-year-running average to cross 1.5C. should be well within the next two months. It is over 1.495C at the moment
bsky.app/profile/haus...
A more visual way to show that Berkeley Earth data on course to show the three year average for 2023, 2024, 2025 will be over 1.5C. The 36 month running average is already over 1.5C for this dataset.
A more visual way to show that Berkeley Earth data on course to show the three year average for 2023, 2024, 2025 will be over 1.5C. The 36 month running average is already over 1.5C for this dataset.

The year as a whole now seems to likely end up as the third warmest on record in the Berkeley Earth dataset, after 2024 and 2023, though there is a chance it could still end up as the second warmest.

October 25, 2025 at 9:30 AM
bsky.app/profile/haus...
A more visual way to show that Berkeley Earth data on course to show the three year average for 2023, 2024, 2025 will be over 1.5C. The 36 month running average is already over 1.5C for this dataset.
A more visual way to show that Berkeley Earth data on course to show the three year average for 2023, 2024, 2025 will be over 1.5C. The 36 month running average is already over 1.5C for this dataset.
Reposted by Rees Cat Ophuls
Just noticed that the Berkeley Earth data already has the 3-year average over 1.5C

October 22, 2025 at 6:14 PM
Just noticed that the Berkeley Earth data already has the 3-year average over 1.5C
Just noticed that the Berkeley Earth data already has the 3-year average over 1.5C
October 22, 2025 at 6:14 PM
Just noticed that the Berkeley Earth data already has the 3-year average over 1.5C
The 3-year running average will v likely cross 1.5C in Nov/Dec this year. (ERA5 Data)
October 13, 2025 at 2:07 PM
The 3-year running average will v likely cross 1.5C in Nov/Dec this year. (ERA5 Data)
Great. If I drop the rounding, then its only the leap year difference. I added the rounding to get the best match with the info that Copernicus publishes in their monthly bulletins. In particular the number of days over 2C.
Anyhow its the trend, rather than the exact numbers, that is interesting. 👍
Anyhow its the trend, rather than the exact numbers, that is interesting. 👍
October 4, 2025 at 8:17 AM
Great. If I drop the rounding, then its only the leap year difference. I added the rounding to get the best match with the info that Copernicus publishes in their monthly bulletins. In particular the number of days over 2C.
Anyhow its the trend, rather than the exact numbers, that is interesting. 👍
Anyhow its the trend, rather than the exact numbers, that is interesting. 👍
Hi Eliot, what is your running total?
bsky.app/profile/rees...
Diagram below rounds to 2dp and uses days ">= 1.5C" after the rounding, so I can believe there might be a slight discrepancy.
bsky.app/profile/rees...
Diagram below rounds to 2dp and uses days ">= 1.5C" after the rounding, so I can believe there might be a slight discrepancy.
800 individual days have been at least 1.5C above the Pre-Industrial baseline
Summer 2025 was largely under 1.5C
> Will we pass 900 days in 2026?
> Will we pass 1000 days by 2027?
> Will the Loess 30-yr trend pass 1.5C before 2028?
Data: Copernicus ERA5 - Global Mean Surface Temperature Anomaly
Summer 2025 was largely under 1.5C
> Will we pass 900 days in 2026?
> Will we pass 1000 days by 2027?
> Will the Loess 30-yr trend pass 1.5C before 2028?
Data: Copernicus ERA5 - Global Mean Surface Temperature Anomaly
October 3, 2025 at 9:18 PM
Hi Eliot, what is your running total?
bsky.app/profile/rees...
Diagram below rounds to 2dp and uses days ">= 1.5C" after the rounding, so I can believe there might be a slight discrepancy.
bsky.app/profile/rees...
Diagram below rounds to 2dp and uses days ">= 1.5C" after the rounding, so I can believe there might be a slight discrepancy.
Nice ... I wonder if the data existing to do an "anomaly" version of this.
September 30, 2025 at 9:15 AM
Nice ... I wonder if the data existing to do an "anomaly" version of this.

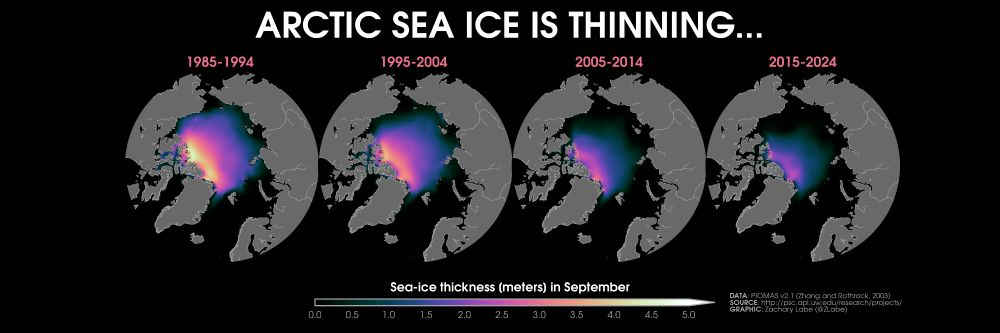
September #Arctic sea ice thickness by decade... ❄️🥼
Data information: climatedataguide.ucar.edu/climate-data...
Data information: climatedataguide.ucar.edu/climate-data...
September 21, 2025 at 7:47 PM