


Mike Barry
@planamikebarry.bsky.social
Sustainable business transformer. Ex M&S Director of Sustainable Business (Plan A - because there is no Plan B for the one Planet we have). www.mikebarryeco.earth. https://www.linkedin.com/in/mike-barry-9b6ab722/
The storm came .. and went ☔️🌈


September 1, 2025 at 8:30 PM
The storm came .. and went ☔️🌈
Reposted by Mike Barry

🙌 Great to see DEFRA launching the Good Food Cycle plan to transform Britain's food system.
As our Executive Director Anna Taylor points out - the real challenge now lies in delivering it!
Read more: ➡️ bit.ly/3TFBJkc
#goodfoodcycle @ffc-commission.bsky.social @biteback2030.bsky.social
As our Executive Director Anna Taylor points out - the real challenge now lies in delivering it!
Read more: ➡️ bit.ly/3TFBJkc
#goodfoodcycle @ffc-commission.bsky.social @biteback2030.bsky.social

July 15, 2025 at 12:01 PM
🙌 Great to see DEFRA launching the Good Food Cycle plan to transform Britain's food system.
As our Executive Director Anna Taylor points out - the real challenge now lies in delivering it!
Read more: ➡️ bit.ly/3TFBJkc
#goodfoodcycle @ffc-commission.bsky.social @biteback2030.bsky.social
As our Executive Director Anna Taylor points out - the real challenge now lies in delivering it!
Read more: ➡️ bit.ly/3TFBJkc
#goodfoodcycle @ffc-commission.bsky.social @biteback2030.bsky.social
Reposted by Mike Barry
Spain records highs of 46C and France under alert as Europe swelters in heatwave
- Extreme heat ‘the new normal’, says UN chief, as authorities across the continent issue health warnings
#climatecrisis
www.theguardian.com/environment/...
- Extreme heat ‘the new normal’, says UN chief, as authorities across the continent issue health warnings
#climatecrisis
www.theguardian.com/environment/...
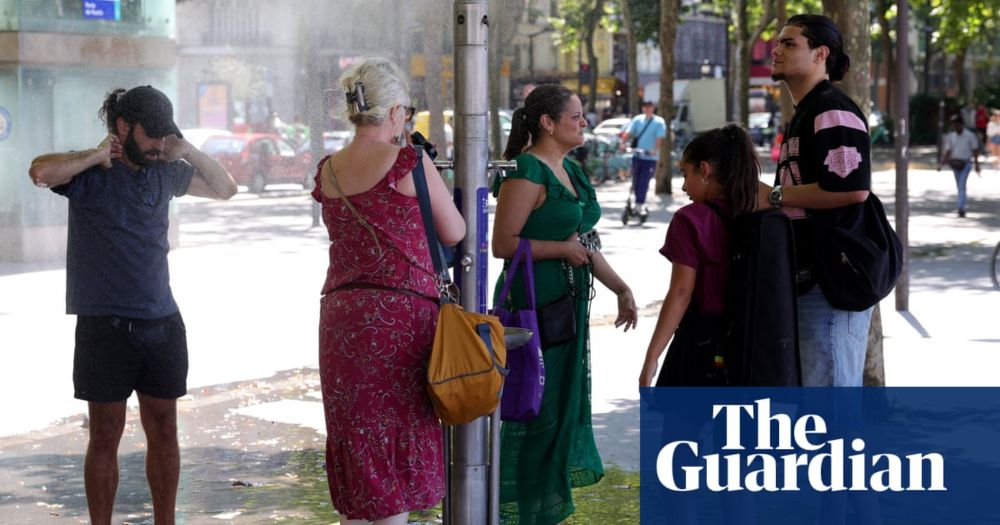
Spain records highs of 46C and France under alert as Europe swelters in heatwave
Extreme heat ‘the new normal’, says UN chief, as authorities across the continent issue health warnings
www.theguardian.com
July 1, 2025 at 8:47 AM
Spain records highs of 46C and France under alert as Europe swelters in heatwave
- Extreme heat ‘the new normal’, says UN chief, as authorities across the continent issue health warnings
#climatecrisis
www.theguardian.com/environment/...
- Extreme heat ‘the new normal’, says UN chief, as authorities across the continent issue health warnings
#climatecrisis
www.theguardian.com/environment/...
Reposted by Mike Barry

Heatwave in the UK peaking on Monday and Tuesday.
1) Drink water. Stay cool. Check on vulnerable people.
2) You can monitor temperatures hour by hour across the country, and see how much warmer than normal it gets.
istheukhotrightnow.com
1) Drink water. Stay cool. Check on vulnerable people.
2) You can monitor temperatures hour by hour across the country, and see how much warmer than normal it gets.
istheukhotrightnow.com

Is the UK hot right now?
See live UK temperatures vs average, with detailed stats, daily trends, and historic comparisons from official UK sites.
istheukhotrightnow.com
June 29, 2025 at 5:46 PM
Heatwave in the UK peaking on Monday and Tuesday.
1) Drink water. Stay cool. Check on vulnerable people.
2) You can monitor temperatures hour by hour across the country, and see how much warmer than normal it gets.
istheukhotrightnow.com
1) Drink water. Stay cool. Check on vulnerable people.
2) You can monitor temperatures hour by hour across the country, and see how much warmer than normal it gets.
istheukhotrightnow.com
Reposted by Mike Barry
🚨 As London Climate Week spotlights urgent action across the food system, a new paper from @planeatryalliance.bsky.social shows:
Shifting diets can prevent up to 24% of unnecessary deaths globally while delivering 'gigatonne scale' emissions reductions.
🔗 tinyurl.com/mryzztzh
#LondonClimateWeek
Shifting diets can prevent up to 24% of unnecessary deaths globally while delivering 'gigatonne scale' emissions reductions.
🔗 tinyurl.com/mryzztzh
#LondonClimateWeek

June 26, 2025 at 9:37 AM
🚨 As London Climate Week spotlights urgent action across the food system, a new paper from @planeatryalliance.bsky.social shows:
Shifting diets can prevent up to 24% of unnecessary deaths globally while delivering 'gigatonne scale' emissions reductions.
🔗 tinyurl.com/mryzztzh
#LondonClimateWeek
Shifting diets can prevent up to 24% of unnecessary deaths globally while delivering 'gigatonne scale' emissions reductions.
🔗 tinyurl.com/mryzztzh
#LondonClimateWeek
www.planeatryalliance.com/whitepaper
Delighted to launch our White Paper on Healthy and Sustainable Diets l
We interviewed 10 global food leaders to identity 15 barriers to shifting diets and ten practical solutions to overcome them
Delighted to launch our White Paper on Healthy and Sustainable Diets l
We interviewed 10 global food leaders to identity 15 barriers to shifting diets and ten practical solutions to overcome them
White Paper — Planeatry Alliance
www.planeatryalliance.com
June 25, 2025 at 1:39 PM
www.planeatryalliance.com/whitepaper
Delighted to launch our White Paper on Healthy and Sustainable Diets l
We interviewed 10 global food leaders to identity 15 barriers to shifting diets and ten practical solutions to overcome them
Delighted to launch our White Paper on Healthy and Sustainable Diets l
We interviewed 10 global food leaders to identity 15 barriers to shifting diets and ten practical solutions to overcome them
Reposted by Mike Barry

From policy gaps to practical levers for change, the paper reveals how businesses, policymakers, and civil society can collaborate to redesign food systems for people and planet.
Explore the full findings: www.planeatryalliance.com/whitepaper
@alimorpeth.bsky.social @planamikebarry.bsky.social
Explore the full findings: www.planeatryalliance.com/whitepaper
@alimorpeth.bsky.social @planamikebarry.bsky.social
White Paper — Planeatry Alliance
www.planeatryalliance.com
June 25, 2025 at 11:44 AM
From policy gaps to practical levers for change, the paper reveals how businesses, policymakers, and civil society can collaborate to redesign food systems for people and planet.
Explore the full findings: www.planeatryalliance.com/whitepaper
@alimorpeth.bsky.social @planamikebarry.bsky.social
Explore the full findings: www.planeatryalliance.com/whitepaper
@alimorpeth.bsky.social @planamikebarry.bsky.social
Reposted by Mike Barry
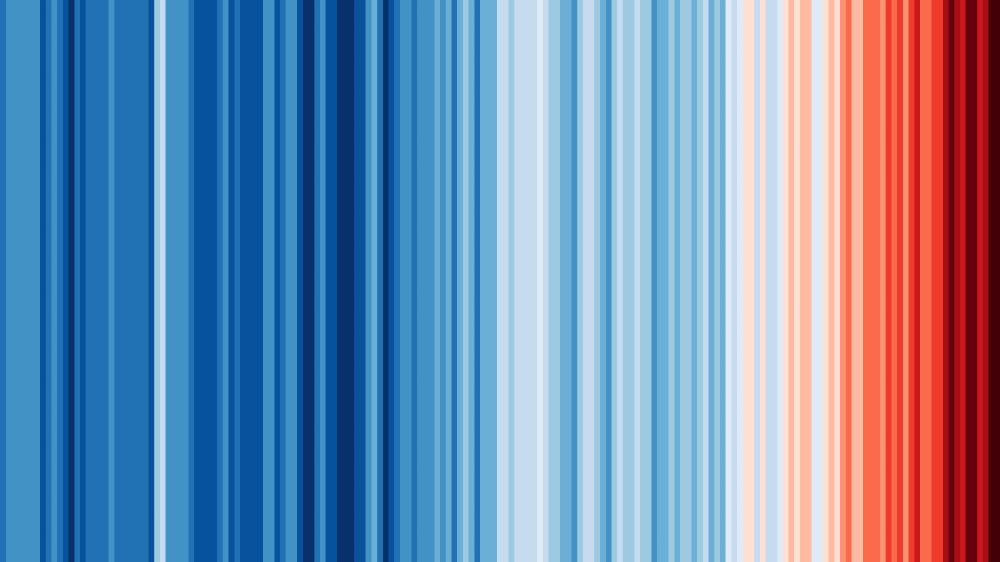
21st June: #ShowYourStripes day
1) Download your warming stripes: www.ShowYourStripes.info
2) Use the graphics to start conversations about climate change risks, how you are already experiencing the consequences and what you are doing about it
3) Encourage others to do the same
1) Download your warming stripes: www.ShowYourStripes.info
2) Use the graphics to start conversations about climate change risks, how you are already experiencing the consequences and what you are doing about it
3) Encourage others to do the same
June 18, 2025 at 8:41 PM
21st June: #ShowYourStripes day
1) Download your warming stripes: www.ShowYourStripes.info
2) Use the graphics to start conversations about climate change risks, how you are already experiencing the consequences and what you are doing about it
3) Encourage others to do the same
1) Download your warming stripes: www.ShowYourStripes.info
2) Use the graphics to start conversations about climate change risks, how you are already experiencing the consequences and what you are doing about it
3) Encourage others to do the same
Reposted by Mike Barry
Wherever you live in the world, your climate is getting warmer.
21st June is #ShowYourStripes day when we encourage everyone to use the warming stripes graphics to talk about climate change and how we are all already experiencing the consequences.
Download your stripes: www.ShowYourStripes.info
21st June is #ShowYourStripes day when we encourage everyone to use the warming stripes graphics to talk about climate change and how we are all already experiencing the consequences.
Download your stripes: www.ShowYourStripes.info
June 4, 2025 at 1:46 PM
Wherever you live in the world, your climate is getting warmer.
21st June is #ShowYourStripes day when we encourage everyone to use the warming stripes graphics to talk about climate change and how we are all already experiencing the consequences.
Download your stripes: www.ShowYourStripes.info
21st June is #ShowYourStripes day when we encourage everyone to use the warming stripes graphics to talk about climate change and how we are all already experiencing the consequences.
Download your stripes: www.ShowYourStripes.info
Reposted by Mike Barry
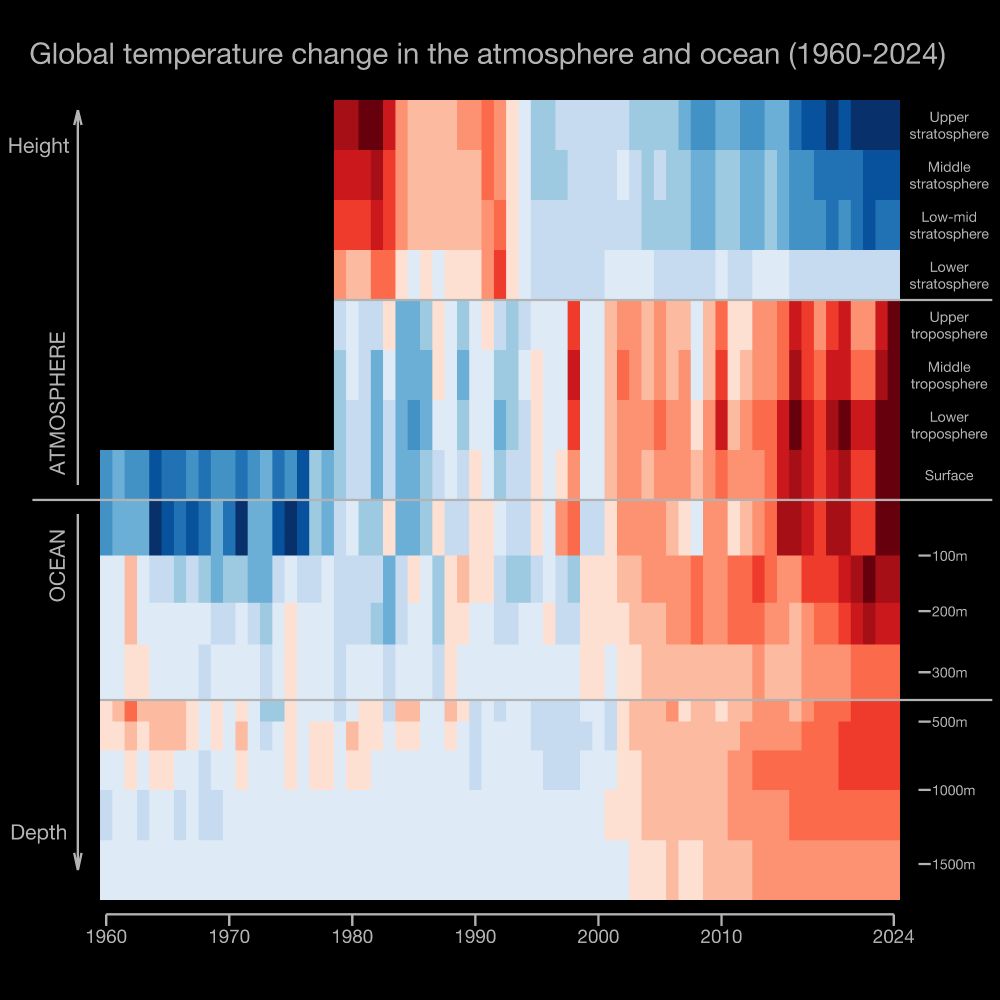
The warming stripes have been updated to show the atmosphere and the ocean!
www.fastcompany.com/91339154/thi...
Paper: journals.ametsoc.org/view/journal...
www.fastcompany.com/91339154/thi...
Paper: journals.ametsoc.org/view/journal...
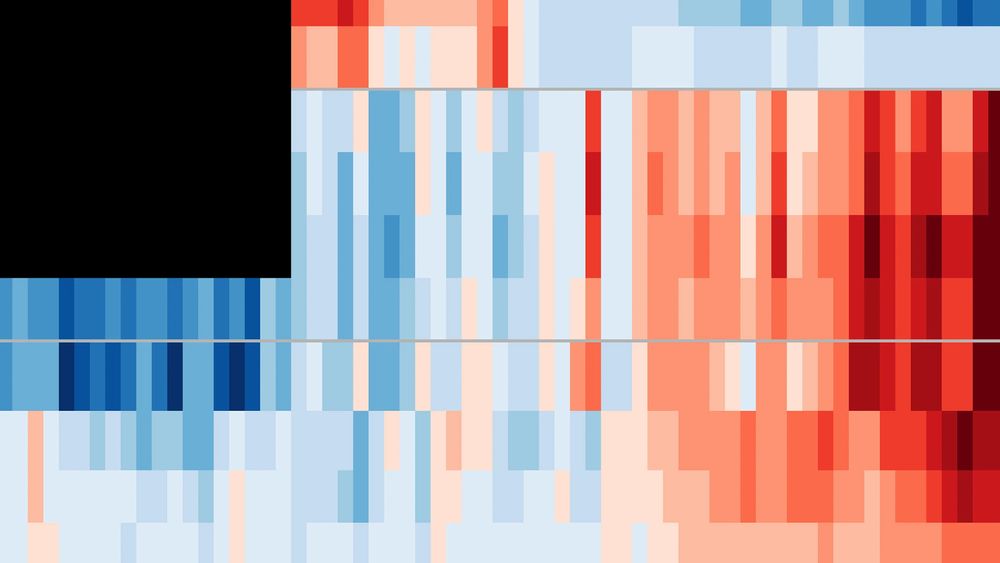
This viral climate graphic just got a troubling update
The updated 'climate stripes' graph now visualizes the impact of climate change on oceans and the atmosphere. Some parts may surprise you.
www.fastcompany.com
May 27, 2025 at 1:28 PM
The warming stripes have been updated to show the atmosphere and the ocean!
www.fastcompany.com/91339154/thi...
Paper: journals.ametsoc.org/view/journal...
www.fastcompany.com/91339154/thi...
Paper: journals.ametsoc.org/view/journal...
Reposted by Mike Barry

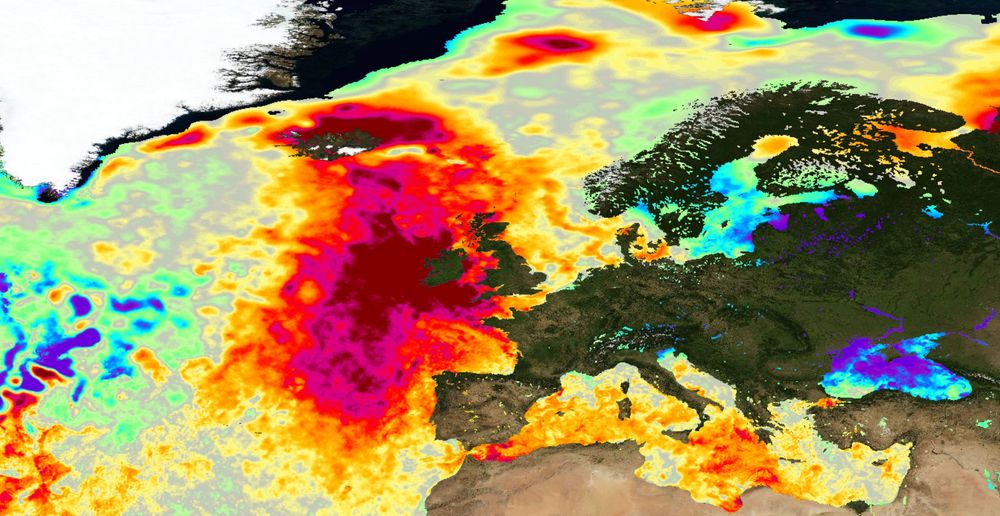
This is phenomenal.
Sea surface temperatures are >5C above average to the west of the UK and around Iceland. It's the strongest area of anomalous warmth on the planet at the moment.
It's the warmest in recorded history for northwest Europe.
Sea surface temperatures are >5C above average to the west of the UK and around Iceland. It's the strongest area of anomalous warmth on the planet at the moment.
It's the warmest in recorded history for northwest Europe.
May 25, 2025 at 10:13 AM
This is phenomenal.
Sea surface temperatures are >5C above average to the west of the UK and around Iceland. It's the strongest area of anomalous warmth on the planet at the moment.
It's the warmest in recorded history for northwest Europe.
Sea surface temperatures are >5C above average to the west of the UK and around Iceland. It's the strongest area of anomalous warmth on the planet at the moment.
It's the warmest in recorded history for northwest Europe.
Reposted by Mike Barry
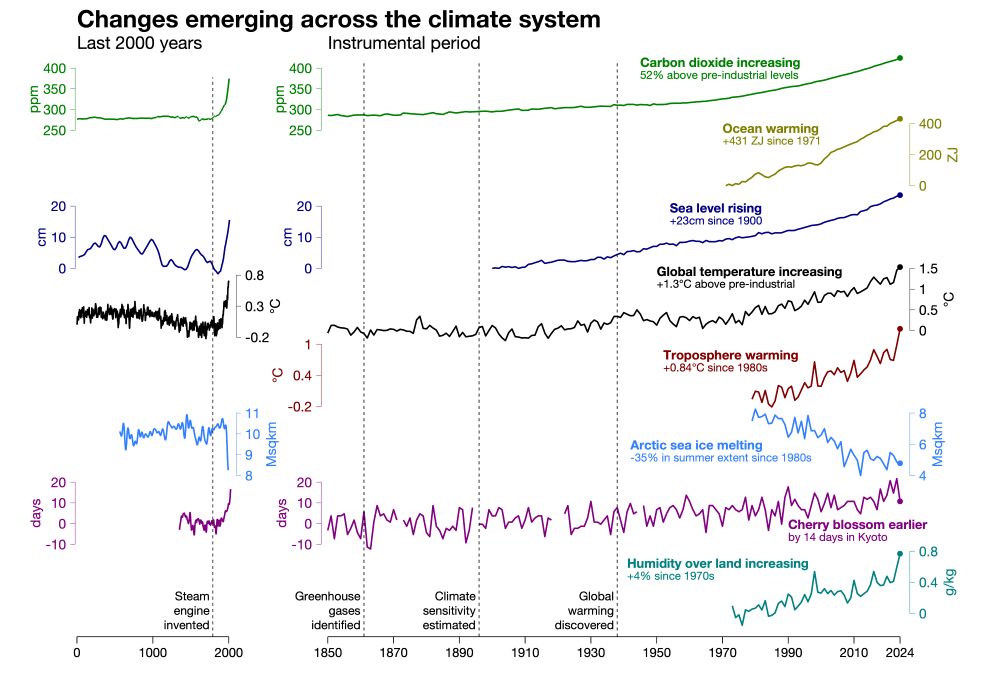
Updated Climate Visuals
(1) Warming stripes for atmosphere and ocean
(2) Climate indicators (adding land humidity for 2024)
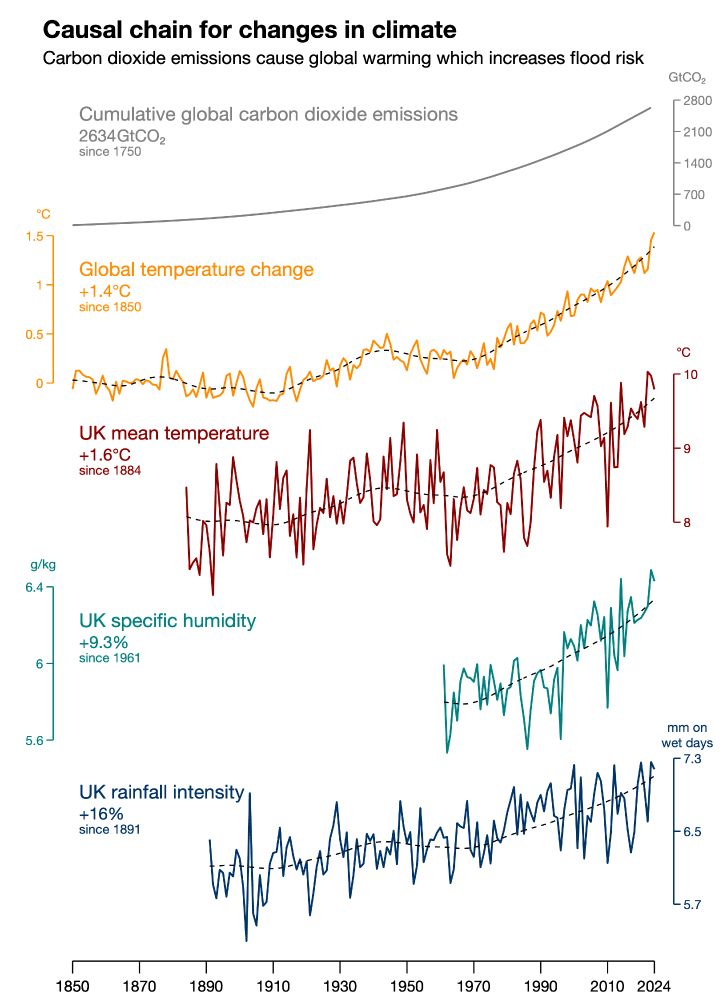
(3) UK climate indicators (adding some 2024 data)
ed-hawkins.github.io/climate-visu...
(1) Warming stripes for atmosphere and ocean
(2) Climate indicators (adding land humidity for 2024)
(3) UK climate indicators (adding some 2024 data)
ed-hawkins.github.io/climate-visu...
May 12, 2025 at 8:27 AM
Updated Climate Visuals
(1) Warming stripes for atmosphere and ocean
(2) Climate indicators (adding land humidity for 2024)
(3) UK climate indicators (adding some 2024 data)
ed-hawkins.github.io/climate-visu...
(1) Warming stripes for atmosphere and ocean
(2) Climate indicators (adding land humidity for 2024)
(3) UK climate indicators (adding some 2024 data)
ed-hawkins.github.io/climate-visu...
Reposted by Mike Barry

Bluesky is collegial and interesting, the way Twitter used to be. Bonus: most people can spell.
April 23, 2025 at 12:39 PM
Bluesky is collegial and interesting, the way Twitter used to be. Bonus: most people can spell.
Reposted by Mike Barry

Word of the day is ‘bugiard’ (17th century): one who distorts the truth beyond all recognition to fit their own agenda.
April 15, 2025 at 2:31 PM
Word of the day is ‘bugiard’ (17th century): one who distorts the truth beyond all recognition to fit their own agenda.
Reposted by Mike Barry

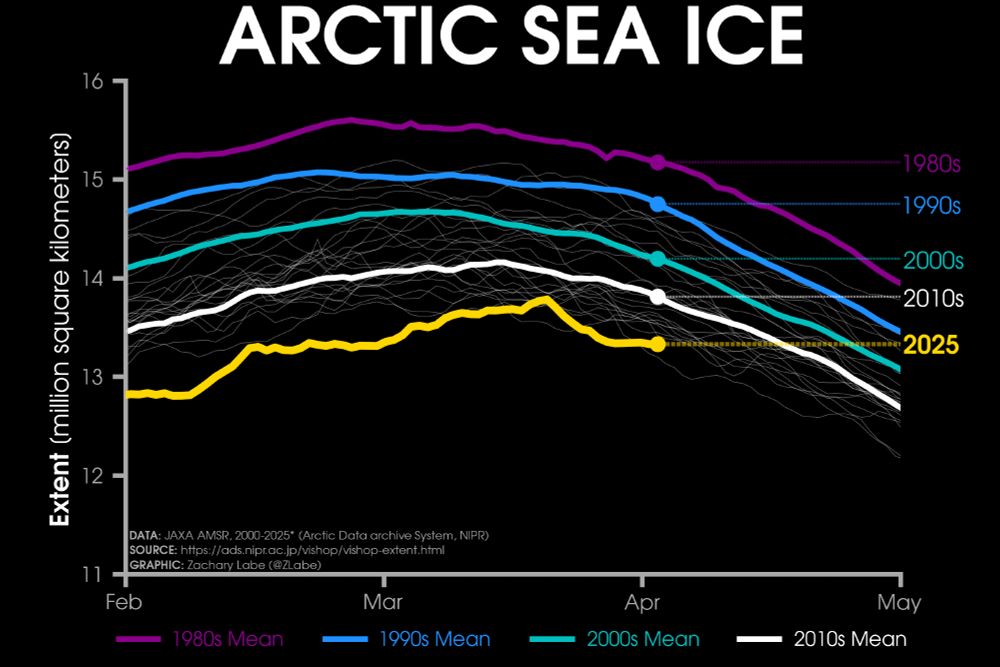
I swear it's not a graph of the stock market... 📉
+ High resolution version: zacklabe.com/arctic-sea-i...
+ Figure reproduced from doi.org/10.1038/natu...
+ Overview: climate.gov/news-feature...
+ High resolution version: zacklabe.com/arctic-sea-i...
+ Figure reproduced from doi.org/10.1038/natu...
+ Overview: climate.gov/news-feature...

April 7, 2025 at 12:40 AM
I swear it's not a graph of the stock market... 📉
+ High resolution version: zacklabe.com/arctic-sea-i...
+ Figure reproduced from doi.org/10.1038/natu...
+ Overview: climate.gov/news-feature...
+ High resolution version: zacklabe.com/arctic-sea-i...
+ Figure reproduced from doi.org/10.1038/natu...
+ Overview: climate.gov/news-feature...
Insurance sector is the true ‘canary in the capitalist coal mine’ - it knows that 3C heating breaks society and the economy that’s meant to serve it
“At 3C of global heating, climate damage cannot be insured against, covered by governments, or adapted to. That means no more mortgages or new real estate devt, no long-term investment, no financial stability. The financial sector as we know it ceases to function and capitalism ceases to be viable.”

Climate crisis on track to destroy capitalism, warns top insurer
Action urgently needed to save the conditions under which markets – and civilisation itself – can operate, says senior Allianz figure
www.theguardian.com
April 5, 2025 at 9:20 AM
Insurance sector is the true ‘canary in the capitalist coal mine’ - it knows that 3C heating breaks society and the economy that’s meant to serve it
Reposted by Mike Barry

“At 3C of global heating, climate damage cannot be insured against, covered by governments, or adapted to. That means no more mortgages or new real estate devt, no long-term investment, no financial stability. The financial sector as we know it ceases to function and capitalism ceases to be viable.”
Climate crisis on track to destroy capitalism, warns top insurer
Action urgently needed to save the conditions under which markets – and civilisation itself – can operate, says senior Allianz figure
www.theguardian.com
April 4, 2025 at 7:01 AM
“At 3C of global heating, climate damage cannot be insured against, covered by governments, or adapted to. That means no more mortgages or new real estate devt, no long-term investment, no financial stability. The financial sector as we know it ceases to function and capitalism ceases to be viable.”
Plenty of quiddlers around, looking ‘down’ not ‘up’
Word of the day is ‘quiddler’ (18th century): one who focuses on unimportant issues while avoiding the important ones, or who fiddles/plays golf while Rome burns.
April 5, 2025 at 9:18 AM
Plenty of quiddlers around, looking ‘down’ not ‘up’
Reposted by Mike Barry
Friday ice update - #Arctic sea ice extent is currently the 2nd lowest on record (JAXA data)
• about 480,000 km² below the 2010s mean
• about 870,000 km² below the 2000s mean
• about 1,420,000 km² below the 1990s mean
• about 1,840,000 km² below the 1980s mean
Plots: zacklabe.com/arctic-sea-i... 🧪
• about 480,000 km² below the 2010s mean
• about 870,000 km² below the 2000s mean
• about 1,420,000 km² below the 1990s mean
• about 1,840,000 km² below the 1980s mean
Plots: zacklabe.com/arctic-sea-i... 🧪
April 4, 2025 at 2:39 PM
Friday ice update - #Arctic sea ice extent is currently the 2nd lowest on record (JAXA data)
• about 480,000 km² below the 2010s mean
• about 870,000 km² below the 2000s mean
• about 1,420,000 km² below the 1990s mean
• about 1,840,000 km² below the 1980s mean
Plots: zacklabe.com/arctic-sea-i... 🧪
• about 480,000 km² below the 2010s mean
• about 870,000 km² below the 2000s mean
• about 1,420,000 km² below the 1990s mean
• about 1,840,000 km² below the 1980s mean
Plots: zacklabe.com/arctic-sea-i... 🧪
Reposted by Mike Barry
All definitions of the #Arctic revealed significant warmth in February 2025, but the largest anomalies were found in the northernmost areas close to the North Pole.
Graphic updated monthly at: zacklabe.com/arctic-tempe.... Data from ERA5 reanalysis.
Graphic updated monthly at: zacklabe.com/arctic-tempe.... Data from ERA5 reanalysis.

March 18, 2025 at 1:09 PM
All definitions of the #Arctic revealed significant warmth in February 2025, but the largest anomalies were found in the northernmost areas close to the North Pole.
Graphic updated monthly at: zacklabe.com/arctic-tempe.... Data from ERA5 reanalysis.
Graphic updated monthly at: zacklabe.com/arctic-tempe.... Data from ERA5 reanalysis.
Reposted by Mike Barry
Word of the day is ‘whiffling’ (17th century): fickle, inconstant, and making it up as you go along.
March 7, 2025 at 4:48 PM
Word of the day is ‘whiffling’ (17th century): fickle, inconstant, and making it up as you go along.
Reposted by Mike Barry
Last month was statistically tied for the 3rd lowest #Antarctic sea ice extent on record for the month of February
This was 860,000 km² below the 1981-2010 February average. Data from NSIDC at nsidc.org/data/seaice_... 🌊
This was 860,000 km² below the 1981-2010 February average. Data from NSIDC at nsidc.org/data/seaice_... 🌊
March 6, 2025 at 1:46 PM
Last month was statistically tied for the 3rd lowest #Antarctic sea ice extent on record for the month of February
This was 860,000 km² below the 1981-2010 February average. Data from NSIDC at nsidc.org/data/seaice_... 🌊
This was 860,000 km² below the 1981-2010 February average. Data from NSIDC at nsidc.org/data/seaice_... 🌊
Reposted by Mike Barry
Word of the Day is ‘ingordigiousness’ (18th century): extreme greed at the expense of principles.
February 26, 2025 at 7:59 AM
Word of the Day is ‘ingordigiousness’ (18th century): extreme greed at the expense of principles.
Reposted by Mike Barry

How can retailers make #Sustainability and #HealthyEating choices easier for consumers? @planamikebarry.bsky.social of @planeatryalliance.bsky.social explains why retailers need to use data and AI to support this transformation at the basket level.
Interview: climatesolutions.news/spotlight/ho...
Interview: climatesolutions.news/spotlight/ho...

How Can Retailers Lead the Charge on Health and Sustainability?
Interview with Mike Barry, The Planeatry Alliance. What are priorities in innovation, technology & policy for a better global food system?
climatesolutions.news
February 11, 2025 at 10:16 AM
How can retailers make #Sustainability and #HealthyEating choices easier for consumers? @planamikebarry.bsky.social of @planeatryalliance.bsky.social explains why retailers need to use data and AI to support this transformation at the basket level.
Interview: climatesolutions.news/spotlight/ho...
Interview: climatesolutions.news/spotlight/ho...
Reposted by Mike Barry
The extreme winter warming event continues in the northernmost portions of the #Arctic. This is related to a temporary surge of heat and moisture that was transported northward and is related to the orientation of the large-scale atmospheric circulation.
Graph from zacklabe.com/arctic-tempe...
Graph from zacklabe.com/arctic-tempe...

February 6, 2025 at 1:23 PM
The extreme winter warming event continues in the northernmost portions of the #Arctic. This is related to a temporary surge of heat and moisture that was transported northward and is related to the orientation of the large-scale atmospheric circulation.
Graph from zacklabe.com/arctic-tempe...
Graph from zacklabe.com/arctic-tempe...