


Newfymainlander
@newfymainlander.bsky.social
I love plants, animals (especially orcas) and good humans. Immune compromised mom trying to survive this messed up planet!🪴🌎🌈👩🌾

Reposted by Newfymainlander

I don’t think that we see this version of NB without NB twitter. That world is gone now, and this place is less cohesive, and less goofy, but for the few who remain and will see this I want to say thanks. I want to say thanks to those who have moved on too, but were so instrumental in fighting.
Some interesting Public Health changes happening in #NBPoli! www2.gnb.ca/content/gnb/...
Amendments to enhance independence of chief medical officer of health
The government has introduced amendments to the Public Health Act aimed at enhancing the independence of the chief medical officer of health.
www2.gnb.ca
October 22, 2025 at 9:21 PM
I don’t think that we see this version of NB without NB twitter. That world is gone now, and this place is less cohesive, and less goofy, but for the few who remain and will see this I want to say thanks. I want to say thanks to those who have moved on too, but were so instrumental in fighting.
Reposted by Newfymainlander
Hi everyone. Very time-sensitive ask here from your friend in NB. Two parts, relating to the CSA standard #Z94.4. The Canadian Aerosol Transmission Coalition has written a statement in support of the revisions to Z94.4. You or your organization are welcome to sign on in support, deadline tom. /1
August 15, 2025 at 12:40 AM
Hi everyone. Very time-sensitive ask here from your friend in NB. Two parts, relating to the CSA standard #Z94.4. The Canadian Aerosol Transmission Coalition has written a statement in support of the revisions to Z94.4. You or your organization are welcome to sign on in support, deadline tom. /1
Reposted by Newfymainlander
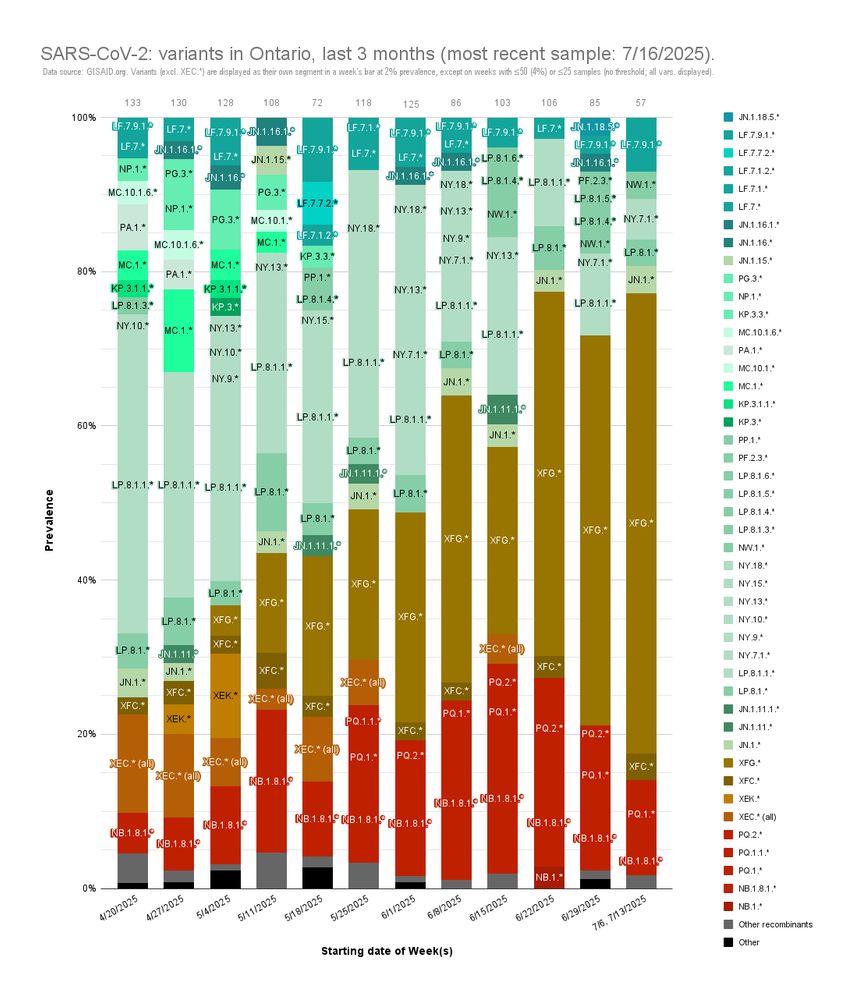
UPDATED: #Ontario #SARSCoV2 variants.
Of 57 samples from 7/6 - 7/16 (vs. 85, 6/29 - 7/5; 106, 6/22.- 6/28):
NB.1.7.1.* (incl. PQ.*): 12.3% (⬇️ 18.8%; ⬇️ 24.5%)
XFG: 59.7% (⬆️ 50.6%; ⬆️ 47.2%)
LP.8.1.1.* (incl. NY.*): 5.3% † (⬇️ 10.6%; ⬇️ 11.3%)
ratnegative.tumblr.com/ONVariants #COVID19
Of 57 samples from 7/6 - 7/16 (vs. 85, 6/29 - 7/5; 106, 6/22.- 6/28):
NB.1.7.1.* (incl. PQ.*): 12.3% (⬇️ 18.8%; ⬇️ 24.5%)
XFG: 59.7% (⬆️ 50.6%; ⬆️ 47.2%)
LP.8.1.1.* (incl. NY.*): 5.3% † (⬇️ 10.6%; ⬇️ 11.3%)
ratnegative.tumblr.com/ONVariants #COVID19
August 1, 2025 at 4:32 AM
UPDATED: #Ontario #SARSCoV2 variants.
Of 57 samples from 7/6 - 7/16 (vs. 85, 6/29 - 7/5; 106, 6/22.- 6/28):
NB.1.7.1.* (incl. PQ.*): 12.3% (⬇️ 18.8%; ⬇️ 24.5%)
XFG: 59.7% (⬆️ 50.6%; ⬆️ 47.2%)
LP.8.1.1.* (incl. NY.*): 5.3% † (⬇️ 10.6%; ⬇️ 11.3%)
ratnegative.tumblr.com/ONVariants #COVID19
Of 57 samples from 7/6 - 7/16 (vs. 85, 6/29 - 7/5; 106, 6/22.- 6/28):
NB.1.7.1.* (incl. PQ.*): 12.3% (⬇️ 18.8%; ⬇️ 24.5%)
XFG: 59.7% (⬆️ 50.6%; ⬆️ 47.2%)
LP.8.1.1.* (incl. NY.*): 5.3% † (⬇️ 10.6%; ⬇️ 11.3%)
ratnegative.tumblr.com/ONVariants #COVID19
Reposted by Newfymainlander

Sanofi has a stellar reputation, a global marketing deal w Novavax, & invested $1.5 B in new vaccine manufacturing facilities in Canada 🇨🇦
Novavax has a superior Covid vaccine, a great adjuvant, & plans for new Flu vaccines.
Let's hope it all comes together 🤞
ir.novavax.com/press-releas...
Novavax has a superior Covid vaccine, a great adjuvant, & plans for new Flu vaccines.
Let's hope it all comes together 🤞
ir.novavax.com/press-releas...

U.S. FDA Approves BLA for Novavax's COVID-19 Vaccine - May 19, 2025
Nuvaxovid™ is the only recombinant protein-based, non-mRNA COVID-19 vaccine available in the U.S. Biologics License Application approval triggers $175 million Sanofi milestone payment, with...
ir.novavax.com
May 19, 2025 at 3:35 PM
Sanofi has a stellar reputation, a global marketing deal w Novavax, & invested $1.5 B in new vaccine manufacturing facilities in Canada 🇨🇦
Novavax has a superior Covid vaccine, a great adjuvant, & plans for new Flu vaccines.
Let's hope it all comes together 🤞
ir.novavax.com/press-releas...
Novavax has a superior Covid vaccine, a great adjuvant, & plans for new Flu vaccines.
Let's hope it all comes together 🤞
ir.novavax.com/press-releas...
Yikes! Petitcodiac Regional School’s poor ventilation is why I now homeschool. My child was always sick!
Some noteworthy results from the 2023 - 2024 data (buff.ly/2fEeTTu ):
Thirty-seven schools had peak carbon dioxide values above the 1500 PPM guideline. That's more than half.
The highest peak value was recorded at Petitcodiac Regional School - a building with mechanical ventilation.
Thirty-seven schools had peak carbon dioxide values above the 1500 PPM guideline. That's more than half.
The highest peak value was recorded at Petitcodiac Regional School - a building with mechanical ventilation.

May 16, 2025 at 3:35 AM
Yikes! Petitcodiac Regional School’s poor ventilation is why I now homeschool. My child was always sick!
Reposted by Newfymainlander

Some noteworthy results from the 2023 - 2024 data (buff.ly/2fEeTTu ):
Thirty-seven schools had peak carbon dioxide values above the 1500 PPM guideline. That's more than half.
The highest peak value was recorded at Petitcodiac Regional School - a building with mechanical ventilation.
Thirty-seven schools had peak carbon dioxide values above the 1500 PPM guideline. That's more than half.
The highest peak value was recorded at Petitcodiac Regional School - a building with mechanical ventilation.
May 12, 2025 at 7:15 PM
Some noteworthy results from the 2023 - 2024 data (buff.ly/2fEeTTu ):
Thirty-seven schools had peak carbon dioxide values above the 1500 PPM guideline. That's more than half.
The highest peak value was recorded at Petitcodiac Regional School - a building with mechanical ventilation.
Thirty-seven schools had peak carbon dioxide values above the 1500 PPM guideline. That's more than half.
The highest peak value was recorded at Petitcodiac Regional School - a building with mechanical ventilation.
Reposted by Newfymainlander
Last month, EECD released the results of air quality testing from the 2023 - 2024 school year. Data was again presented as a PDF chart, making analysis difficult.
I used their data to create visuals and a report, of sorts. You can read the full report here (PDF on OneDrive):
buff.ly/msa9XeV
I used their data to create visuals and a report, of sorts. You can read the full report here (PDF on OneDrive):
buff.ly/msa9XeV


May 12, 2025 at 7:15 PM
Last month, EECD released the results of air quality testing from the 2023 - 2024 school year. Data was again presented as a PDF chart, making analysis difficult.
I used their data to create visuals and a report, of sorts. You can read the full report here (PDF on OneDrive):
buff.ly/msa9XeV
I used their data to create visuals and a report, of sorts. You can read the full report here (PDF on OneDrive):
buff.ly/msa9XeV
Reposted by Newfymainlander
UPDATED: #Ontario #SARSCoV2 variants.
Of 128 samples from 3/9 - 3/15:
XEC.*: 28.1% (〰️ 28.9%; ⬇️ 39.1%)
LP.8.1.*: 23.4% (〰️ 24.5%; ⬇️ 26.6%)
MC.10.1.*: 10.9% (⬆️ 5.9%; ⬆️ 4%)
LF.7.*: 7.8% (⬇️ 11.1%; ⬆️ 2.6%)
ratnegative.tumblr.com/ONVariants #COVID19
Of 128 samples from 3/9 - 3/15:
XEC.*: 28.1% (〰️ 28.9%; ⬇️ 39.1%)
LP.8.1.*: 23.4% (〰️ 24.5%; ⬇️ 26.6%)
MC.10.1.*: 10.9% (⬆️ 5.9%; ⬆️ 4%)
LF.7.*: 7.8% (⬇️ 11.1%; ⬆️ 2.6%)
ratnegative.tumblr.com/ONVariants #COVID19

April 1, 2025 at 3:22 AM
UPDATED: #Ontario #SARSCoV2 variants.
Of 128 samples from 3/9 - 3/15:
XEC.*: 28.1% (〰️ 28.9%; ⬇️ 39.1%)
LP.8.1.*: 23.4% (〰️ 24.5%; ⬇️ 26.6%)
MC.10.1.*: 10.9% (⬆️ 5.9%; ⬆️ 4%)
LF.7.*: 7.8% (⬇️ 11.1%; ⬆️ 2.6%)
ratnegative.tumblr.com/ONVariants #COVID19
Of 128 samples from 3/9 - 3/15:
XEC.*: 28.1% (〰️ 28.9%; ⬇️ 39.1%)
LP.8.1.*: 23.4% (〰️ 24.5%; ⬇️ 26.6%)
MC.10.1.*: 10.9% (⬆️ 5.9%; ⬆️ 4%)
LF.7.*: 7.8% (⬇️ 11.1%; ⬆️ 2.6%)
ratnegative.tumblr.com/ONVariants #COVID19
Reposted by Newfymainlander

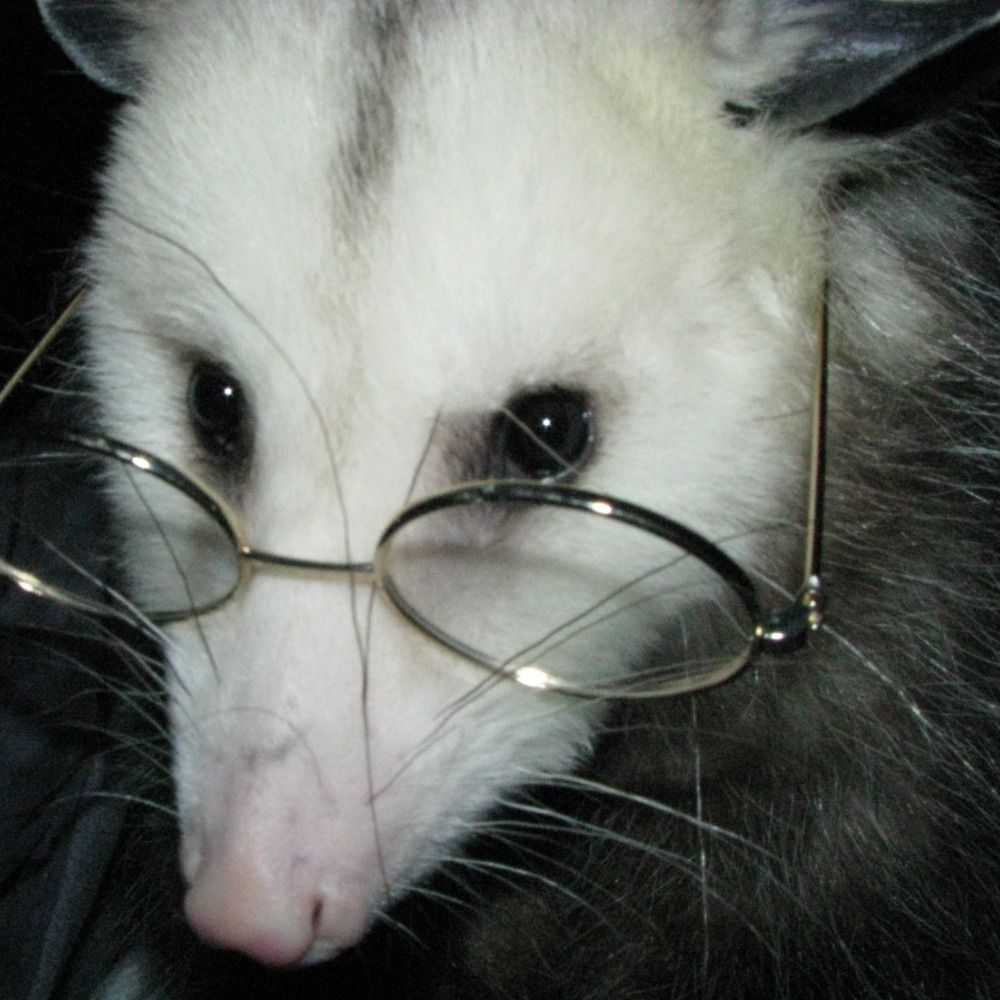
Helllloooo, Laaaadiiiiesss. My name's Dr. Pierre, and I'm here to check on your biological clocks.

April 2, 2025 at 3:16 PM
Helllloooo, Laaaadiiiiesss. My name's Dr. Pierre, and I'm here to check on your biological clocks.
Reposted by Newfymainlander

All of America’s supposed enemies this morning

April 3, 2025 at 1:12 PM
All of America’s supposed enemies this morning
Reposted by Newfymainlander
UPDATED: #Ontario #SARSCoV2 variants.
Of 50 samples from 3/2 - 3/8:
XEC.*: 22% (⬇️ 37.6%)
LP.8.1.*: 20% (⬇️ 30.1%)
KP.3.3.2.* (incl. NP.1): 20% (⬆️ 5.8%)
LF.7.7.2: 24% (⬆️ 3.5%)
ratnegative.tumblr.com/ONVariants #COVID19
Of 50 samples from 3/2 - 3/8:
XEC.*: 22% (⬇️ 37.6%)
LP.8.1.*: 20% (⬇️ 30.1%)
KP.3.3.2.* (incl. NP.1): 20% (⬆️ 5.8%)
LF.7.7.2: 24% (⬆️ 3.5%)
ratnegative.tumblr.com/ONVariants #COVID19

March 29, 2025 at 10:18 PM
UPDATED: #Ontario #SARSCoV2 variants.
Of 50 samples from 3/2 - 3/8:
XEC.*: 22% (⬇️ 37.6%)
LP.8.1.*: 20% (⬇️ 30.1%)
KP.3.3.2.* (incl. NP.1): 20% (⬆️ 5.8%)
LF.7.7.2: 24% (⬆️ 3.5%)
ratnegative.tumblr.com/ONVariants #COVID19
Of 50 samples from 3/2 - 3/8:
XEC.*: 22% (⬇️ 37.6%)
LP.8.1.*: 20% (⬇️ 30.1%)
KP.3.3.2.* (incl. NP.1): 20% (⬆️ 5.8%)
LF.7.7.2: 24% (⬆️ 3.5%)
ratnegative.tumblr.com/ONVariants #COVID19
Reposted by Newfymainlander
Please see and share @davidcoonmla.ca ‘s motion for paid sick days in NB. We really need this. Demand it! #nbpoli please share and please contact your MLA!! youtube.com/shorts/nLKQ2...

David - Motion on Paid Sick Leave | Motion sur le congé de maladie payé, March 21, 2025
YouTube video by Green Caucus Vert
youtube.com
March 31, 2025 at 12:23 AM
Please see and share @davidcoonmla.ca ‘s motion for paid sick days in NB. We really need this. Demand it! #nbpoli please share and please contact your MLA!! youtube.com/shorts/nLKQ2...
Reposted by Newfymainlander
👋 #nbpoli @popnb.bsky.social has launched a new petition demanding an update from GNB on promised clean air initiatives and for government to acknowledge airborne transmission of SARS-CoV-2. Public Health has a press conference tomorrow morning. Please sign and share: chng.it/HTf9NZfMsk

Sign the Petition
Require an update from GNB on role of aerosols and IAQ in transmission; progress on IAQ
chng.it
March 27, 2025 at 12:31 AM
👋 #nbpoli @popnb.bsky.social has launched a new petition demanding an update from GNB on promised clean air initiatives and for government to acknowledge airborne transmission of SARS-CoV-2. Public Health has a press conference tomorrow morning. Please sign and share: chng.it/HTf9NZfMsk
Reposted by Newfymainlander

44% is an average across the entire year.
You can see from the chart that there has always been an undercount but following the redefinition, the amount of uncounted deaths caused directly or antecedently by Covid-19 jumps to over 60%.
This is simultaneously unsurprising and infuriating.
You can see from the chart that there has always been an undercount but following the redefinition, the amount of uncounted deaths caused directly or antecedently by Covid-19 jumps to over 60%.
This is simultaneously unsurprising and infuriating.
March 10, 2025 at 6:15 PM
44% is an average across the entire year.
You can see from the chart that there has always been an undercount but following the redefinition, the amount of uncounted deaths caused directly or antecedently by Covid-19 jumps to over 60%.
This is simultaneously unsurprising and infuriating.
You can see from the chart that there has always been an undercount but following the redefinition, the amount of uncounted deaths caused directly or antecedently by Covid-19 jumps to over 60%.
This is simultaneously unsurprising and infuriating.
Reposted by Newfymainlander
Still wrapping my head and my words around this, but here is a peak at what I've uncovered.
In addition to spurious rationale for abandoning the nationally established definition of a Covid-19 fatality, NB's reporting change led to approximately 44% of Covid-caused deaths to go uncounted in 2023.
In addition to spurious rationale for abandoning the nationally established definition of a Covid-19 fatality, NB's reporting change led to approximately 44% of Covid-caused deaths to go uncounted in 2023.

March 10, 2025 at 6:15 PM
Still wrapping my head and my words around this, but here is a peak at what I've uncovered.
In addition to spurious rationale for abandoning the nationally established definition of a Covid-19 fatality, NB's reporting change led to approximately 44% of Covid-caused deaths to go uncounted in 2023.
In addition to spurious rationale for abandoning the nationally established definition of a Covid-19 fatality, NB's reporting change led to approximately 44% of Covid-caused deaths to go uncounted in 2023.
Reposted by Newfymainlander

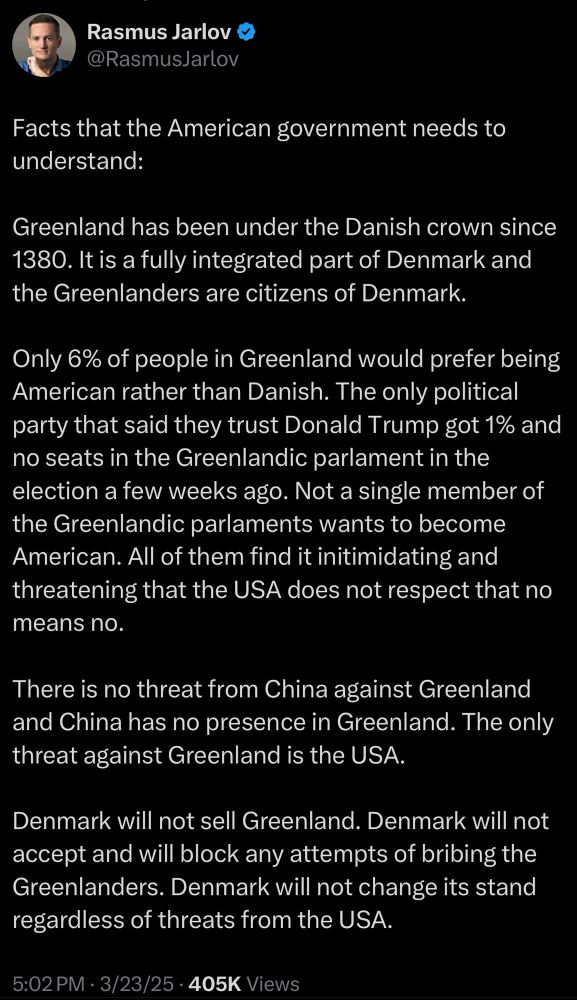
Hey I never thought of it this way. He’s a predator. No means No. From Greenland 🇬🇱 and from Canada 🇨🇦. No means no, have you heard that before?

March 24, 2025 at 1:18 PM
Hey I never thought of it this way. He’s a predator. No means No. From Greenland 🇬🇱 and from Canada 🇨🇦. No means no, have you heard that before?
Reposted by Newfymainlander

U.S. border officials have caught more people with eggs than fentanyl this year

U.S. border officials have caught more people with eggs than fentanyl this year
U.S. President Donald Trump has made stopping fentanyl at both the northern and southern borders one of his administration's top priorities, but American law enforcement data shows that another commod...
www.ctvnews.ca
March 22, 2025 at 12:56 PM
U.S. border officials have caught more people with eggs than fentanyl this year
Reposted by Newfymainlander

U.S. border officials are using more aggressive tactics at ports of entry as the Trump administration scrutinizes legal immigrants who have expressed opposition to its policies. It has prompted American allies to update their travel advisories.

Trump’s Deportation Agenda Expands to Legal Immigrants and Tourists
U.S. border officials are using more aggressive tactics at ports of entry as the administration scrutinizes green card and visa holders who have expressed opposition to its policies.
www.nytimes.com
March 21, 2025 at 7:43 PM
U.S. border officials are using more aggressive tactics at ports of entry as the Trump administration scrutinizes legal immigrants who have expressed opposition to its policies. It has prompted American allies to update their travel advisories.
Reposted by Newfymainlander

BREAKING: 34,000 people have showed up in Denver, Colorado this evening to see Bernie Sanders and AOC fight oligarchy and authoritarianism.
March 22, 2025 at 12:46 AM
BREAKING: 34,000 people have showed up in Denver, Colorado this evening to see Bernie Sanders and AOC fight oligarchy and authoritarianism.
Reposted by Newfymainlander
As promised, I sought to find out why NB redefined Covid-19 deaths and how that redefinition impacted reporting, and the response is frightening.
They changed the definition based on vibes, resulting in 2 of every 3 covid-caused deaths not being reported.
#nbpoli #covid19
They changed the definition based on vibes, resulting in 2 of every 3 covid-caused deaths not being reported.
#nbpoli #covid19

Cultivating the Myth of Transparency
New Brunswick Public Health obscured Covid-19 death metrics in the name of convenience
popnb.substack.com
March 20, 2025 at 3:52 PM
Reposted by Newfymainlander

Canada will build 3 Arctic military hubs as it ramps up regional footprint #Canada #Arctic
globalnews.ca/news/1107004...
globalnews.ca/news/1107004...

Canada will build 3 Arctic military hubs as it ramps up regional footprint - National | Globalnews.ca
The hubs are the cornerstone of the federal government's Arctic security strategy, which committed $2.67 billion over 20 years to building them.
globalnews.ca
March 16, 2025 at 11:36 AM
Canada will build 3 Arctic military hubs as it ramps up regional footprint #Canada #Arctic
globalnews.ca/news/1107004...
globalnews.ca/news/1107004...