


John Dodge Hayes
@johnnyboytaco.bsky.social
As-a-Service finance innovator. Climate action enabler. Weather geek. AI enthusiast. Stock and options trader. Do-gooder. God loves a cheerful giver.
Reposted by John Dodge Hayes

CA and NV have DECREASED their year-on-year grid electricity demands by growing roof PV more than new grid demands (datacenters, EVs, heat pumps) have increased
CA has the 3rd-most data centers and by far the most EVs
Other states could take a lesson in how to avoid increases in grid demand
CA has the 3rd-most data centers and by far the most EVs
Other states could take a lesson in how to avoid increases in grid demand

November 29, 2025 at 7:13 PM
CA and NV have DECREASED their year-on-year grid electricity demands by growing roof PV more than new grid demands (datacenters, EVs, heat pumps) have increased
CA has the 3rd-most data centers and by far the most EVs
Other states could take a lesson in how to avoid increases in grid demand
CA has the 3rd-most data centers and by far the most EVs
Other states could take a lesson in how to avoid increases in grid demand
Comet Lemmon: Found it tonight! Photo taken at 7:45pm PDT from the beach in Monterey, CA. 60sec exposure on my Pixel 9 in Night Sight mode.

October 23, 2025 at 4:07 AM
Comet Lemmon: Found it tonight! Photo taken at 7:45pm PDT from the beach in Monterey, CA. 60sec exposure on my Pixel 9 in Night Sight mode.
Reposted by John Dodge Hayes
Busting another myth. This one on how much mining is needed for fossil fuels versus renewables.
We will need orders of magnitude fewer mines and orders of magnitude less mined material in a clean, renewable energy world.
www.youtube.com/shorts/8NZ0E...
We will need orders of magnitude fewer mines and orders of magnitude less mined material in a clean, renewable energy world.
www.youtube.com/shorts/8NZ0E...

Busting a myth about how much mining is needed for fossil fuels versus renewables
YouTube video by Mark Z. Jacobson
www.youtube.com
October 1, 2025 at 10:02 PM
Busting another myth. This one on how much mining is needed for fossil fuels versus renewables.
We will need orders of magnitude fewer mines and orders of magnitude less mined material in a clean, renewable energy world.
www.youtube.com/shorts/8NZ0E...
We will need orders of magnitude fewer mines and orders of magnitude less mined material in a clean, renewable energy world.
www.youtube.com/shorts/8NZ0E...
Reposted by John Dodge Hayes
A transition to 100% Wind-Water-Solar across all energy sectors in the U.S. requires only 35% of the land used for energy by fossil fuels and biofuels today.
It is current energy that is hogging land. Renewables reduce land use.
www.youtube.com/shorts/ccu-Q...
It is current energy that is hogging land. Renewables reduce land use.
www.youtube.com/shorts/ccu-Q...
Busting a myth on how much land is needed for the U.S. to run on 100% renewables vs fossil+biofuels
YouTube video by Mark Z. Jacobson
www.youtube.com
October 3, 2025 at 10:01 PM
A transition to 100% Wind-Water-Solar across all energy sectors in the U.S. requires only 35% of the land used for energy by fossil fuels and biofuels today.
It is current energy that is hogging land. Renewables reduce land use.
www.youtube.com/shorts/ccu-Q...
It is current energy that is hogging land. Renewables reduce land use.
www.youtube.com/shorts/ccu-Q...
Reposted by John Dodge Hayes


October 2, 2025 at 1:53 AM
Reposted by John Dodge Hayes

A bus of Bronx middle schoolers pulled up to the Capitol this morning for a long-planned field trip just a few hours after the government shut down.
All Capitol tours were cancelled as the guides can’t work in shutdown.
So I escorted them in myself and gave them a personal tour. They were great!
All Capitol tours were cancelled as the guides can’t work in shutdown.
So I escorted them in myself and gave them a personal tour. They were great!
October 1, 2025 at 5:15 PM
A bus of Bronx middle schoolers pulled up to the Capitol this morning for a long-planned field trip just a few hours after the government shut down.
All Capitol tours were cancelled as the guides can’t work in shutdown.
So I escorted them in myself and gave them a personal tour. They were great!
All Capitol tours were cancelled as the guides can’t work in shutdown.
So I escorted them in myself and gave them a personal tour. They were great!
Reposted by John Dodge Hayes
And another reminder that a transition of the U.S. to 100% WindWaterSolar across all energy sectors reduces private annual energy costs to Americans by 63% (giving an energy-cost payback time of <6 y) and total social energy costs by 86% (payback time <1 y).

September 20, 2025 at 8:54 PM
And another reminder that a transition of the U.S. to 100% WindWaterSolar across all energy sectors reduces private annual energy costs to Americans by 63% (giving an energy-cost payback time of <6 y) and total social energy costs by 86% (payback time <1 y).
Tropical Storm Mario has formed in the Pacific. No doubt we'll get some Spaghetti models with this one. Letsa Go!! 🤓

September 13, 2025 at 8:03 AM
Tropical Storm Mario has formed in the Pacific. No doubt we'll get some Spaghetti models with this one. Letsa Go!! 🤓
On Utopias, Imperial Decline, and Monterey, California
www.un-diplomatic.com/p/on-utopias...
www.un-diplomatic.com/p/on-utopias...

On Utopias, Imperial Decline, and Monterey, California
Some of our treasured utopias will be washed away with imperial decline. But we can remember what made them magical as we imagine a new, post-imperialist world.
www.un-diplomatic.com
September 5, 2025 at 6:37 AM
On Utopias, Imperial Decline, and Monterey, California
www.un-diplomatic.com/p/on-utopias...
www.un-diplomatic.com/p/on-utopias...
Reposted by John Dodge Hayes
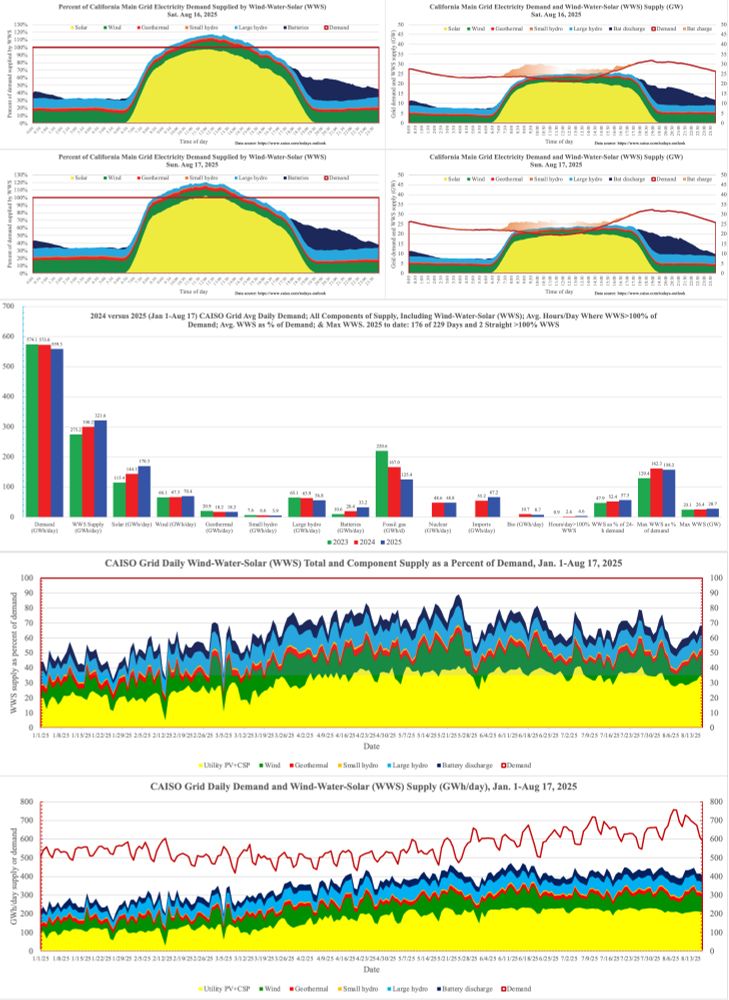
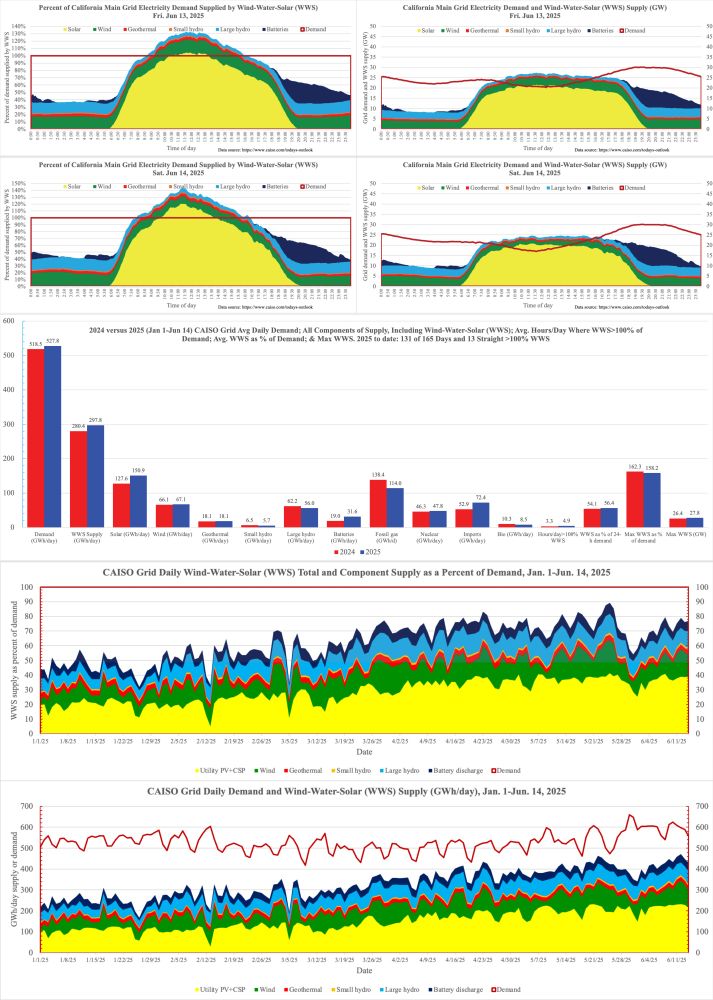
California on pace to become 100% WindWaterSolar 24/7/365 by 2033
57.5% of all demand in 2025 met by WWS, vs 52.4% in 2024.
2 more >100% WWS days for 176 of 229 (76.9%) in 2025
Gas down 25% v '24 & 43% v '23
Demand down 2.4% v '24 & 2.6% v '23 despite more EVs, heat pumps, AI
57.5% of all demand in 2025 met by WWS, vs 52.4% in 2024.
2 more >100% WWS days for 176 of 229 (76.9%) in 2025
Gas down 25% v '24 & 43% v '23
Demand down 2.4% v '24 & 2.6% v '23 despite more EVs, heat pumps, AI
August 18, 2025 at 3:26 PM
California on pace to become 100% WindWaterSolar 24/7/365 by 2033
57.5% of all demand in 2025 met by WWS, vs 52.4% in 2024.
2 more >100% WWS days for 176 of 229 (76.9%) in 2025
Gas down 25% v '24 & 43% v '23
Demand down 2.4% v '24 & 2.6% v '23 despite more EVs, heat pumps, AI
57.5% of all demand in 2025 met by WWS, vs 52.4% in 2024.
2 more >100% WWS days for 176 of 229 (76.9%) in 2025
Gas down 25% v '24 & 43% v '23
Demand down 2.4% v '24 & 2.6% v '23 despite more EVs, heat pumps, AI
Reposted by John Dodge Hayes
Where is the energy emergency requiring more fossils?
U.S. annual-average end-use supply & demand for all power from all fuels and across all sectors: transport, industry, residential, commercial sectors, have been constant (only 3.3% increase) from 2000-2023 (latest data).
U.S. annual-average end-use supply & demand for all power from all fuels and across all sectors: transport, industry, residential, commercial sectors, have been constant (only 3.3% increase) from 2000-2023 (latest data).

August 14, 2025 at 6:33 PM
Where is the energy emergency requiring more fossils?
U.S. annual-average end-use supply & demand for all power from all fuels and across all sectors: transport, industry, residential, commercial sectors, have been constant (only 3.3% increase) from 2000-2023 (latest data).
U.S. annual-average end-use supply & demand for all power from all fuels and across all sectors: transport, industry, residential, commercial sectors, have been constant (only 3.3% increase) from 2000-2023 (latest data).
Reposted by John Dodge Hayes
Here is how U.S. all-sector end-use power demand & supply would have decreased 1960-2023 if we had gone through the 5 stages of electrification to transition the U.S. to WindWaterSolar.
End result: 56.7% less demand.
Can still do this in the future
web.stanford.edu/group/efmh/j...
End result: 56.7% less demand.
Can still do this in the future
web.stanford.edu/group/efmh/j...

August 15, 2025 at 8:13 AM
Here is how U.S. all-sector end-use power demand & supply would have decreased 1960-2023 if we had gone through the 5 stages of electrification to transition the U.S. to WindWaterSolar.
End result: 56.7% less demand.
Can still do this in the future
web.stanford.edu/group/efmh/j...
End result: 56.7% less demand.
Can still do this in the future
web.stanford.edu/group/efmh/j...
Reposted by John Dodge Hayes
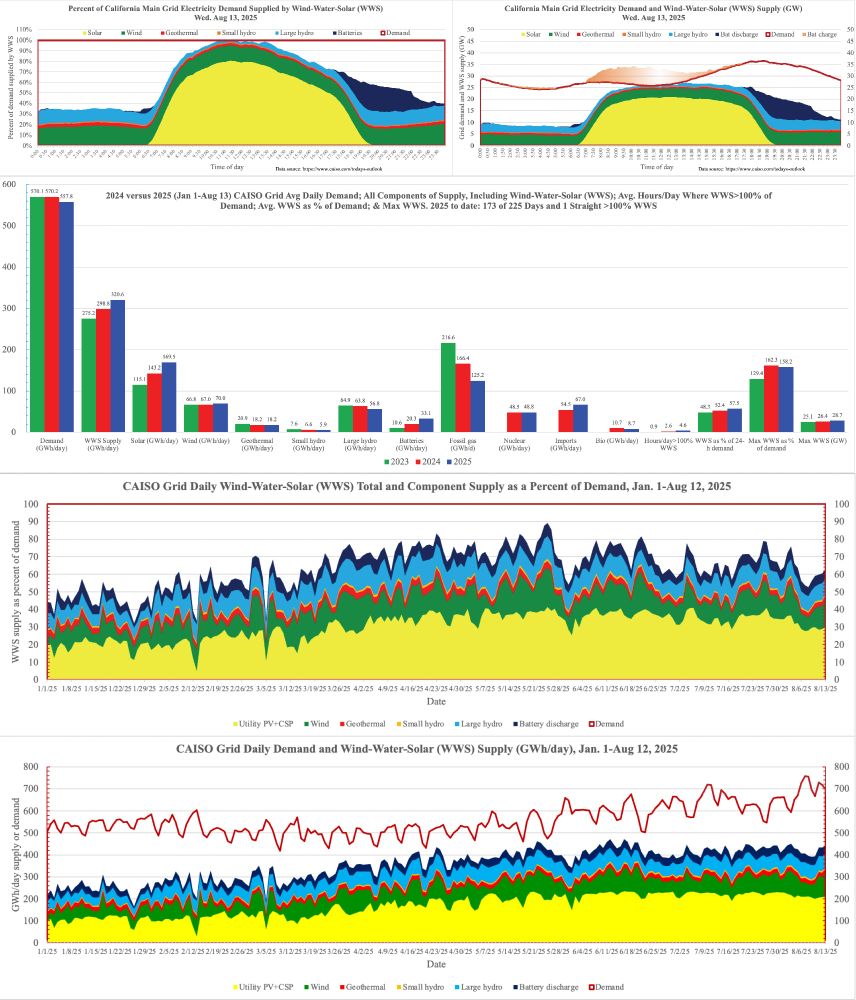
It's mid-August and the California ISO grid is using 25% less fossil gas in 2025 than from Jan 1-Aug 13, 2024 & 42% less than from Jan 1-August 13, 2023.
WWS has supplied 57.5% of all demand in 2025 v 52.4% in 2024 and 48.3% in 2023
At this pace, CAISO will be 100% WWS 24/7/365 by 2033!
WWS has supplied 57.5% of all demand in 2025 v 52.4% in 2024 and 48.3% in 2023
At this pace, CAISO will be 100% WWS 24/7/365 by 2033!
August 14, 2025 at 5:17 PM
It's mid-August and the California ISO grid is using 25% less fossil gas in 2025 than from Jan 1-Aug 13, 2024 & 42% less than from Jan 1-August 13, 2023.
WWS has supplied 57.5% of all demand in 2025 v 52.4% in 2024 and 48.3% in 2023
At this pace, CAISO will be 100% WWS 24/7/365 by 2033!
WWS has supplied 57.5% of all demand in 2025 v 52.4% in 2024 and 48.3% in 2023
At this pace, CAISO will be 100% WWS 24/7/365 by 2033!
Reposted by John Dodge Hayes
21% less fossil gas used in CA so far in 2025 than in 2024 & 40% less than in 2023
Demand also down 0.6% v 2024 & 0.8% v 2023
So much for claims that
1) We need more fossils to meet increase in demand due to AI
2) Grid can't stay stable unless we use unleash more fossils
Demand also down 0.6% v 2024 & 0.8% v 2023
So much for claims that
1) We need more fossils to meet increase in demand due to AI
2) Grid can't stay stable unless we use unleash more fossils

July 20, 2025 at 6:07 PM
21% less fossil gas used in CA so far in 2025 than in 2024 & 40% less than in 2023
Demand also down 0.6% v 2024 & 0.8% v 2023
So much for claims that
1) We need more fossils to meet increase in demand due to AI
2) Grid can't stay stable unless we use unleash more fossils
Demand also down 0.6% v 2024 & 0.8% v 2023
So much for claims that
1) We need more fossils to meet increase in demand due to AI
2) Grid can't stay stable unless we use unleash more fossils
Reposted by John Dodge Hayes
Is the GOP listening?
Wind+solar 95.7% of new US capacity Jan-Apr 2025
Wind: 2,183 MW-18%
Solar: 9,451-77.7%
Gas 511-4.2%
Oil 11-0.1%
WindWaterSolar now ~33% all US capacity
Wind-11.8%
Water-7.7% hydro; 0.3% geo
Solar-11.0%
Tot: 30.8%+roof PV->~33%
www.windtech-international.com/industry-new...
Wind+solar 95.7% of new US capacity Jan-Apr 2025
Wind: 2,183 MW-18%
Solar: 9,451-77.7%
Gas 511-4.2%
Oil 11-0.1%
WindWaterSolar now ~33% all US capacity
Wind-11.8%
Water-7.7% hydro; 0.3% geo
Solar-11.0%
Tot: 30.8%+roof PV->~33%
www.windtech-international.com/industry-new...
Windtech International - Wind and solar account for nearly all new USA power capacity additions in early 2025
Windtech International is the only worldwide magazine with a technological focus for global the wind energy industry.
www.windtech-international.com
July 3, 2025 at 4:27 PM
Is the GOP listening?
Wind+solar 95.7% of new US capacity Jan-Apr 2025
Wind: 2,183 MW-18%
Solar: 9,451-77.7%
Gas 511-4.2%
Oil 11-0.1%
WindWaterSolar now ~33% all US capacity
Wind-11.8%
Water-7.7% hydro; 0.3% geo
Solar-11.0%
Tot: 30.8%+roof PV->~33%
www.windtech-international.com/industry-new...
Wind+solar 95.7% of new US capacity Jan-Apr 2025
Wind: 2,183 MW-18%
Solar: 9,451-77.7%
Gas 511-4.2%
Oil 11-0.1%
WindWaterSolar now ~33% all US capacity
Wind-11.8%
Water-7.7% hydro; 0.3% geo
Solar-11.0%
Tot: 30.8%+roof PV->~33%
www.windtech-international.com/industry-new...
Reposted by John Dodge Hayes

Happy 17th Anniversary to WALL-E! 🥳🎉


June 27, 2025 at 8:00 AM
Happy 17th Anniversary to WALL-E! 🥳🎉
Reposted by John Dodge Hayes
Many thanks to the members of California’s congressional delegation and to California’s Governor who stood up for the health of the ocean and California’s future with their opposition to expanded offshore oil and gas leasing along our coast. #ActForTheOcean #FossilFuels #OuterContinentalShelf

June 19, 2025 at 12:06 AM
Many thanks to the members of California’s congressional delegation and to California’s Governor who stood up for the health of the ocean and California’s future with their opposition to expanded offshore oil and gas leasing along our coast. #ActForTheOcean #FossilFuels #OuterContinentalShelf
Reposted by John Dodge Hayes
2 years ago year to date, fossil gas output on California's main grid was 93% higher than solar output
In 2025, solar output is 32% higher than gas output
Gas output has dropped 41.4% and solar output has risen 50% in 2 years
Battery output has also risen 215%
In 2025, solar output is 32% higher than gas output
Gas output has dropped 41.4% and solar output has risen 50% in 2 years
Battery output has also risen 215%
June 15, 2025 at 4:01 PM
2 years ago year to date, fossil gas output on California's main grid was 93% higher than solar output
In 2025, solar output is 32% higher than gas output
Gas output has dropped 41.4% and solar output has risen 50% in 2 years
Battery output has also risen 215%
In 2025, solar output is 32% higher than gas output
Gas output has dropped 41.4% and solar output has risen 50% in 2 years
Battery output has also risen 215%
Reposted by John Dodge Hayes
According to utilities and skeptics in 2009, when this paper came out,
web.stanford.edu/group/efmh/j...
it was impossible to keep the grid stable with more than 20% WindWaterSolar on the grid, let alone 80%.
web.stanford.edu/group/efmh/j...
it was impossible to keep the grid stable with more than 20% WindWaterSolar on the grid, let alone 80%.
May 26, 2025 at 4:19 AM
According to utilities and skeptics in 2009, when this paper came out,
web.stanford.edu/group/efmh/j...
it was impossible to keep the grid stable with more than 20% WindWaterSolar on the grid, let alone 80%.
web.stanford.edu/group/efmh/j...
it was impossible to keep the grid stable with more than 20% WindWaterSolar on the grid, let alone 80%.
Reposted by John Dodge Hayes
No blackouts on the California ISO grid despite a huge growth in WindWaterSolar. In fact, no blackout since 2020
Instead, we have had 52 straight and 93 of 125 days of >100% WWS in '25, for an average of 4.3 h/day
To boot, 45% less gas has been used in '25 than in '23 and 24% less than in '24
Instead, we have had 52 straight and 93 of 125 days of >100% WWS in '25, for an average of 4.3 h/day
To boot, 45% less gas has been used in '25 than in '23 and 24% less than in '24

May 6, 2025 at 4:43 PM
No blackouts on the California ISO grid despite a huge growth in WindWaterSolar. In fact, no blackout since 2020
Instead, we have had 52 straight and 93 of 125 days of >100% WWS in '25, for an average of 4.3 h/day
To boot, 45% less gas has been used in '25 than in '23 and 24% less than in '24
Instead, we have had 52 straight and 93 of 125 days of >100% WWS in '25, for an average of 4.3 h/day
To boot, 45% less gas has been used in '25 than in '23 and 24% less than in '24
Reposted by John Dodge Hayes

This is a new image from #JWST.
The bright points with spikes are stars in the Milky Way.
Everything else is a galaxy.
Everything. Else. Is. A. Galaxy.
The bright points with spikes are stars in the Milky Way.
Everything else is a galaxy.
Everything. Else. Is. A. Galaxy.

April 29, 2025 at 6:47 PM
This is a new image from #JWST.
The bright points with spikes are stars in the Milky Way.
Everything else is a galaxy.
Everything. Else. Is. A. Galaxy.
The bright points with spikes are stars in the Milky Way.
Everything else is a galaxy.
Everything. Else. Is. A. Galaxy.
Reposted by John Dodge Hayes

The President of the United States has chosen to throw the economy into turmoil.
April 30, 2025 at 1:32 AM
The President of the United States has chosen to throw the economy into turmoil.
Reposted by John Dodge Hayes
We have a big win to celebrate! Thanks to California's bold leadership in enacting #SB54, we can say goodbye to plastic foam takeout food containers. The statewide ban took effect because producers didn't reach a 25 percent recycling rate by Jan. 1. #PlasticPollution #ActOnPlastic #CircularEconomy

April 28, 2025 at 11:06 PM
We have a big win to celebrate! Thanks to California's bold leadership in enacting #SB54, we can say goodbye to plastic foam takeout food containers. The statewide ban took effect because producers didn't reach a 25 percent recycling rate by Jan. 1. #PlasticPollution #ActOnPlastic #CircularEconomy
Reposted by John Dodge Hayes

The Rapid X-band Polarimetric Radar (RaXPol) from OU'S Advanced Radar Research Center (ARRC) beautifully captured the tornado near Matador, Texas last night 🌪️
At it's fastest rotation rate, RaXPol can complete a 360° spin in just 2 seconds and a full volume scan in as little as 20 seconds! #txwx
At it's fastest rotation rate, RaXPol can complete a 360° spin in just 2 seconds and a full volume scan in as little as 20 seconds! #txwx
April 25, 2025 at 11:38 PM
The Rapid X-band Polarimetric Radar (RaXPol) from OU'S Advanced Radar Research Center (ARRC) beautifully captured the tornado near Matador, Texas last night 🌪️
At it's fastest rotation rate, RaXPol can complete a 360° spin in just 2 seconds and a full volume scan in as little as 20 seconds! #txwx
At it's fastest rotation rate, RaXPol can complete a 360° spin in just 2 seconds and a full volume scan in as little as 20 seconds! #txwx
Reposted by John Dodge Hayes
California overtakes Japan to become the fourth largest economy in the world
www.newsweek.com/california-o...
But that's not the big news. The big news is the 4th-largest economy in the world is breaking records in and is busting myths about growing huge amounts of WindWaterSolar on its main grid
www.newsweek.com/california-o...
But that's not the big news. The big news is the 4th-largest economy in the world is breaking records in and is busting myths about growing huge amounts of WindWaterSolar on its main grid
April 24, 2025 at 5:13 PM
California overtakes Japan to become the fourth largest economy in the world
www.newsweek.com/california-o...
But that's not the big news. The big news is the 4th-largest economy in the world is breaking records in and is busting myths about growing huge amounts of WindWaterSolar on its main grid
www.newsweek.com/california-o...
But that's not the big news. The big news is the 4th-largest economy in the world is breaking records in and is busting myths about growing huge amounts of WindWaterSolar on its main grid