


Matthias Stahl
@higsch.com
| Husband & dad^3
| head data & visualizations at @spiegel.de
| #Svelte and #D3
| biochemistry & computational biology PhD
| 🇸🇪🇩🇪🇪🇺
| https://spiegel.de/duv
| https://higsch.com
| head data & visualizations at @spiegel.de
| #Svelte and #D3
| biochemistry & computational biology PhD
| 🇸🇪🇩🇪🇪🇺
| https://spiegel.de/duv
| https://higsch.com
Pinned
Matthias Stahl
@higsch.com
· May 27
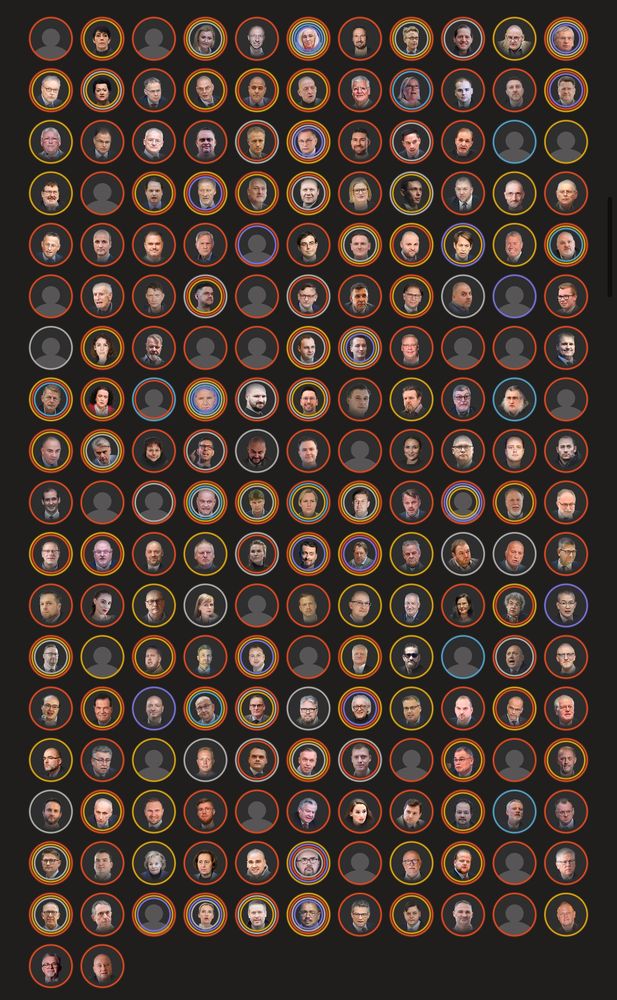

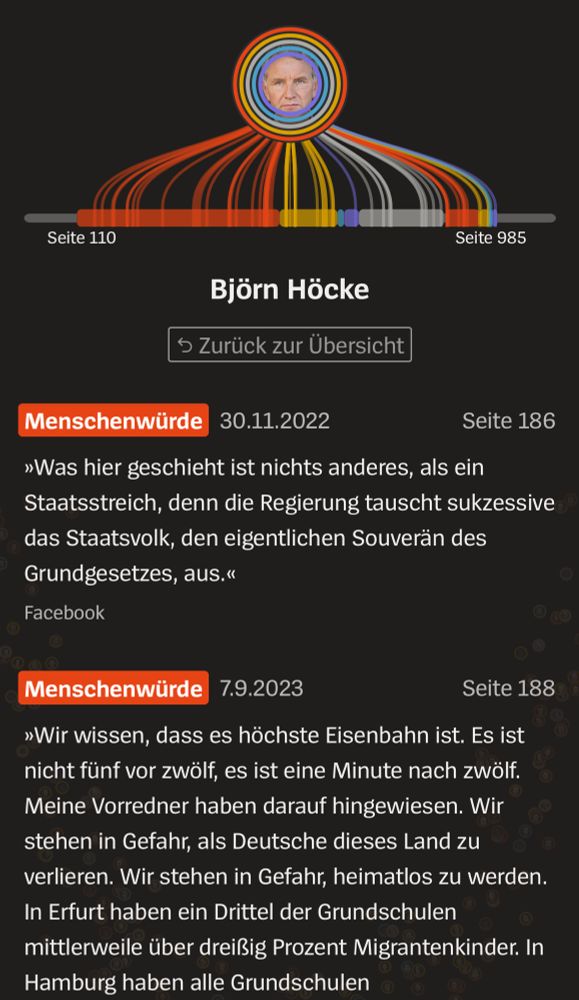
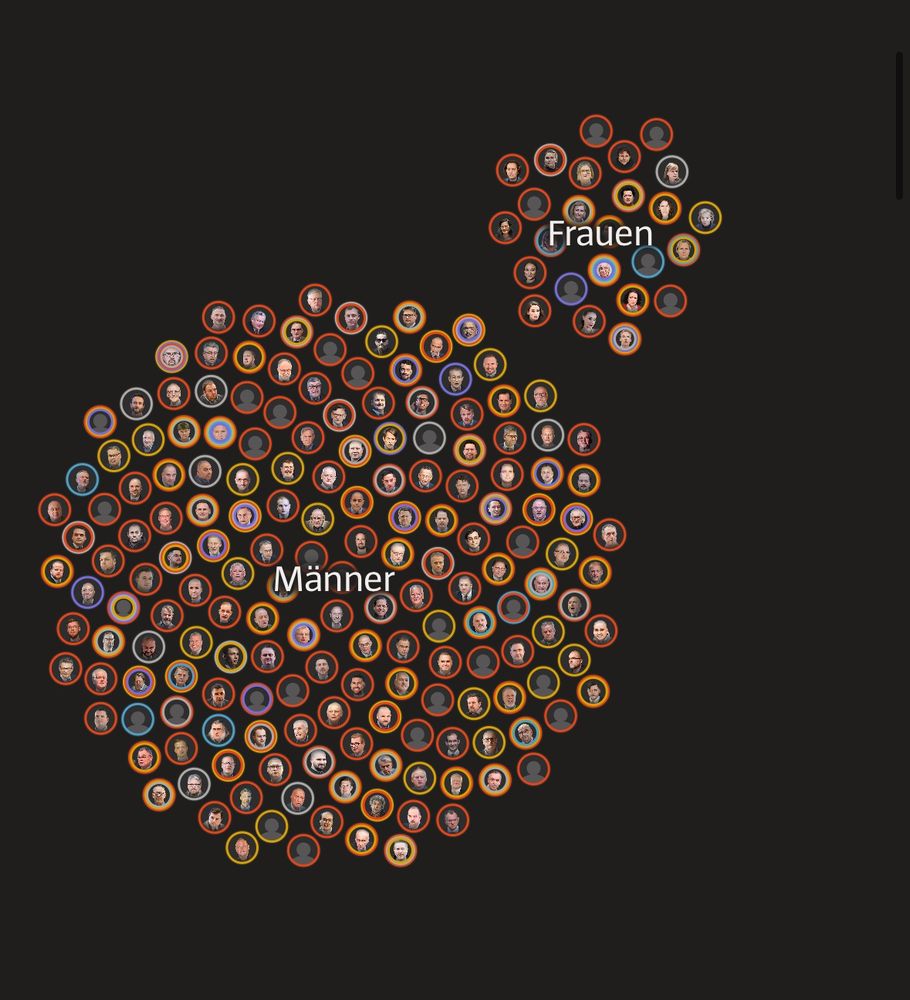
We digitized the AfD report of the Federal Office for the Protection of the Constitution.
This (secret) document was created to deliver proofs for the party‘s extreme right nature.
Now you can explore it interactively.
➡️ 🎁 🇩🇪 www.spiegel.de/politik/deut...
This (secret) document was created to deliver proofs for the party‘s extreme right nature.
Now you can explore it interactively.
➡️ 🎁 🇩🇪 www.spiegel.de/politik/deut...
Reposted by Matthias Stahl

Yes, we will have another DataViz Meetup in November! 🕺🏻🕺🏻🕺🏻
On the 20th @higsch.com and me we will meet you at The Information Lab Deutschland and have a chat about teaching data visualization. 🤓
So, sign up via www.meetup.com/de-DE/data-v... and come in large numbers.
#dataviz #hamburg
On the 20th @higsch.com and me we will meet you at The Information Lab Deutschland and have a chat about teaching data visualization. 🤓
So, sign up via www.meetup.com/de-DE/data-v... and come in large numbers.
#dataviz #hamburg

Teaching Data Viz, Do., 20. Nov. 2025, 18:30 | Meetup
In our 8th DataViz Meetup we will discuss about **teaching data viz**–a topic that might be perceived as rather dry by your peers. 😉 We will fittingly meet at **[The Infor
www.meetup.com
November 7, 2025 at 7:17 AM
Yes, we will have another DataViz Meetup in November! 🕺🏻🕺🏻🕺🏻
On the 20th @higsch.com and me we will meet you at The Information Lab Deutschland and have a chat about teaching data visualization. 🤓
So, sign up via www.meetup.com/de-DE/data-v... and come in large numbers.
#dataviz #hamburg
On the 20th @higsch.com and me we will meet you at The Information Lab Deutschland and have a chat about teaching data visualization. 🤓
So, sign up via www.meetup.com/de-DE/data-v... and come in large numbers.
#dataviz #hamburg
Reposted by Matthias Stahl

My #IEEEVIS 2025 paper explorer is live! 🎉
👉 johnguerra.co/viz/ieeevis2... 👈
An interactive #dataviz to explore 300+ papers by similarity. Perfect for:
✨ Discovering papers related to your interests
✨ Planning which sessions to attend
✨ Creating your own paper list (new!)
Pls help me distribute it
👉 johnguerra.co/viz/ieeevis2... 👈
An interactive #dataviz to explore 300+ papers by similarity. Perfect for:
✨ Discovering papers related to your interests
✨ Planning which sessions to attend
✨ Creating your own paper list (new!)
Pls help me distribute it
November 2, 2025 at 1:28 PM
My #IEEEVIS 2025 paper explorer is live! 🎉
👉 johnguerra.co/viz/ieeevis2... 👈
An interactive #dataviz to explore 300+ papers by similarity. Perfect for:
✨ Discovering papers related to your interests
✨ Planning which sessions to attend
✨ Creating your own paper list (new!)
Pls help me distribute it
👉 johnguerra.co/viz/ieeevis2... 👈
An interactive #dataviz to explore 300+ papers by similarity. Perfect for:
✨ Discovering papers related to your interests
✨ Planning which sessions to attend
✨ Creating your own paper list (new!)
Pls help me distribute it
Yesterday: Halloween
Today: Hallo Wien! 📊
Today: Hallo Wien! 📊
November 1, 2025 at 6:23 PM
Yesterday: Halloween
Today: Hallo Wien! 📊
Today: Hallo Wien! 📊
Reposted by Matthias Stahl
Just launched Lazy Cats, a visual exploration of cat behaviour. Meet Lily + 27 other cats and find out what they do all day (spoiler: they mostly chill) 🐱🐾 Does your cat fit their profile?
Very proud to share my first interactive #dataviz project built with Svelte + D3! 📊
lazy-cats.netlify.app
Very proud to share my first interactive #dataviz project built with Svelte + D3! 📊
lazy-cats.netlify.app
October 22, 2025 at 7:46 AM
Just launched Lazy Cats, a visual exploration of cat behaviour. Meet Lily + 27 other cats and find out what they do all day (spoiler: they mostly chill) 🐱🐾 Does your cat fit their profile?
Very proud to share my first interactive #dataviz project built with Svelte + D3! 📊
lazy-cats.netlify.app
Very proud to share my first interactive #dataviz project built with Svelte + D3! 📊
lazy-cats.netlify.app
SvelteKit: When you want to repeatedly load data, e.g. with setInterval, how would you build that?
With an invalidate() to rerun the load function of the page? Or is there another way?
With an invalidate() to rerun the load function of the page? Or is there another way?
October 26, 2025 at 8:39 PM
SvelteKit: When you want to repeatedly load data, e.g. with setInterval, how would you build that?
With an invalidate() to rerun the load function of the page? Or is there another way?
With an invalidate() to rerun the load function of the page? Or is there another way?
Reposted by Matthias Stahl
Entwickler (m/w/d) Datenvisualisierung - Ausschreibung
jobs.spiegelgruppe.de
October 14, 2025 at 6:44 PM
Reposted by Matthias Stahl

Svelte Job for data visualization wizards / creative developers. And Matthias' team is ace!
October 15, 2025 at 10:27 AM
Svelte Job for data visualization wizards / creative developers. And Matthias' team is ace!
Entwickler (m/w/d) Datenvisualisierung - Ausschreibung
jobs.spiegelgruppe.de
October 14, 2025 at 6:44 PM
Had the honor of speaking on Wednesday at the very first »Meetup for Visual Journalism and News Design« hosted at @spiegel.de.
Grateful for an enlightening evening, great conversations, and a community pushing our craft forward.
Grateful for an enlightening evening, great conversations, and a community pushing our craft forward.
October 5, 2025 at 6:48 PM
Had the honor of speaking on Wednesday at the very first »Meetup for Visual Journalism and News Design« hosted at @spiegel.de.
Grateful for an enlightening evening, great conversations, and a community pushing our craft forward.
Grateful for an enlightening evening, great conversations, and a community pushing our craft forward.
Reposted by Matthias Stahl

Good reminder - simple visualisation and regional data are great to communicate climate change.

How clear and simple data visualizations bring the climate crisis home
Climate change is a slow-moving disaster. We need graphics that capture both its pace and its impact.
thebulletin.org
October 2, 2025 at 11:50 AM
Good reminder - simple visualisation and regional data are great to communicate climate change.
Happening next week in Hamburg. Register now! 👇
The next data viz meetup Hamburg is coming up on September 18. This time we'll be talking about emotions in data visualization.
➡️ register here: www.meetup.com/data-visuali...
➡️ register here: www.meetup.com/data-visuali...

September 10, 2025 at 4:22 PM
Happening next week in Hamburg. Register now! 👇
Reposted by Matthias Stahl
The next data viz meetup Hamburg is coming up on September 18. This time we'll be talking about emotions in data visualization.
➡️ register here: www.meetup.com/data-visuali...
➡️ register here: www.meetup.com/data-visuali...
September 2, 2025 at 2:17 PM
The next data viz meetup Hamburg is coming up on September 18. This time we'll be talking about emotions in data visualization.
➡️ register here: www.meetup.com/data-visuali...
➡️ register here: www.meetup.com/data-visuali...
The next data viz meetup Hamburg is coming up on September 18. This time we'll be talking about emotions in data visualization.
➡️ register here: www.meetup.com/data-visuali...
➡️ register here: www.meetup.com/data-visuali...
September 2, 2025 at 2:17 PM
The next data viz meetup Hamburg is coming up on September 18. This time we'll be talking about emotions in data visualization.
➡️ register here: www.meetup.com/data-visuali...
➡️ register here: www.meetup.com/data-visuali...
Pizza and football night.
My family partly supports 🇸🇪 and the other half 🇩🇪. So this is going to be an exciting evening. 😀
My family partly supports 🇸🇪 and the other half 🇩🇪. So this is going to be an exciting evening. 😀
July 12, 2025 at 6:18 PM
Pizza and football night.
My family partly supports 🇸🇪 and the other half 🇩🇪. So this is going to be an exciting evening. 😀
My family partly supports 🇸🇪 and the other half 🇩🇪. So this is going to be an exciting evening. 😀
Met @geovisual.bsky.social‘s data journalism class at HAW Hamburg yesterday. Amazing projects coming soon via fink.hamburg!

July 10, 2025 at 3:57 PM
Met @geovisual.bsky.social‘s data journalism class at HAW Hamburg yesterday. Amazing projects coming soon via fink.hamburg!
Office view Hamburg. July 2025.

July 10, 2025 at 8:24 AM
Office view Hamburg. July 2025.
Reposted by Matthias Stahl

Neue Stelle bei @correctiv.org :-)

Senior-Reporter*in Lokal mit Schwerpunkt Bildung | Jobs bei Correctiv - Recherchen für die Gesellschaft gGmbH
CORRECTIV ist ein gemeinwohlorientiertes Medienhaus, das Demokratie stärkt. Als vielfach ausgezeichnete Redaktion stehen wir für investigativen Journalismus. Wir lösen öffentliche Debatten aus, arbeit...
correctiv.jobs.personio.de
July 9, 2025 at 1:30 PM
Neue Stelle bei @correctiv.org :-)
On Spiegel.de we show how the temperature reaches extreme values in Germany.

July 1, 2025 at 7:56 PM
On Spiegel.de we show how the temperature reaches extreme values in Germany.
Dream job alert! 👇
Bitte weitersagen an alle DatenjournalistInnen:
Wir suchen eine neue Kollegin (m/w/d) für die beste und tollste Redaktion der Welt!
@correctiv.org
tinyurl.com/bdzfun
Wir suchen eine neue Kollegin (m/w/d) für die beste und tollste Redaktion der Welt!
@correctiv.org
tinyurl.com/bdzfun

Datenjournalist*in | Jobs bei Correctiv - Recherchen für die Gesellschaft gGmbH
CORRECTIV ist ein gemeinwohlorientiertes Medienhaus, das Demokratie stärkt. Als vielfach ausgezeichnete Redaktion stehen wir für investigativen Journalismus. Wir lösen öffentliche Debatten aus, arbeit...
tinyurl.com
June 24, 2025 at 7:28 AM
Dream job alert! 👇
Reposted by Matthias Stahl

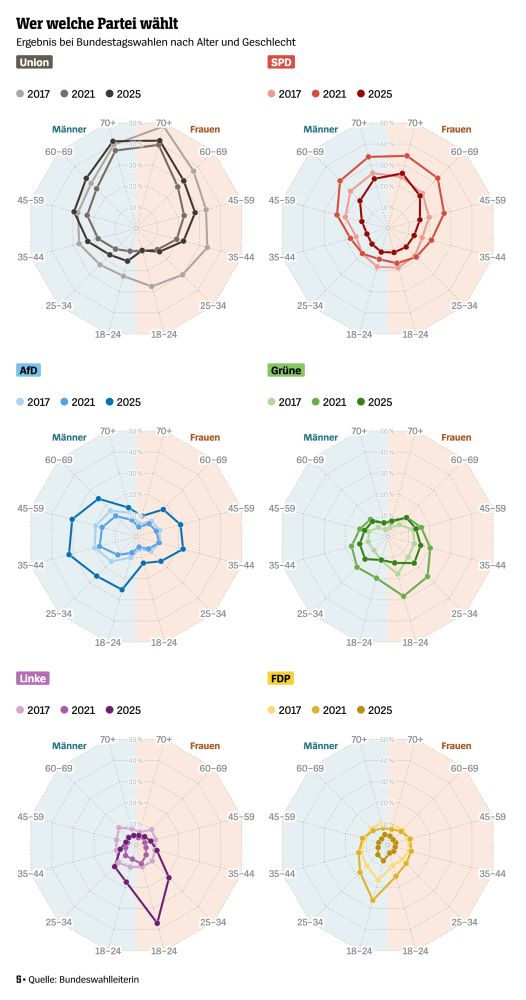
Wer wählte wen bei der #btw25? Mit den Daten der Repräsentativen Wahlstatistik habe ich diesmal etwas Neues ausprobiert: die Wählerschaft einer Partei als zweidimensionale Form in einem Radar-Chart mit Männern, Frauen, Jungen, Alten. www.spiegel.de/politik/deut...

June 23, 2025 at 3:22 PM
Wer wählte wen bei der #btw25? Mit den Daten der Repräsentativen Wahlstatistik habe ich diesmal etwas Neues ausprobiert: die Wählerschaft einer Partei als zweidimensionale Form in einem Radar-Chart mit Männern, Frauen, Jungen, Alten. www.spiegel.de/politik/deut...
Reposted by Matthias Stahl
The representative electoral statistics show how often each demographic group voted for different parties in the German federal election. This year, I’ve prepared the data as radar charts. What do you think: does this type of chart work well for this kind of data? www.spiegel.de/politik/deut...
June 23, 2025 at 4:00 PM
The representative electoral statistics show how often each demographic group voted for different parties in the German federal election. This year, I’ve prepared the data as radar charts. What do you think: does this type of chart work well for this kind of data? www.spiegel.de/politik/deut...

June 17, 2025 at 1:53 PM

June 17, 2025 at 11:57 AM
Reposted by Matthias Stahl
It's the week of the UN Ocean Conference #UNOC3.
One goal is to reinforce the target to protect 30% of the ocean and land by 2030 (30x30).
Currently, only 8.4 % of the world's oceans are designated marine protected areas.
One goal is to reinforce the target to protect 30% of the ocean and land by 2030 (30x30).
Currently, only 8.4 % of the world's oceans are designated marine protected areas.

June 10, 2025 at 7:35 AM
It's the week of the UN Ocean Conference #UNOC3.
One goal is to reinforce the target to protect 30% of the ocean and land by 2030 (30x30).
Currently, only 8.4 % of the world's oceans are designated marine protected areas.
One goal is to reinforce the target to protect 30% of the ocean and land by 2030 (30x30).
Currently, only 8.4 % of the world's oceans are designated marine protected areas.