


Gareth Roddy
@garethroddy.bsky.social
Reposted by Gareth Roddy

IEA estimate of solar offsetting shiploads of coal based on 2023 data
Since then, tech improves, and in 2026, effectiveness of clean energy shiploads is up by up to 15%
But, efficiency of a ship full of coal or gas remains static
reneweconomy.com.au/one-ship-loa... @reneweconomy.com.au
Since then, tech improves, and in 2026, effectiveness of clean energy shiploads is up by up to 15%
But, efficiency of a ship full of coal or gas remains static
reneweconomy.com.au/one-ship-loa... @reneweconomy.com.au

January 16, 2026 at 7:12 AM
IEA estimate of solar offsetting shiploads of coal based on 2023 data
Since then, tech improves, and in 2026, effectiveness of clean energy shiploads is up by up to 15%
But, efficiency of a ship full of coal or gas remains static
reneweconomy.com.au/one-ship-loa... @reneweconomy.com.au
Since then, tech improves, and in 2026, effectiveness of clean energy shiploads is up by up to 15%
But, efficiency of a ship full of coal or gas remains static
reneweconomy.com.au/one-ship-loa... @reneweconomy.com.au
Reposted by Gareth Roddy
Renewables in Australia
Aug-09: wind 2.5% renewables 10%
Aug-13: wind 5% solar 2% RE 15%
Sep-17: wind 10% solar 4% RE 20%
Sep-21: wind 12.5% solar 15% RE 35%
Nov-24: wind 13% solar 25% RE 45%
Dec-25: wind 15% solar 30% RE 50% battery 2%
www.linkedin.com/posts/raywil...
Aug-09: wind 2.5% renewables 10%
Aug-13: wind 5% solar 2% RE 15%
Sep-17: wind 10% solar 4% RE 20%
Sep-21: wind 12.5% solar 15% RE 35%
Nov-24: wind 13% solar 25% RE 45%
Dec-25: wind 15% solar 30% RE 50% battery 2%
www.linkedin.com/posts/raywil...

January 9, 2026 at 2:34 AM
Renewables in Australia
Aug-09: wind 2.5% renewables 10%
Aug-13: wind 5% solar 2% RE 15%
Sep-17: wind 10% solar 4% RE 20%
Sep-21: wind 12.5% solar 15% RE 35%
Nov-24: wind 13% solar 25% RE 45%
Dec-25: wind 15% solar 30% RE 50% battery 2%
www.linkedin.com/posts/raywil...
Aug-09: wind 2.5% renewables 10%
Aug-13: wind 5% solar 2% RE 15%
Sep-17: wind 10% solar 4% RE 20%
Sep-21: wind 12.5% solar 15% RE 35%
Nov-24: wind 13% solar 25% RE 45%
Dec-25: wind 15% solar 30% RE 50% battery 2%
www.linkedin.com/posts/raywil...

The Energy Storage Problem No One Explained Properly
YouTube video by Engineering with Rosie
www.youtube.com
January 7, 2026 at 10:42 AM
Reposted by Gareth Roddy

January comment is up! 🐳
www.hussmanfunds.com/comment/mc26...
www.hussmanfunds.com/comment/mc26...

How the Bubble Manipulates Time - Hussman Funds
The defining feature of every bubble is the same: a growing inconsistency between the long-term returns that investors expect in their heads - based on extrapolation of the past, and the long-term ret...
www.hussmanfunds.com
January 5, 2026 at 2:33 PM
January comment is up! 🐳
www.hussmanfunds.com/comment/mc26...
www.hussmanfunds.com/comment/mc26...
Reposted by Gareth Roddy

If you’re looking for some holiday reading, my new book — Clearing the Air — is on offer at £1.99 on Kindle for the next 24 hours.
Hope you enjoy!
www.amazon.co.uk/Clearing-Air...
Hope you enjoy!
www.amazon.co.uk/Clearing-Air...

December 22, 2025 at 6:22 AM
If you’re looking for some holiday reading, my new book — Clearing the Air — is on offer at £1.99 on Kindle for the next 24 hours.
Hope you enjoy!
www.amazon.co.uk/Clearing-Air...
Hope you enjoy!
www.amazon.co.uk/Clearing-Air...
Reposted by Gareth Roddy

Hoping I've gifted the article successfully so that everyone here can read it.

Opinion | Stephen King: Why I Hugged Rob Reiner After Watching ‘Stand by Me’
www.nytimes.com
December 16, 2025 at 8:45 PM
Hoping I've gifted the article successfully so that everyone here can read it.
Reposted by Gareth Roddy

*cough* If you're gift shopping for anyone interested in how the world works, do consider these. Storm in a Teacup is all about the physics of everyday life and Blue Machine is all about how the ocean works - the water itself, which is the biggest story on Earth. Share the joy of nature & science!

December 7, 2025 at 11:38 AM
*cough* If you're gift shopping for anyone interested in how the world works, do consider these. Storm in a Teacup is all about the physics of everyday life and Blue Machine is all about how the ocean works - the water itself, which is the biggest story on Earth. Share the joy of nature & science!
Reposted by Gareth Roddy

Good morning with good news: India meets 50% renewables & nuclear capacity target 5 years early!
As clean capacity deploys, clean electricity production surges.
Solar grew from 5 TWh in 2014 to 48 TWh in 2019 & 137 TWh in 2024.
Hydro was 157 TWh; wind 82 TWh; nuclear 55 TWh in 2024. #energysky
As clean capacity deploys, clean electricity production surges.
Solar grew from 5 TWh in 2014 to 48 TWh in 2019 & 137 TWh in 2024.
Hydro was 157 TWh; wind 82 TWh; nuclear 55 TWh in 2024. #energysky


November 17, 2025 at 12:27 PM
Good morning with good news: India meets 50% renewables & nuclear capacity target 5 years early!
As clean capacity deploys, clean electricity production surges.
Solar grew from 5 TWh in 2014 to 48 TWh in 2019 & 137 TWh in 2024.
Hydro was 157 TWh; wind 82 TWh; nuclear 55 TWh in 2024. #energysky
As clean capacity deploys, clean electricity production surges.
Solar grew from 5 TWh in 2014 to 48 TWh in 2019 & 137 TWh in 2024.
Hydro was 157 TWh; wind 82 TWh; nuclear 55 TWh in 2024. #energysky
Reposted by Gareth Roddy
New comment is up! 🐳😉
www.hussmanfunds.com/comment/mc25...
www.hussmanfunds.com/comment/mc25...

An Unsustainable Equilibrium - Hussman Funds
The S&P 500 stands at the most extreme level of valuations in history. This record aligns precisely with the happiest and most satisfying moment of a speculative bubble: the point where wildly misalig...
www.hussmanfunds.com
October 28, 2025 at 3:34 PM
New comment is up! 🐳😉
www.hussmanfunds.com/comment/mc25...
www.hussmanfunds.com/comment/mc25...
Reposted by Gareth Roddy

For the first time ever, renewables outpowered fossil fuels in October — supplying nearly 50% of Australia’s grid. When the sun’s up, energy is abundant & cheap. The smart move now? Incentivise demand — like 3 hrs of free electricity during high-renewable periods. #EnergyTransition #Renewables #BESS

November 11, 2025 at 7:42 AM
For the first time ever, renewables outpowered fossil fuels in October — supplying nearly 50% of Australia’s grid. When the sun’s up, energy is abundant & cheap. The smart move now? Incentivise demand — like 3 hrs of free electricity during high-renewable periods. #EnergyTransition #Renewables #BESS
Reposted by Gareth Roddy
This a big deal: "China’s carbon dioxide emissions have been flat or falling for 18 months"
China's economy has grown by ~5% in the last year, so this comprehensively debunks the idea (again) that emissions are tied to growth. So yes, faster progress needed, but this is how you turn the corner.
China's economy has grown by ~5% in the last year, so this comprehensively debunks the idea (again) that emissions are tied to growth. So yes, faster progress needed, but this is how you turn the corner.

China’s CO2 emissions have been flat or falling for past 18 months, analysis finds
World’s biggest polluter on track to hit peak emissions target early but miss goal for cutting carbon intensity
www.theguardian.com
November 11, 2025 at 9:20 AM
This a big deal: "China’s carbon dioxide emissions have been flat or falling for 18 months"
China's economy has grown by ~5% in the last year, so this comprehensively debunks the idea (again) that emissions are tied to growth. So yes, faster progress needed, but this is how you turn the corner.
China's economy has grown by ~5% in the last year, so this comprehensively debunks the idea (again) that emissions are tied to growth. So yes, faster progress needed, but this is how you turn the corner.
Reposted by Gareth Roddy
We've only just realised
It's the fastest energy transition in human history
And big move is only 10 years old
Data just minted
And clearly it's not linear
It's a rising curve
So next 10 years will be faster again
And yes, we ought have started sooner
But now it's in reach
bsky.app/profile/prof...
It's the fastest energy transition in human history
And big move is only 10 years old
Data just minted
And clearly it's not linear
It's a rising curve
So next 10 years will be faster again
And yes, we ought have started sooner
But now it's in reach
bsky.app/profile/prof...
The fastest energy transformation in human history
@fssau.futuresmart.com.au
expanded graph for pace of adoption of electricity generation by source from >100TWh annual generation threshold point
@fssau.futuresmart.com.au
expanded graph for pace of adoption of electricity generation by source from >100TWh annual generation threshold point
November 9, 2025 at 11:26 AM
We've only just realised
It's the fastest energy transition in human history
And big move is only 10 years old
Data just minted
And clearly it's not linear
It's a rising curve
So next 10 years will be faster again
And yes, we ought have started sooner
But now it's in reach
bsky.app/profile/prof...
It's the fastest energy transition in human history
And big move is only 10 years old
Data just minted
And clearly it's not linear
It's a rising curve
So next 10 years will be faster again
And yes, we ought have started sooner
But now it's in reach
bsky.app/profile/prof...
Reposted by Gareth Roddy

We often forget how far we have come: Today almost 3/4 of EU electricity generation is from non-fossil energy sources.
It is not long ago that fossil fuels dominated the EU's electricity mix.
This year their share is approaching 1/4 of EU electricity generation.
Source is @ember-energy.org
It is not long ago that fossil fuels dominated the EU's electricity mix.
This year their share is approaching 1/4 of EU electricity generation.
Source is @ember-energy.org

November 7, 2025 at 2:19 PM
We often forget how far we have come: Today almost 3/4 of EU electricity generation is from non-fossil energy sources.
It is not long ago that fossil fuels dominated the EU's electricity mix.
This year their share is approaching 1/4 of EU electricity generation.
Source is @ember-energy.org
It is not long ago that fossil fuels dominated the EU's electricity mix.
This year their share is approaching 1/4 of EU electricity generation.
Source is @ember-energy.org
Reposted by Gareth Roddy
“People don’t want energy; they want hot showers and cold beer.” This is what Amory Lovins once said and so true.
Most primary energy we use is wasted in converting heat to work. We don’t have to replace all primary energy - we only need to deliver the energy services more efficiently.
Most primary energy we use is wasted in converting heat to work. We don’t have to replace all primary energy - we only need to deliver the energy services more efficiently.

November 7, 2025 at 8:57 AM
“People don’t want energy; they want hot showers and cold beer.” This is what Amory Lovins once said and so true.
Most primary energy we use is wasted in converting heat to work. We don’t have to replace all primary energy - we only need to deliver the energy services more efficiently.
Most primary energy we use is wasted in converting heat to work. We don’t have to replace all primary energy - we only need to deliver the energy services more efficiently.
Reposted by Gareth Roddy
Better to farm solar for energy
than to farm crops to use for biofuels
1ha solar array ~600kW
1000-1500 MWh/year (varies with location)
>100x more energy than
1ha planted crop for biofuels
- Soybean: ~8.3 MWh/yr
(updated graphic with revised numbers including corn and sugar cane)
than to farm crops to use for biofuels
1ha solar array ~600kW
1000-1500 MWh/year (varies with location)
>100x more energy than
1ha planted crop for biofuels
- Soybean: ~8.3 MWh/yr
(updated graphic with revised numbers including corn and sugar cane)

November 7, 2025 at 4:04 AM
Better to farm solar for energy
than to farm crops to use for biofuels
1ha solar array ~600kW
1000-1500 MWh/year (varies with location)
>100x more energy than
1ha planted crop for biofuels
- Soybean: ~8.3 MWh/yr
(updated graphic with revised numbers including corn and sugar cane)
than to farm crops to use for biofuels
1ha solar array ~600kW
1000-1500 MWh/year (varies with location)
>100x more energy than
1ha planted crop for biofuels
- Soybean: ~8.3 MWh/yr
(updated graphic with revised numbers including corn and sugar cane)
Reposted by Gareth Roddy
US fossil fuel generation continues to lose market share in 2025.
Fossil fuels fell to ~50% for a couple months in 2025.
After recently being more than 60% of US electricity, fossil fuels will fall to ~55% for all of 2025.
Why?
Surging solar and wind generation! #energysky
Fossil fuels fell to ~50% for a couple months in 2025.
After recently being more than 60% of US electricity, fossil fuels will fall to ~55% for all of 2025.
Why?
Surging solar and wind generation! #energysky

October 29, 2025 at 1:24 PM
US fossil fuel generation continues to lose market share in 2025.
Fossil fuels fell to ~50% for a couple months in 2025.
After recently being more than 60% of US electricity, fossil fuels will fall to ~55% for all of 2025.
Why?
Surging solar and wind generation! #energysky
Fossil fuels fell to ~50% for a couple months in 2025.
After recently being more than 60% of US electricity, fossil fuels will fall to ~55% for all of 2025.
Why?
Surging solar and wind generation! #energysky
Reposted by Gareth Roddy

The ability of demagogues & autocrats to surprise, to create a new scandal every day, is their superpower. It diminishes attention to the previous day's transgressions & normalizes them. It slowly numbs the senses, including outrage. Values are the only defense. Hold them dear. — Garry Kasparov
October 24, 2025 at 2:47 PM
The ability of demagogues & autocrats to surprise, to create a new scandal every day, is their superpower. It diminishes attention to the previous day's transgressions & normalizes them. It slowly numbs the senses, including outrage. Values are the only defense. Hold them dear. — Garry Kasparov
Reposted by Gareth Roddy
Good morning with good news: Wind will globally add 139-155 GW, with land wind at record 124 GW in 2025!
IEA forecasts offshore wind will add 140 GW by 2030, with additions growing from 9.2 GW in 2024 to over 37 GW by 2030.
Wind is strong!
iea.blob.core.windows.net/assets/76ad6... #energysky
IEA forecasts offshore wind will add 140 GW by 2030, with additions growing from 9.2 GW in 2024 to over 37 GW by 2030.
Wind is strong!
iea.blob.core.windows.net/assets/76ad6... #energysky

October 24, 2025 at 12:01 PM
Good morning with good news: Wind will globally add 139-155 GW, with land wind at record 124 GW in 2025!
IEA forecasts offshore wind will add 140 GW by 2030, with additions growing from 9.2 GW in 2024 to over 37 GW by 2030.
Wind is strong!
iea.blob.core.windows.net/assets/76ad6... #energysky
IEA forecasts offshore wind will add 140 GW by 2030, with additions growing from 9.2 GW in 2024 to over 37 GW by 2030.
Wind is strong!
iea.blob.core.windows.net/assets/76ad6... #energysky
Reposted by Gareth Roddy

10% - 80% within ten minutes…
Why would Porsche be in trouble in China?!
The new normal?
#7X
⚡️⚡️⚡️
#alwaysbecharging
Why would Porsche be in trouble in China?!
The new normal?
#7X
⚡️⚡️⚡️
#alwaysbecharging

Refreshed #Zeekr 7X Charging Test: 9 min 37 sec charge adds 562 km of range.
October 24, 2025 at 12:57 PM
10% - 80% within ten minutes…
Why would Porsche be in trouble in China?!
The new normal?
#7X
⚡️⚡️⚡️
#alwaysbecharging
Why would Porsche be in trouble in China?!
The new normal?
#7X
⚡️⚡️⚡️
#alwaysbecharging

Reposted by Gareth Roddy
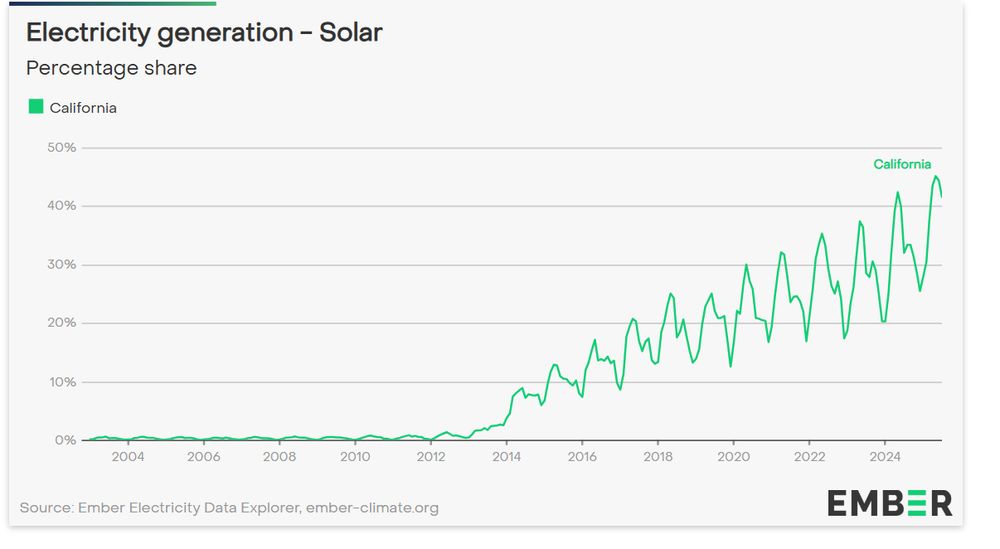
Solar generated more than 40% of California's electricity from April to July 2025!
2025 Solar
July 41.6%
June 44.4%
May 45.1%
April 43.5%
2024 Solar
July 32%
June 39%
May 42%
April 39%
2019 Solar
July 22%
June 25%
May 24%
April 23%
CA is world's 4th largest economy.
#energysky
2025 Solar
July 41.6%
June 44.4%
May 45.1%
April 43.5%
2024 Solar
July 32%
June 39%
May 42%
April 39%
2019 Solar
July 22%
June 25%
May 24%
April 23%
CA is world's 4th largest economy.
#energysky
October 16, 2025 at 12:15 PM
Solar generated more than 40% of California's electricity from April to July 2025!
2025 Solar
July 41.6%
June 44.4%
May 45.1%
April 43.5%
2024 Solar
July 32%
June 39%
May 42%
April 39%
2019 Solar
July 22%
June 25%
May 24%
April 23%
CA is world's 4th largest economy.
#energysky
2025 Solar
July 41.6%
June 44.4%
May 45.1%
April 43.5%
2024 Solar
July 32%
June 39%
May 42%
April 39%
2019 Solar
July 22%
June 25%
May 24%
April 23%
CA is world's 4th largest economy.
#energysky
Reposted by Gareth Roddy
Global EV sales hit a record 2.1 M in Sept 2025 — first time ever crossing 2 M in a single month! YTD: China 9.0 M (+24%), Europe 3.0 M (+32%), N. America 1.5 M (+11%), RoW 1.2 M (+48%) = 14.7 M (+26%). The electric transition keeps surging despite anti-clean-tech rhetoric from the White House. #EVs

October 16, 2025 at 2:11 AM
Global EV sales hit a record 2.1 M in Sept 2025 — first time ever crossing 2 M in a single month! YTD: China 9.0 M (+24%), Europe 3.0 M (+32%), N. America 1.5 M (+11%), RoW 1.2 M (+48%) = 14.7 M (+26%). The electric transition keeps surging despite anti-clean-tech rhetoric from the White House. #EVs
Reposted by Gareth Roddy

🌞Total land required to replace coal fired energy
🌞Example assumes all solar:120,000 hectares
🌞 That’s less than 0.016 percent of Australia’s total land currently used for agriculture
🌞 Australian agriculture currently accounts for 58% of our land use
🌞And agrisolar = panels + grass/sheep etc
🌞Example assumes all solar:120,000 hectares
🌞 That’s less than 0.016 percent of Australia’s total land currently used for agriculture
🌞 Australian agriculture currently accounts for 58% of our land use
🌞And agrisolar = panels + grass/sheep etc

October 11, 2025 at 8:36 AM
🌞Total land required to replace coal fired energy
🌞Example assumes all solar:120,000 hectares
🌞 That’s less than 0.016 percent of Australia’s total land currently used for agriculture
🌞 Australian agriculture currently accounts for 58% of our land use
🌞And agrisolar = panels + grass/sheep etc
🌞Example assumes all solar:120,000 hectares
🌞 That’s less than 0.016 percent of Australia’s total land currently used for agriculture
🌞 Australian agriculture currently accounts for 58% of our land use
🌞And agrisolar = panels + grass/sheep etc
Reposted by Gareth Roddy

Cool stats
Better to farm solar for energy
than to farm crops to use for biofuels
Far better
1 hectare annual yield:
2t soy bean
➡️ 800 litres biodiesel ➡️ 8.29 MWh
70t sugar cane
➡️ 7000 litres ethanol ➡️ 57.5 MWh
600 kW solar
➡️ ➡️ 900 MWh (low estimate)
than to farm crops to use for biofuels
Far better
1 hectare annual yield:
2t soy bean
➡️ 800 litres biodiesel ➡️ 8.29 MWh
70t sugar cane
➡️ 7000 litres ethanol ➡️ 57.5 MWh
600 kW solar
➡️ ➡️ 900 MWh (low estimate)

October 12, 2025 at 7:21 PM
Cool stats
Reposted by Gareth Roddy
🚢☀️ One shipload of solar panels = the electricity of 100 shiploads of coal. LNG? ~30. Fossil fuels are bulky, burned once & gone. Solar is front-loaded, then delivers clean power for decades. The math is brutal: renewables crush fossils on energy density & durability. #Solar #EV #BESS #Lithium

October 1, 2025 at 11:52 AM