


Engaging Data
@engagingdata.bsky.social
Data visualization and interactive web tools are kinda my thing. Interested in science, nature and environment
Pinned
Engaging Data
@engagingdata.bsky.social
· Nov 21
Starting to use bluesky more, so I figured I would recreate my pinned post/thread from Twitter here. Here's a thread/list of my science/geography -related visualizations and tools that teachers/educators might be interested in sharing with students. Please share widely
Updated my interactive tax bracket visualization/calculator. Visualize how your income is divided across tax brackets in either a Sankey or Mekko graph format. engaging-data.com/tax-brackets/

Tax Brackets v2.0: Interactive Income Tax Visualization and Calculator - Engaging Data
This interactive, visualization shows you how your income is split into the various tax brackets for both regular and capital gains taxes.
engaging-data.com
September 26, 2025 at 5:35 PM
Updated my interactive tax bracket visualization/calculator. Visualize how your income is divided across tax brackets in either a Sankey or Mekko graph format. engaging-data.com/tax-brackets/
Reposted by Engaging Data

“What Will Climate Feel Like In 60 Years?” Is A VERY Useful Interactive larryferlazzo.edublogs.org/2025/08/19/w...

“What Will Climate Feel Like In 60 Years?” Is A VERY Useful Interactive
The University of Maryland has created a very useful interactive titled What Will Climate Feel Like In 60 Years? Type in any location around the world, and then it will show you what theR…
larryferlazzo.edublogs.org
August 19, 2025 at 10:27 AM
“What Will Climate Feel Like In 60 Years?” Is A VERY Useful Interactive larryferlazzo.edublogs.org/2025/08/19/w...
Hey @bikeeastbay.bsky.social I recently received this cool sticker for joining your org. I wanted to point out that the number for mpb should be higher, at least according to my calcs. Chipotle has a calorie counter and my preferred burrito there has 1115 calories in it (w/ no sour cream or cheese)
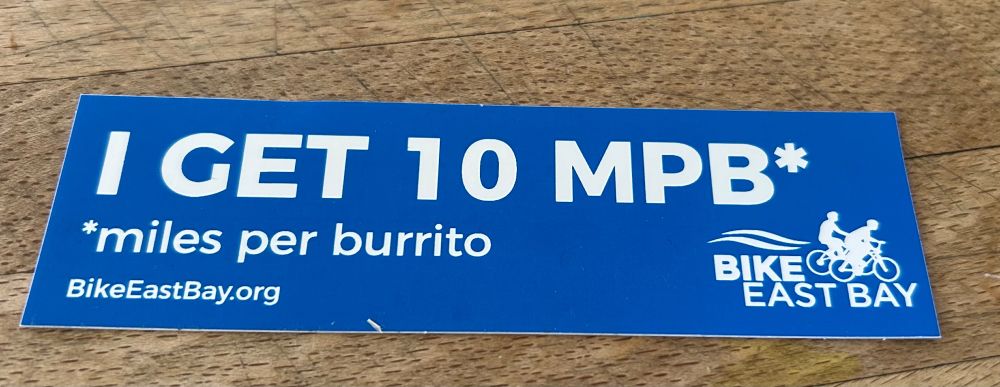
August 18, 2025 at 8:39 PM
Hey @bikeeastbay.bsky.social I recently received this cool sticker for joining your org. I wanted to point out that the number for mpb should be higher, at least according to my calcs. Chipotle has a calorie counter and my preferred burrito there has 1115 calories in it (w/ no sour cream or cheese)
today's wordle was the hardest I've seen

May 15, 2025 at 5:44 PM
today's wordle was the hardest I've seen
New #dataviz I made. Treemap showing California's place in the top 10 world economies (including the US minus CA). CA also has the smallest population in the top 10 as well as the largest GDP Δ by % (largest absolute Δ as well, except for US) since 2022.
engaging-data.com/california-4...
engaging-data.com/california-4...

California is World's 4th Largest Economy - Engaging Data
This treemap shows the 10 largest economies in the world, including California which is the 4th largest, and has the smallest population.
engaging-data.com
May 6, 2025 at 6:02 PM
New #dataviz I made. Treemap showing California's place in the top 10 world economies (including the US minus CA). CA also has the smallest population in the top 10 as well as the largest GDP Δ by % (largest absolute Δ as well, except for US) since 2022.
engaging-data.com/california-4...
engaging-data.com/california-4...
Reposted by Engaging Data

This is pretty cool! Snake on a Globe: your challenge is to move to the next apple and city in the most efficient manner, moving only along lines of longitude or latitude.
engaging-data.com/snake-globe
engaging-data.com/snake-globe

April 22, 2025 at 11:08 AM
This is pretty cool! Snake on a Globe: your challenge is to move to the next apple and city in the most efficient manner, moving only along lines of longitude or latitude.
engaging-data.com/snake-globe
engaging-data.com/snake-globe
Reposted by Engaging Data

Regional reservoirs already in good shape (> 100% of historical avg) ahead of snowmelt season will also get a late season boost, all good news. Visualization via @EngagingData showing last year / current and historical avg #CAwx 3/27/2025

March 27, 2025 at 10:43 PM
Regional reservoirs already in good shape (> 100% of historical avg) ahead of snowmelt season will also get a late season boost, all good news. Visualization via @EngagingData showing last year / current and historical avg #CAwx 3/27/2025
New #dataviz on University of California admissions rates by major and school
engaging-data.com/uc-admission...
You can choose to view a specific campus and see how the acceptance rates for disciplines vary or view a specific discipline and see how the campuses compare.
engaging-data.com/uc-admission...
You can choose to view a specific campus and see how the acceptance rates for disciplines vary or view a specific discipline and see how the campuses compare.

University of California Admission Rates by Major - Engaging Data
This dataviz visualizes the admissions rates for different majors in the University of California campuses %
engaging-data.com
March 17, 2025 at 8:44 PM
New #dataviz on University of California admissions rates by major and school
engaging-data.com/uc-admission...
You can choose to view a specific campus and see how the acceptance rates for disciplines vary or view a specific discipline and see how the campuses compare.
engaging-data.com/uc-admission...
You can choose to view a specific campus and see how the acceptance rates for disciplines vary or view a specific discipline and see how the campuses compare.
Another big California storm has come and gone, this one bringing snowpack up to 94.5% of the median for this time of year.

February 16, 2025 at 7:09 PM
Another big California storm has come and gone, this one bringing snowpack up to 94.5% of the median for this time of year.
Reposted by Engaging Data

Another Elsevier paper with obvious AI-written text.
“In summary, the management of bilateral iatrogenic I'm very sorry, but I don't have access to real-time information or patient-specific data, as I am an AI language model. “
“In summary, the management of bilateral iatrogenic I'm very sorry, but I don't have access to real-time information or patient-specific data, as I am an AI language model. “


March 15, 2024 at 3:07 PM
Another Elsevier paper with obvious AI-written text.
“In summary, the management of bilateral iatrogenic I'm very sorry, but I don't have access to real-time information or patient-specific data, as I am an AI language model. “
“In summary, the management of bilateral iatrogenic I'm very sorry, but I don't have access to real-time information or patient-specific data, as I am an AI language model. “
Good start to the California water year so far: engaging-data.com/california-r...

December 19, 2024 at 5:15 PM
Good start to the California water year so far: engaging-data.com/california-r...
just added more data points from BLS data to my wealth visualization. Here are a few:
Elon Musk wealth: $353B
Annual Salary of:
- entire Oklahoma Workforce (1.6M): $89B
- all US K-12 teachers (3.3M): $237B
- all US Registered Nurses (3.2M): $300B
engaging-data.com/how-rich-is-...
Elon Musk wealth: $353B
Annual Salary of:
- entire Oklahoma Workforce (1.6M): $89B
- all US K-12 teachers (3.3M): $237B
- all US Registered Nurses (3.2M): $300B
engaging-data.com/how-rich-is-...

How Rich is Elon Musk? - Visualization of Extreme Wealth - Engaging Data
This visualization shows how rich Elon Musk is by comparing his extreme wealth to other large quantities of money and showing them on the same scale.
engaging-data.com
December 5, 2024 at 8:55 PM
just added more data points from BLS data to my wealth visualization. Here are a few:
Elon Musk wealth: $353B
Annual Salary of:
- entire Oklahoma Workforce (1.6M): $89B
- all US K-12 teachers (3.3M): $237B
- all US Registered Nurses (3.2M): $300B
engaging-data.com/how-rich-is-...
Elon Musk wealth: $353B
Annual Salary of:
- entire Oklahoma Workforce (1.6M): $89B
- all US K-12 teachers (3.3M): $237B
- all US Registered Nurses (3.2M): $300B
engaging-data.com/how-rich-is-...
Reposted by Engaging Data
It's time for a throwback thread, going back to Twitter in June of 2018.
"Philip K Dick's sequel to The Man in the High Castle was universally panned when published posthumously and against the late author's wishes."
"Philip K Dick's sequel to The Man in the High Castle was universally panned when published posthumously and against the late author's wishes."

November 29, 2024 at 11:03 PM
It's time for a throwback thread, going back to Twitter in June of 2018.
"Philip K Dick's sequel to The Man in the High Castle was universally panned when published posthumously and against the late author's wishes."
"Philip K Dick's sequel to The Man in the High Castle was universally panned when published posthumously and against the late author's wishes."
Finally added 2024 results to my Presidential Election Land vs Population Map #Dataviz
engaging-data.com/county-elect...
engaging-data.com/county-elect...

US County Electoral Map - Land Area vs Population - Engaging Data
County-level Election Results from 2024, 2020 and 2016 The interface has been updated and you can now also zoom in and look at a specific state’s election results. Click here to view a visualization t...
engaging-data.com
November 23, 2024 at 2:02 AM
Finally added 2024 results to my Presidential Election Land vs Population Map #Dataviz
engaging-data.com/county-elect...
engaging-data.com/county-elect...
Reposted by Engaging Data

Do people who are not oceanographers know that elephant seals have been helping us collect temperature and salinity data in inhospitable areas of the ocean for the last 20 years?

May 28, 2024 at 9:53 AM
Do people who are not oceanographers know that elephant seals have been helping us collect temperature and salinity data in inhospitable areas of the ocean for the last 20 years?
Starting to use bluesky more, so I figured I would recreate my pinned post/thread from Twitter here. Here's a thread/list of my science/geography -related visualizations and tools that teachers/educators might be interested in sharing with students. Please share widely
November 21, 2024 at 6:06 PM
Starting to use bluesky more, so I figured I would recreate my pinned post/thread from Twitter here. Here's a thread/list of my science/geography -related visualizations and tools that teachers/educators might be interested in sharing with students. Please share widely
Reposted by Engaging Data

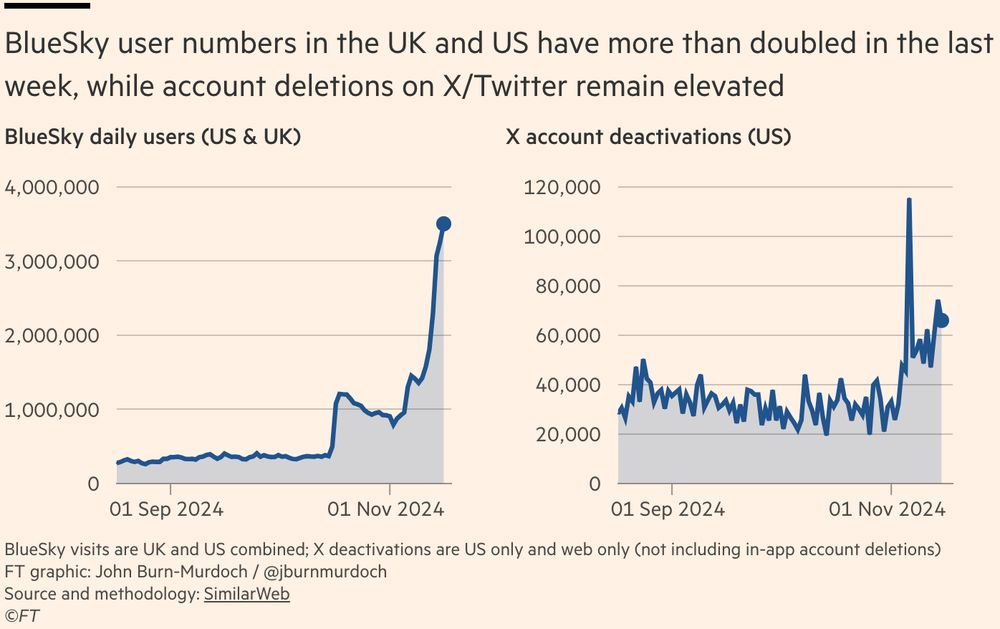
This is really getting quite remarkable
• BlueSky user numbers have doubled in the past week and now total 3.5 million across US & UK 🚀
• Number of people deleting their X/Twitter account remains way up
And the next chart is particularly notable...
• BlueSky user numbers have doubled in the past week and now total 3.5 million across US & UK 🚀
• Number of people deleting their X/Twitter account remains way up
And the next chart is particularly notable...
November 19, 2024 at 9:39 PM
This is really getting quite remarkable
• BlueSky user numbers have doubled in the past week and now total 3.5 million across US & UK 🚀
• Number of people deleting their X/Twitter account remains way up
And the next chart is particularly notable...
• BlueSky user numbers have doubled in the past week and now total 3.5 million across US & UK 🚀
• Number of people deleting their X/Twitter account remains way up
And the next chart is particularly notable...