


Kevin Griffith
@assumenormality.bsky.social
Assistant Professor of Health Policy at Vanderbilt w/ expertise in access to care, Medicaid, Veterans' health. Formerly Boston University, Department of Defense, US Army (CIV). Views are my own. #HealthEconomics #PublicHealth
Pinned


🚨The 21st Century Cures Act required patients to be notified of new test results immediately when ready
We showed the proportion of patients who:
1) Messaged their providers increased 4.5%
2) Made new appointments increased 2.1%
pmc.ncbi.nlm.nih.gov/articles/PMC...
We showed the proportion of patients who:
1) Messaged their providers increased 4.5%
2) Made new appointments increased 2.1%
pmc.ncbi.nlm.nih.gov/articles/PMC...
Reposted by Kevin Griffith

30 is the new 40?
Not how the saying is supposed to go, but that is an apt description of America's #population #health challenges.
The share of working age adults from the 1971-1975 birth cohort reporting excellent health at age 30 = share from 1991-1995 cohort reporting same at age 40.
Not how the saying is supposed to go, but that is an apt description of America's #population #health challenges.
The share of working age adults from the 1971-1975 birth cohort reporting excellent health at age 30 = share from 1991-1995 cohort reporting same at age 40.

November 12, 2025 at 4:45 PM
30 is the new 40?
Not how the saying is supposed to go, but that is an apt description of America's #population #health challenges.
The share of working age adults from the 1971-1975 birth cohort reporting excellent health at age 30 = share from 1991-1995 cohort reporting same at age 40.
Not how the saying is supposed to go, but that is an apt description of America's #population #health challenges.
The share of working age adults from the 1971-1975 birth cohort reporting excellent health at age 30 = share from 1991-1995 cohort reporting same at age 40.
Ok this made me literally lol
But in truth VA outperforms private sector in terms of wait times
jamanetwork.com/journals/jam...
But in truth VA outperforms private sector in terms of wait times
jamanetwork.com/journals/jam...

VA To Improve Veterans’ Health Care With New $500 Million Waiting Room https://theonion.com/va-to-improve-veterans-health-care-with-new-500-milli-1819576535/

November 12, 2025 at 1:39 AM
Ok this made me literally lol
But in truth VA outperforms private sector in terms of wait times
jamanetwork.com/journals/jam...
But in truth VA outperforms private sector in terms of wait times
jamanetwork.com/journals/jam...
Does anyone have a copy of the NSDUH State Prevalence Table for 2019-2020?
November 5, 2025 at 9:23 PM
Does anyone have a copy of the NSDUH State Prevalence Table for 2019-2020?
Raccoon jackpot

November 3, 2025 at 6:42 PM
Raccoon jackpot
Reposted by Kevin Griffith

This graph never fails to be shocking: "The US has experienced the earliest and greatest slowdown in life expectancy improvements among higher-income countries, reported Eileen Crimmins. “We have horrible life expectancy—and it’s getting worse and worse”"
www.prb.org/resources/se...
www.prb.org/resources/se...

October 31, 2025 at 7:08 PM
This graph never fails to be shocking: "The US has experienced the earliest and greatest slowdown in life expectancy improvements among higher-income countries, reported Eileen Crimmins. “We have horrible life expectancy—and it’s getting worse and worse”"
www.prb.org/resources/se...
www.prb.org/resources/se...
Reposted by Kevin Griffith

Once upon a time, @hollygodarkly.wandering.shop.ap.brid.gy & I did a podcast about a ten-novel epic series where -- I am not kidding -- "dying of the weather on top of Mount Washington" was plan B in case the initial murder attempt didn't work. Nerds know not to go on that mountain unprepared.
If this ever happens to me, let me die and then lie about how it happened to save my ghost the embarrassment
abcnews.go.com/US/mount-was...
abcnews.go.com/US/mount-was...

Over 20 'ill-prepared' hikers, some with hypothermia, rescued from snowy Mount Washington: Officials
Over 20 "ill-prepared" hikers were rescued from New Hampshire's Mount Washington after they were trapped in snowy conditions without proper gear, officials said.
abcnews.go.com
October 29, 2025 at 12:08 AM
Once upon a time, @hollygodarkly.wandering.shop.ap.brid.gy & I did a podcast about a ten-novel epic series where -- I am not kidding -- "dying of the weather on top of Mount Washington" was plan B in case the initial murder attempt didn't work. Nerds know not to go on that mountain unprepared.
If this ever happens to me, let me die and then lie about how it happened to save my ghost the embarrassment
abcnews.go.com/US/mount-was...
abcnews.go.com/US/mount-was...
Over 20 'ill-prepared' hikers, some with hypothermia, rescued from snowy Mount Washington: Officials
Over 20 "ill-prepared" hikers were rescued from New Hampshire's Mount Washington after they were trapped in snowy conditions without proper gear, officials said.
abcnews.go.com
October 28, 2025 at 11:54 PM
If this ever happens to me, let me die and then lie about how it happened to save my ghost the embarrassment
abcnews.go.com/US/mount-was...
abcnews.go.com/US/mount-was...
October 19, 2025 at 3:19 AM
Reposted by Kevin Griffith

The ACA did lead to increased individual health insurance premiums in 2014. That was because insurance before that generally didn’t cover pre-existing conditions or benefits like maternity care, and it had lifetime and annual limits on how much it would pay.
October 13, 2025 at 2:18 PM
The ACA did lead to increased individual health insurance premiums in 2014. That was because insurance before that generally didn’t cover pre-existing conditions or benefits like maternity care, and it had lifetime and annual limits on how much it would pay.
Reposted by Kevin Griffith

This is the most accurate depiction of the Midwest to date. Wichita has always felt like the last Midwest city while also being the first plains city.

October 7, 2025 at 3:08 PM
This is the most accurate depiction of the Midwest to date. Wichita has always felt like the last Midwest city while also being the first plains city.
I'm having an incredibly hard time publishing a paper, and I can't help but think it's because it upsets the political opinions of medical researchers.
The level of methodological nitpicking exceeds anything I've encountered previously.
The level of methodological nitpicking exceeds anything I've encountered previously.
October 7, 2025 at 9:25 PM
I'm having an incredibly hard time publishing a paper, and I can't help but think it's because it upsets the political opinions of medical researchers.
The level of methodological nitpicking exceeds anything I've encountered previously.
The level of methodological nitpicking exceeds anything I've encountered previously.
Reposted by Kevin Griffith

We just spent 6 months to add 1 figure to this paper. Some people said, "Couples aren't prioritizing men's careers. Men just have better earnings opportunities when moving."
Earnings effects of moves for couples on the left, singles on the right. Negligible gap between single men and women.
Earnings effects of moves for couples on the left, singles on the right. Negligible gap between single men and women.

October 7, 2025 at 3:36 PM
We just spent 6 months to add 1 figure to this paper. Some people said, "Couples aren't prioritizing men's careers. Men just have better earnings opportunities when moving."
Earnings effects of moves for couples on the left, singles on the right. Negligible gap between single men and women.
Earnings effects of moves for couples on the left, singles on the right. Negligible gap between single men and women.
Approximately .05% of U.S. CO2 emissions per year. Is JAMA just publishing work showing medical care has environmental costs now? Were medical reviewers even equipped to assess their methods?
jamanetwork.com/journals/jam...
jamanetwork.com/journals/jam...
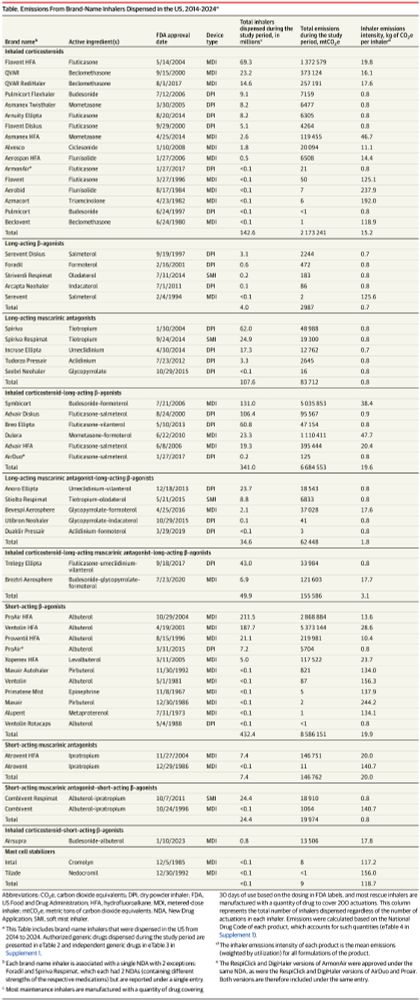
Inhaler-Related Greenhouse Gas Emissions in the US
This cross-sectional study estimates greenhouse gas emissions from all inhalers approved for asthma or chronic obstructive pulmonary disease (COPD) using aggregated dispensing data across the US outpa...
jamanetwork.com
October 7, 2025 at 1:39 PM
Approximately .05% of U.S. CO2 emissions per year. Is JAMA just publishing work showing medical care has environmental costs now? Were medical reviewers even equipped to assess their methods?
jamanetwork.com/journals/jam...
jamanetwork.com/journals/jam...
So much for the Hatch Act

October 2, 2025 at 11:05 PM
So much for the Hatch Act
So much for the Hatch Act

October 2, 2025 at 4:31 PM
So much for the Hatch Act

Laughing and crying as I write that I only spend 5% effort on research administration on my annual faculty effort disclosure
September 30, 2025 at 6:13 PM
Laughing and crying as I write that I only spend 5% effort on research administration on my annual faculty effort disclosure
Reposted by Kevin Griffith

🧵

Science can be such a headache sometimes.
This study has hit the headlines because the authors claim that it shows that soft drinks cause people to be depressed by negatively impacting their gut microbiome.
Several BIG issues with this 1/n
This study has hit the headlines because the authors claim that it shows that soft drinks cause people to be depressed by negatively impacting their gut microbiome.
Several BIG issues with this 1/n

September 26, 2025 at 2:40 AM
🧵
I think that, as a field, we have fundamentally failed to teach our people (students, MDs, PhDs) to recognize the difference between (a) a confounder and (b) anything remotely associated with the outcome of interest
Evidence: Any referee report I've received
Evidence: Any referee report I've received
September 21, 2025 at 10:33 PM
I think that, as a field, we have fundamentally failed to teach our people (students, MDs, PhDs) to recognize the difference between (a) a confounder and (b) anything remotely associated with the outcome of interest
Evidence: Any referee report I've received
Evidence: Any referee report I've received
Reposted by Kevin Griffith

Launch day 🚀
We’ve just released @chartlecc.bsky.social - a daily chart game!
Your job is to guess which country is represented by the red line in today's chart. You get 5 tries, no other clues!
Play today, come back tomorrow for a different chart with new data and share with your chart friends 📈
We’ve just released @chartlecc.bsky.social - a daily chart game!
Your job is to guess which country is represented by the red line in today's chart. You get 5 tries, no other clues!
Play today, come back tomorrow for a different chart with new data and share with your chart friends 📈

Chartle - A daily chart game
Guess the country in red by analysing today's chart
chartle.cc
September 12, 2025 at 1:41 PM
Launch day 🚀
We’ve just released @chartlecc.bsky.social - a daily chart game!
Your job is to guess which country is represented by the red line in today's chart. You get 5 tries, no other clues!
Play today, come back tomorrow for a different chart with new data and share with your chart friends 📈
We’ve just released @chartlecc.bsky.social - a daily chart game!
Your job is to guess which country is represented by the red line in today's chart. You get 5 tries, no other clues!
Play today, come back tomorrow for a different chart with new data and share with your chart friends 📈
Reposted by Kevin Griffith

![< CUT OUT I NEAR YOUR COMPUTER OR TVI BREAKING NEWS CONSUMER'S HANDBOOK 1. In the immediate aftermath, news outlets will get it wrong. 2. Don't trust anonymous sources. 3. Don't trust stories that cite another news outlet as the source of the information. 4. There's almost never a second shooter. 5. Pay attention to the language the media uses. • "We are getting reports"... could mean anything. • "We are seeking confirmation"... means they don't have it. • "[News outlet] has learned"... means it has a scoop or is going out on limb. 6. Look for news outlets close to the incident. 7. Compare multiple sources. 8. Big news brings out the fakers. And photoshoppers. 9. Beware reflexive retweeting. Some of this is on you.
ONTHEMEDIA.ORG
ON THE MEDIA](https://cdn.bsky.app/img/feed_thumbnail/plain/did:plc:7migibs2fyj2psyy6lmkul3h/bafkreihh3gjansbbjxkcto4kiiaiokobakzi465jes4exdhe6uua7oipn4@jpeg)
Reposted by Kevin Griffith

The core inflation rate increased for the fourth straight month. Annual rates:
1 month: 4.2%
3 months: 3.6%
6 months: 2.7%
12 months: 3.1%
1 month: 4.2%
3 months: 3.6%
6 months: 2.7%
12 months: 3.1%

September 11, 2025 at 3:14 PM
The core inflation rate increased for the fourth straight month. Annual rates:
1 month: 4.2%
3 months: 3.6%
6 months: 2.7%
12 months: 3.1%
1 month: 4.2%
3 months: 3.6%
6 months: 2.7%
12 months: 3.1%

Reposted by Kevin Griffith
Do your mental health a favor and turn this on for today. You really don't want to watch this. It is awful.

settings > content & media > autoplay video & gifs = off
September 10, 2025 at 7:05 PM
Do your mental health a favor and turn this on for today. You really don't want to watch this. It is awful.