


@alberto-pablo.bsky.social
Reposted

This paper on causal inference with statistical models is very interesting and is probably more actionable than most causal inference papers: www.tandfonline.com/doi/full/10.... #Statistics #StatsSky #EpiSky

Prediction can be safely used as a proxy for explanation in causally consistent Bayesian generalized linear models
Bayesian modeling provides a principled approach to quantifying uncertainty and has seen a surge of applications in recent years. Within the context of a Bayesian workflow, we are concerned with mo...
www.tandfonline.com
May 21, 2025 at 11:13 AM
This paper on causal inference with statistical models is very interesting and is probably more actionable than most causal inference papers: www.tandfonline.com/doi/full/10.... #Statistics #StatsSky #EpiSky
Reposted

Creating publication-ready plots in R is easier than ever with ggpubr. This extension for ggplot2 simplifies the process of generating clean and professional graphics.
The attached visual, which I created using ggpubr, demonstrates its versatility.
statisticsglobe.com/online-cours...
#rstats
The attached visual, which I created using ggpubr, demonstrates its versatility.
statisticsglobe.com/online-cours...
#rstats

May 6, 2025 at 6:41 AM
Creating publication-ready plots in R is easier than ever with ggpubr. This extension for ggplot2 simplifies the process of generating clean and professional graphics.
The attached visual, which I created using ggpubr, demonstrates its versatility.
statisticsglobe.com/online-cours...
#rstats
The attached visual, which I created using ggpubr, demonstrates its versatility.
statisticsglobe.com/online-cours...
#rstats
Reposted

"La vida es una tormenta, mi joven amigo. Disfrutarás de la luz del sol en un momento, serás destrozado en las rocas al siguiente. Lo que te hace un hombre es lo que haces cuando llega la tormenta".
Alejandro Dumas
Alejandro Dumas

April 3, 2025 at 10:42 AM
"La vida es una tormenta, mi joven amigo. Disfrutarás de la luz del sol en un momento, serás destrozado en las rocas al siguiente. Lo que te hace un hombre es lo que haces cuando llega la tormenta".
Alejandro Dumas
Alejandro Dumas
Reposted

A new experimental #rstats package #rdocdump saves all package source code, docs and vignettes in plain text file or a string. Very useful for feeding into an LLM or RAG. Feel free to try it out. Get it at www.ekotov.pro/rdocdump/ Done during my junior research stay at @gesis.org

April 3, 2025 at 11:51 AM
A new experimental #rstats package #rdocdump saves all package source code, docs and vignettes in plain text file or a string. Very useful for feeding into an LLM or RAG. Feel free to try it out. Get it at www.ekotov.pro/rdocdump/ Done during my junior research stay at @gesis.org
Reposted

Had an amazing time w/ R-Ladies Philly showing how to brand #Quarto w/ brand.yml! 🎨
Learn how this powerful tool streamlines branding data products:
🐙 Repo: github.com/ivelasq/2025...
📹 Recording: www.youtube.com/watch?v=mTuh...
✍️ Slides: ivelasq-branded-quarto.share.connect.posit.cloud#/section
Learn how this powerful tool streamlines branding data products:
🐙 Repo: github.com/ivelasq/2025...
📹 Recording: www.youtube.com/watch?v=mTuh...
✍️ Slides: ivelasq-branded-quarto.share.connect.posit.cloud#/section

March 13, 2025 at 1:06 PM
Had an amazing time w/ R-Ladies Philly showing how to brand #Quarto w/ brand.yml! 🎨
Learn how this powerful tool streamlines branding data products:
🐙 Repo: github.com/ivelasq/2025...
📹 Recording: www.youtube.com/watch?v=mTuh...
✍️ Slides: ivelasq-branded-quarto.share.connect.posit.cloud#/section
Learn how this powerful tool streamlines branding data products:
🐙 Repo: github.com/ivelasq/2025...
📹 Recording: www.youtube.com/watch?v=mTuh...
✍️ Slides: ivelasq-branded-quarto.share.connect.posit.cloud#/section
Reposted

The R-Ladies Philly 🔔 recording of Quarto with brand.yml by ✨@ivelasq3.bsky.social ✨ is now available on YouTube! 🎉 youtu.be/mTuhQ64P3qc?... #rstats #rladies 💜

Quarto with brand.yml with Isabella Velásquez
Slides: https://ivelasq-branded-quarto.share.connect.posit.cloud/Maintaining a consistent brand identity across data science outputs is essential for clear c...
youtu.be
March 13, 2025 at 6:24 PM
The R-Ladies Philly 🔔 recording of Quarto with brand.yml by ✨@ivelasq3.bsky.social ✨ is now available on YouTube! 🎉 youtu.be/mTuhQ64P3qc?... #rstats #rladies 💜
Reposted

Reposted


Reposted

New #rstats pkg gander is now on CRAN!
gander is a coding assistant that knows how describe the objects in your global R environment. So, when you're working with data, LLMs will know the names, types, and distributions of data columns, resulting in much more effective completions.
gander is a coding assistant that knows how describe the objects in your global R environment. So, when you're working with data, LLMs will know the names, types, and distributions of data columns, resulting in much more effective completions.
February 20, 2025 at 6:33 PM
New #rstats pkg gander is now on CRAN!
gander is a coding assistant that knows how describe the objects in your global R environment. So, when you're working with data, LLMs will know the names, types, and distributions of data columns, resulting in much more effective completions.
gander is a coding assistant that knows how describe the objects in your global R environment. So, when you're working with data, LLMs will know the names, types, and distributions of data columns, resulting in much more effective completions.
Reposted
I received a question on YouTube about running a Quarto project in GitHub Codespaces. I wrote up how to do it, it was my first time using #Codespaces ever!
The key is @mickael.canouil.fr's quarto-codespaces repo 🔑 Works with #Python, #RStats, or #JuliaLang.
ivelasq.rbind.io/til-other/qu...
The key is @mickael.canouil.fr's quarto-codespaces repo 🔑 Works with #Python, #RStats, or #JuliaLang.
ivelasq.rbind.io/til-other/qu...
February 19, 2025 at 8:33 PM
I received a question on YouTube about running a Quarto project in GitHub Codespaces. I wrote up how to do it, it was my first time using #Codespaces ever!
The key is @mickael.canouil.fr's quarto-codespaces repo 🔑 Works with #Python, #RStats, or #JuliaLang.
ivelasq.rbind.io/til-other/qu...
The key is @mickael.canouil.fr's quarto-codespaces repo 🔑 Works with #Python, #RStats, or #JuliaLang.
ivelasq.rbind.io/til-other/qu...
Reposted
Working with text in ggplot2 plots can be a mess, especially when dealing with overlapping labels, busy backgrounds, or the need for custom formatting.
With these tools, text in ggplot2 becomes much more manageable and visually appealing.
#ggplot2 #statisticalanalysis #package #visualanalytics #R
With these tools, text in ggplot2 becomes much more manageable and visually appealing.
#ggplot2 #statisticalanalysis #package #visualanalytics #R

February 20, 2025 at 10:38 AM
Working with text in ggplot2 plots can be a mess, especially when dealing with overlapping labels, busy backgrounds, or the need for custom formatting.
With these tools, text in ggplot2 becomes much more manageable and visually appealing.
#ggplot2 #statisticalanalysis #package #visualanalytics #R
With these tools, text in ggplot2 becomes much more manageable and visually appealing.
#ggplot2 #statisticalanalysis #package #visualanalytics #R
Reposted

happy new year bluesky!


January 1, 2025 at 5:22 AM
happy new year bluesky!
Reposted

If your New Year's resolution is to learn #datascience w/ #rstats + #tidyverse + #quarto, check out www.coursera.org/specializati... -- covering data transformation, visualization, importing + data science ethics. Two additional courses (on modeling + inference) to be added in 2025.
Data Science with R
Offered by Duke University. Master Data Science with R. Transform, visualize, and analyze data responsibly Enroll for free.
www.coursera.org
December 27, 2024 at 7:40 PM
If your New Year's resolution is to learn #datascience w/ #rstats + #tidyverse + #quarto, check out www.coursera.org/specializati... -- covering data transformation, visualization, importing + data science ethics. Two additional courses (on modeling + inference) to be added in 2025.
Reposted

📊 Data cleaning made simple! Learn how to use R's complete.cases() to handle missing values and ensure accurate analysis. Includes code examples and best practices! 🖥️💪
👉 www.spsanderson.com/steveondata/...
#R #RStats #Programming #Code #Data #RProgramming #Blog
👉 www.spsanderson.com/steveondata/...
#R #RStats #Programming #Code #Data #RProgramming #Blog

December 19, 2024 at 1:24 PM
📊 Data cleaning made simple! Learn how to use R's complete.cases() to handle missing values and ensure accurate analysis. Includes code examples and best practices! 🖥️💪
👉 www.spsanderson.com/steveondata/...
#R #RStats #Programming #Code #Data #RProgramming #Blog
👉 www.spsanderson.com/steveondata/...
#R #RStats #Programming #Code #Data #RProgramming #Blog
Reposted

Extraordinary map, Luis!
Thank you for putting my tutorial to good use! If you would like to make similar maps based on Eurostat data, check out my video tutorial 👇🏻
youtu.be/thAB4IzplQA
Thank you for putting my tutorial to good use! If you would like to make similar maps based on Eurostat data, check out my video tutorial 👇🏻
youtu.be/thAB4IzplQA
December 20, 2024 at 8:22 AM
Extraordinary map, Luis!
Thank you for putting my tutorial to good use! If you would like to make similar maps based on Eurostat data, check out my video tutorial 👇🏻
youtu.be/thAB4IzplQA
Thank you for putting my tutorial to good use! If you would like to make similar maps based on Eurostat data, check out my video tutorial 👇🏻
youtu.be/thAB4IzplQA
Reposted

Happy to learn that one of my photos was selected for "Honourable Mention" at the Skies 2024 Photo Contest!
The photo: The USAF F-22 Raptor Demo Team in AK tails split formation with Mount Baker in the background. Thanks to Aviation Photocrew for the opportunity to capture the shot.
#f22
#avgeek
The photo: The USAF F-22 Raptor Demo Team in AK tails split formation with Mount Baker in the background. Thanks to Aviation Photocrew for the opportunity to capture the shot.
#f22
#avgeek

December 5, 2024 at 8:35 PM
Reposted

Fighter Friday: We Be Jammin edition: E/A-18G Growlers of VX-9 “The Vampires”, VX-23 “Salty Dogs”, and VX-31 “Dust Devils” Note the NextGen Mid-range jamming pods on a few. August 222 and 23 #VX9 #VX23 #VX31 #EA18G #growler #electronicattack #mugu #vampires #jamming #USAF #photography #nikon #USN


December 6, 2024 at 8:39 PM
Reposted
F/A-18F of VFA-122 "Flying Eagles" makes a pass at the #VFA122 #F18 #F18F #USN #lemoorenas #afterburner #airshow #capitalairshow #aviation #AvGeek #spotter #aviationdaily #photography #Nikon #nikonphotgraphy

November 27, 2024 at 6:06 PM
F/A-18F of VFA-122 "Flying Eagles" makes a pass at the #VFA122 #F18 #F18F #USN #lemoorenas #afterburner #airshow #capitalairshow #aviation #AvGeek #spotter #aviationdaily #photography #Nikon #nikonphotgraphy
Reposted
Sunset reflected in the pilots visor as a F/A-18F of VFA-122 "Flying Eagles" makes a pass at the Capital City Airshow, 2024 #VFA122 #F18 #F18F #USN #sunset #reflection #lemoorenas #afterburner #airshow #capitalairshow #aviation #AvGeek #spotter #aviationdaily #photography #Nikon #nikonphotgraphy

November 27, 2024 at 6:12 PM
Sunset reflected in the pilots visor as a F/A-18F of VFA-122 "Flying Eagles" makes a pass at the Capital City Airshow, 2024 #VFA122 #F18 #F18F #USN #sunset #reflection #lemoorenas #afterburner #airshow #capitalairshow #aviation #AvGeek #spotter #aviationdaily #photography #Nikon #nikonphotgraphy
Reposted

F-18 Growler head-on.
#f18 #hornet #airforce #art #artist #artwork #fineart #fineartphotography #aviationart #nikon #airplane #airplane #aviation #aviationgeek #aviationphotography #photography #plane #blackandwhite #blackandwhitephoto #blackandwhitephotography #monochrome
#f18 #hornet #airforce #art #artist #artwork #fineart #fineartphotography #aviationart #nikon #airplane #airplane #aviation #aviationgeek #aviationphotography #photography #plane #blackandwhite #blackandwhitephoto #blackandwhitephotography #monochrome

December 4, 2024 at 2:04 AM
Reposted

We found that almost 40% of 12-21 year old females are iron deficient.
jamanetwork.com/journals/jam...
I’ve been asked how this is possible evolutionarily.
I have a few thoughts. 🧵
jamanetwork.com/journals/jam...
I’ve been asked how this is possible evolutionarily.
I have a few thoughts. 🧵
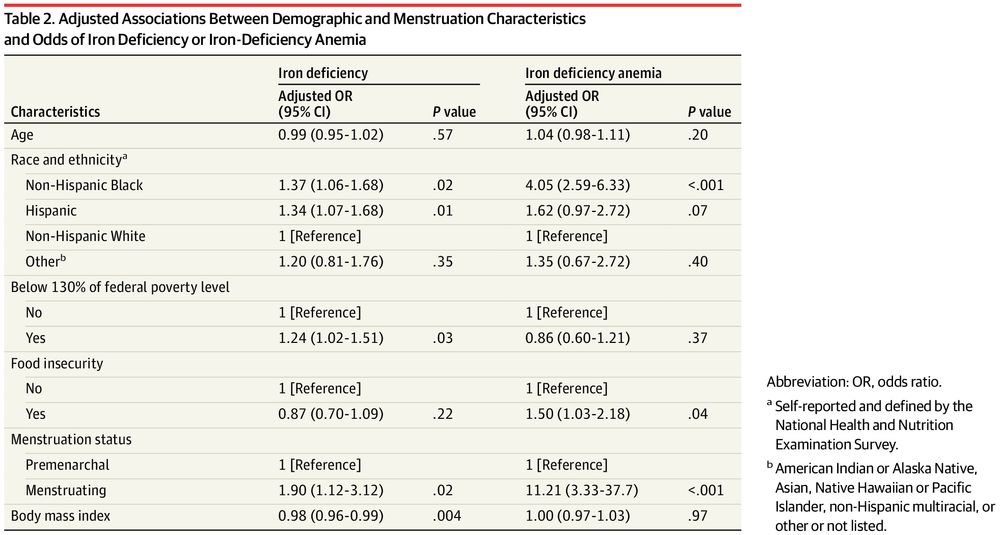
Prevalence of Iron Deficiency and Iron-Deficiency Anemia in US Females Aged 12-21 Years, 2003-2020
This study examines prevalence of iron deficiency among females aged 12 to 21 years to inform future screening strategies for iron deficiency and iron-deficiency anemia.
jamanetwork.com
December 18, 2024 at 3:07 PM
We found that almost 40% of 12-21 year old females are iron deficient.
jamanetwork.com/journals/jam...
I’ve been asked how this is possible evolutionarily.
I have a few thoughts. 🧵
jamanetwork.com/journals/jam...
I’ve been asked how this is possible evolutionarily.
I have a few thoughts. 🧵
Reposted

Struggling with large spatial datasets?
Meet 'chopin', an R package built for parallel processing, making spatial analysis faster and more efficient. Perfect for tackling environmental research challenges
👉 https://s.mtrbio.com/uyonvpzjgt
#Geocomputation #RStats #keeplearning
Meet 'chopin', an R package built for parallel processing, making spatial analysis faster and more efficient. Perfect for tackling environmental research challenges
👉 https://s.mtrbio.com/uyonvpzjgt
#Geocomputation #RStats #keeplearning

December 18, 2024 at 2:30 PM
Struggling with large spatial datasets?
Meet 'chopin', an R package built for parallel processing, making spatial analysis faster and more efficient. Perfect for tackling environmental research challenges
👉 https://s.mtrbio.com/uyonvpzjgt
#Geocomputation #RStats #keeplearning
Meet 'chopin', an R package built for parallel processing, making spatial analysis faster and more efficient. Perfect for tackling environmental research challenges
👉 https://s.mtrbio.com/uyonvpzjgt
#Geocomputation #RStats #keeplearning
Reposted

If you have a lot of steps to a data process, it can be so helpful to future users AND to your future self, to include some sort of explanation of that process in your folder structure. As well as list the input and output files used in that process. 🌟

December 17, 2024 at 11:23 PM
If you have a lot of steps to a data process, it can be so helpful to future users AND to your future self, to include some sort of explanation of that process in your folder structure. As well as list the input and output files used in that process. 🌟