


Jan Kühn
@yotka.org
Data Scientist & Data Visualization Designer (@yotka@vis.social) | https://yotka.org
Reposted by Jan Kühn

Bertolt Brecht, 1935

April 7, 2025 at 4:37 AM
Bertolt Brecht, 1935

Reposted by Jan Kühn

We are back with a new edition of the hashtag#30DayChartChallenge 😍
Soon we will publish the prompts for 2025 🥳 hashtag#dataviz
Soon we will publish the prompts for 2025 🥳 hashtag#dataviz
Are you ready for the next #30DayChartChallenge? 🚀
April is approaching fast, and we’re gearing up for the 5th edition of our visualization challenge! 📊 New look and creative prompts to spark inspiration, experimentation, learning.
We’ll reveal topics very soon, stay tuned! 🎉 Who’s in?
April is approaching fast, and we’re gearing up for the 5th edition of our visualization challenge! 📊 New look and creative prompts to spark inspiration, experimentation, learning.
We’ll reveal topics very soon, stay tuned! 🎉 Who’s in?

March 10, 2025 at 11:46 AM
We are back with a new edition of the hashtag#30DayChartChallenge 😍
Soon we will publish the prompts for 2025 🥳 hashtag#dataviz
Soon we will publish the prompts for 2025 🥳 hashtag#dataviz
Reposted by Jan Kühn
Ein Artikel in der führenden Fachzeitschrift The Lancet schätzt, dass bis zu 186.000 oder mehr Todesfälle durch den aktuellen Konflikt im Gazastreifen verursacht sein könnten. Dies wären 7,9 % der Gesamtbevölkerung.

Counting the dead in Gaza: difficult but essential
By June 19, 2024, 37 396 people had been killed in the Gaza Strip since the attack
by Hamas and the Israeli invasion in October, 2023, according to the Gaza Health Ministry,
as reported by the UN Offi...
www.thelancet.com
July 8, 2024 at 7:56 AM
Ein Artikel in der führenden Fachzeitschrift The Lancet schätzt, dass bis zu 186.000 oder mehr Todesfälle durch den aktuellen Konflikt im Gazastreifen verursacht sein könnten. Dies wären 7,9 % der Gesamtbevölkerung.
Sehr lesenswerter Text von @hahauenstein.bsky.social zur aktuellen Situation im Westjordanland.
www.fr.de/politik/west...
www.fr.de/politik/west...

Westjordanland: Wo Siedlergewalt zur Randnotiz wird
Im besetzten Westjordanland leidet die palästinensische Bevölkerung seit dem 7. Oktober mehr denn je unter brutalen Siedlerübergriffen.
www.fr.de
June 15, 2024 at 12:55 PM
Sehr lesenswerter Text von @hahauenstein.bsky.social zur aktuellen Situation im Westjordanland.
www.fr.de/politik/west...
www.fr.de/politik/west...
🌡️ The recent #HeatWave in #Mexico has been intense, with cities like #Oaxaca experiencing prolonged periods of extreme temperatures. Here's a visualization I created about the number of hot and cold days. In 2024 104 out of 148 days (70%) were extraordinarily hot. #dataviz 📊 #ClimateChange

May 31, 2024 at 9:15 AM
🌡️ The recent #HeatWave in #Mexico has been intense, with cities like #Oaxaca experiencing prolonged periods of extreme temperatures. Here's a visualization I created about the number of hot and cold days. In 2024 104 out of 148 days (70%) were extraordinarily hot. #dataviz 📊 #ClimateChange

For day 21 of the #30DayChartChallenge (green energy), I updated a visualization I made about a year ago. It shows daily electricity production shares from renewable sources.
The good news: The yearly average has risen to almost 56% in 2023, with daily peaks of above 80%.
📊 #dataviz
The good news: The yearly average has risen to almost 56% in 2023, with daily peaks of above 80%.
📊 #dataviz


April 21, 2024 at 9:38 AM
For day 21 of the #30DayChartChallenge (green energy), I updated a visualization I made about a year ago. It shows daily electricity production shares from renewable sources.
The good news: The yearly average has risen to almost 56% in 2023, with daily peaks of above 80%.
📊 #dataviz
The good news: The yearly average has risen to almost 56% in 2023, with daily peaks of above 80%.
📊 #dataviz
Reposted by Jan Kühn

Today's #30DayChartChallenge theme is "correlation".
This is one of my all time favorite correlations.
This is one of my all time favorite correlations.

April 20, 2024 at 12:35 PM
Today's #30DayChartChallenge theme is "correlation".
This is one of my all time favorite correlations.
This is one of my all time favorite correlations.
Reposted by Jan Kühn
Today's #30DayChartChallenge theme is "diverging".
I chose to temperature anomaly data. A "temperature anomaly" in this case is the difference between the observed global temperature and the 1901-2000 global average.
Always a sobering dataset to use.
I chose to temperature anomaly data. A "temperature anomaly" in this case is the difference between the observed global temperature and the 1901-2000 global average.
Always a sobering dataset to use.

April 5, 2024 at 12:27 PM
Today's #30DayChartChallenge theme is "diverging".
I chose to temperature anomaly data. A "temperature anomaly" in this case is the difference between the observed global temperature and the 1901-2000 global average.
Always a sobering dataset to use.
I chose to temperature anomaly data. A "temperature anomaly" in this case is the difference between the observed global temperature and the 1901-2000 global average.
Always a sobering dataset to use.
Reposted by Jan Kühn


Reposted by Jan Kühn

Not sure how much of #30DayChartChallenge I'll be able to join.
For day 1, I'm trying out RAWGraphics tool on UN satellite analysis data: 35% of structures destroyed or damaged in the Gaza strip by March 2024.
#dataviz #ceasefireNOW
For day 1, I'm trying out RAWGraphics tool on UN satellite analysis data: 35% of structures destroyed or damaged in the Gaza strip by March 2024.
#dataviz #ceasefireNOW


April 1, 2024 at 10:12 PM
Not sure how much of #30DayChartChallenge I'll be able to join.
For day 1, I'm trying out RAWGraphics tool on UN satellite analysis data: 35% of structures destroyed or damaged in the Gaza strip by March 2024.
#dataviz #ceasefireNOW
For day 1, I'm trying out RAWGraphics tool on UN satellite analysis data: 35% of structures destroyed or damaged in the Gaza strip by March 2024.
#dataviz #ceasefireNOW
Reposted by Jan Kühn

#Day1 of the #30DayChartChallenge, part-to-whole
Code: github.com/gkaramanis/3...
#RStats #ggplot2 #dataviz #Olympics 📊
Code: github.com/gkaramanis/3...
#RStats #ggplot2 #dataviz #Olympics 📊

April 1, 2024 at 6:36 AM
#Day1 of the #30DayChartChallenge, part-to-whole
Code: github.com/gkaramanis/3...
#RStats #ggplot2 #dataviz #Olympics 📊
Code: github.com/gkaramanis/3...
#RStats #ggplot2 #dataviz #Olympics 📊
My contribution for day 1 of the #30daychartchallenge (part-to-whole): Global military expenditure as documented by the SIPRI Milex Database (milex.sipri.org/sipri). It will be very interesting to see how those numbers evolved in 2023, but that data is still not available.

April 1, 2024 at 5:10 PM
My contribution for day 1 of the #30daychartchallenge (part-to-whole): Global military expenditure as documented by the SIPRI Milex Database (milex.sipri.org/sipri). It will be very interesting to see how those numbers evolved in 2023, but that data is still not available.
Reposted by Jan Kühn
In just a few hours we will start! Are you prepared? #30daychartchallenge #dataviz 📊
11 days left ⏳ until the #30DayChartChallenge kicks off. Are you really prepared? 😁📊📈📉
Here are all the prompts for the 30 days.
More info on Github:
github.com/30DayChartCh...
Let us know if you have any further questions! 🙂
#dataviz
Here are all the prompts for the 30 days.
More info on Github:
github.com/30DayChartCh...
Let us know if you have any further questions! 🙂
#dataviz

March 31, 2024 at 7:34 PM
In just a few hours we will start! Are you prepared? #30daychartchallenge #dataviz 📊
Gaza wird ausgehungert und die Welt schaut zu. Nichts wird verschont. Alles zerbombt. Jetzt droht die Bevölkerung in Gaza vor unser aller Augen dem Hungertod ausgeliefert zu werden. Ein Ende ist nicht absehbar. Eine Erklärung von medico international:

Gaza-Krieg - Taumel in den Abgrund - medico international
Gaza wird ausgehungert und die Welt schaut zu.
www.medico.de
March 30, 2024 at 2:26 PM
Reposted by Jan Kühn

How profitable is Tesla? Sankeys make great income statements (by Genuine Impact)

March 22, 2024 at 9:59 PM
How profitable is Tesla? Sankeys make great income statements (by Genuine Impact)
Reposted by Jan Kühn
11 days left ⏳ until the #30DayChartChallenge kicks off. Are you really prepared? 😁📊📈📉
Here are all the prompts for the 30 days.
More info on Github:
github.com/30DayChartCh...
Let us know if you have any further questions! 🙂
#dataviz
Here are all the prompts for the 30 days.
More info on Github:
github.com/30DayChartCh...
Let us know if you have any further questions! 🙂
#dataviz
March 20, 2024 at 8:27 PM
11 days left ⏳ until the #30DayChartChallenge kicks off. Are you really prepared? 😁📊📈📉
Here are all the prompts for the 30 days.
More info on Github:
github.com/30DayChartCh...
Let us know if you have any further questions! 🙂
#dataviz
Here are all the prompts for the 30 days.
More info on Github:
github.com/30DayChartCh...
Let us know if you have any further questions! 🙂
#dataviz
Reposted by Jan Kühn

»Wir haben heute die offizielle Zahl erhalten, dass das zehnte Kind in einem Krankenhaus verhungert ist.« (aus: www.zeit.de/politik/ausl...)

March 3, 2024 at 8:26 AM
»Wir haben heute die offizielle Zahl erhalten, dass das zehnte Kind in einem Krankenhaus verhungert ist.« (aus: www.zeit.de/politik/ausl...)
Reposted by Jan Kühn

February 2024 was the warmest February on record in the ERA5 dataset, at around 1.79C above preindustrial records.
It beat the prior record set during the 2016 super-El Nino by 0.12C: pulse.climate.copernicus.eu
It beat the prior record set during the 2016 super-El Nino by 0.12C: pulse.climate.copernicus.eu

March 2, 2024 at 6:18 PM
February 2024 was the warmest February on record in the ERA5 dataset, at around 1.79C above preindustrial records.
It beat the prior record set during the 2016 super-El Nino by 0.12C: pulse.climate.copernicus.eu
It beat the prior record set during the 2016 super-El Nino by 0.12C: pulse.climate.copernicus.eu
Reposted by Jan Kühn

Gökhan. Sedat. Said Nesar. Mercedes. Hamza. Vili-Viorel. Fatih. Ferhat. Kaloyan. #saytheirnames
#Hanau - eine Nacht und ihre Folgen. Ein einfühlsamer Film, in dem Angehörige und Überlebende des rassistischen Anschlags zu Wort kommen.
#Hanau - eine Nacht und ihre Folgen. Ein einfühlsamer Film, in dem Angehörige und Überlebende des rassistischen Anschlags zu Wort kommen.

Dokus & Reportagen : Hanau – Eine Nacht und ihre Folgen | ARD Mediathek
Hanau – Eine Nacht und ihre Folgen | Video | Der Mörder kam aus der Nachbarschaft: er erschoss neun junge Menschen aus rassistischen Motiven. Überlebende und Angehörige berichten, wie sie die Tatnacht...
www.ardmediathek.de
February 19, 2024 at 6:55 AM
Gökhan. Sedat. Said Nesar. Mercedes. Hamza. Vili-Viorel. Fatih. Ferhat. Kaloyan. #saytheirnames
#Hanau - eine Nacht und ihre Folgen. Ein einfühlsamer Film, in dem Angehörige und Überlebende des rassistischen Anschlags zu Wort kommen.
#Hanau - eine Nacht und ihre Folgen. Ein einfühlsamer Film, in dem Angehörige und Überlebende des rassistischen Anschlags zu Wort kommen.
Reposted by Jan Kühn

It's here! Check out the data viz feed below, open to sharing work & all kinds of discussion related to the field. To participate in the feed you must:
- Include 📊 in your post
- Be added to the account list. Sign up here: forms.gle/4iVMTBgTycXW...
Excited to continued discussions with you!
- Include 📊 in your post
- Be added to the account list. Sign up here: forms.gle/4iVMTBgTycXW...
Excited to continued discussions with you!
January 4, 2024 at 12:07 AM
It's here! Check out the data viz feed below, open to sharing work & all kinds of discussion related to the field. To participate in the feed you must:
- Include 📊 in your post
- Be added to the account list. Sign up here: forms.gle/4iVMTBgTycXW...
Excited to continued discussions with you!
- Include 📊 in your post
- Be added to the account list. Sign up here: forms.gle/4iVMTBgTycXW...
Excited to continued discussions with you!
Reposted by Jan Kühn

Unser nächstes Treffen findet am 22. Februar, um 19 Uhr statt. Diesmal präsentieren: feminizidmap.org, eine Datenbank zu Femi(ni)ziden in Deutschland und BibBot, eine Browser-Erweiterung, mit der sich viele Paywall-Artikel von Nachrichtenseiten lesen lassen.
Mehr Infos: techfrombelow.de/2024-02-22/
Mehr Infos: techfrombelow.de/2024-02-22/
techfrombelow.de
January 29, 2024 at 4:47 PM
Unser nächstes Treffen findet am 22. Februar, um 19 Uhr statt. Diesmal präsentieren: feminizidmap.org, eine Datenbank zu Femi(ni)ziden in Deutschland und BibBot, eine Browser-Erweiterung, mit der sich viele Paywall-Artikel von Nachrichtenseiten lesen lassen.
Mehr Infos: techfrombelow.de/2024-02-22/
Mehr Infos: techfrombelow.de/2024-02-22/
Reposted by Jan Kühn
Some great visuals of the 2023's gobsmackingly hot temperatures from @bbcnews-world-rss.bsky.social: www.bbc.com/news/science...
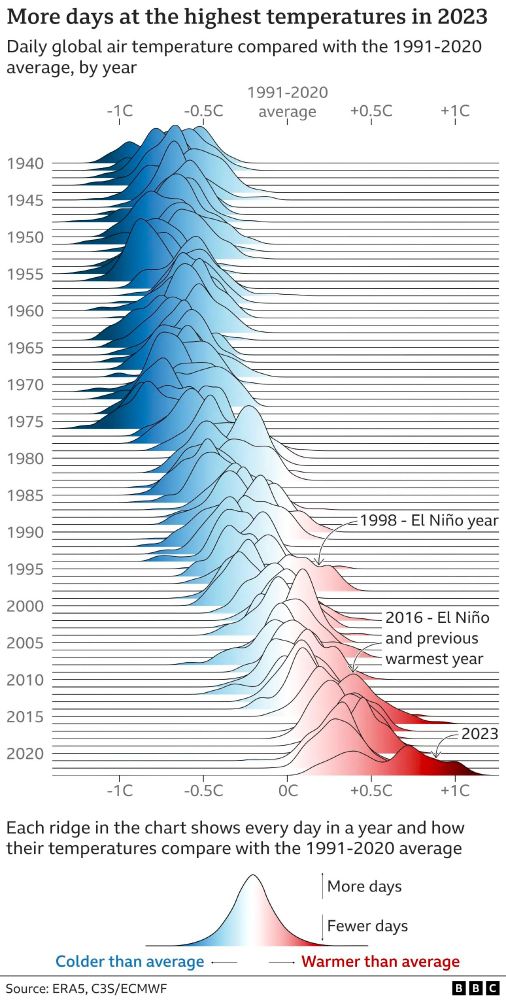
January 9, 2024 at 7:55 PM
Some great visuals of the 2023's gobsmackingly hot temperatures from @bbcnews-world-rss.bsky.social: www.bbc.com/news/science...