


Lukas Schmoigl
@schmoigl.bsky.social
Data Scientist at the Austrian Institute of Economic Research | Lecturer at the Vienna University of Economics and Business
https://appetizingdata.com | https://observablehq.com/@schmoigl | https://www.wifo.ac.at/person/lukas-schmoigl/
https://appetizingdata.com | https://observablehq.com/@schmoigl | https://www.wifo.ac.at/person/lukas-schmoigl/
Reposted by Lukas Schmoigl

#BreakingNews: "Österreichs Wirtschaft sieht Licht am Ende des Tunnels. 2025 wächst das BIP um 0,5%. 2026 sollten es 1,2% und 2027 1,4% werden." @gfelbermayr.bsky.social 1/12 www.wifo.ac.at/news/oester...

December 18, 2025 at 9:00 AM
#BreakingNews: "Österreichs Wirtschaft sieht Licht am Ende des Tunnels. 2025 wächst das BIP um 0,5%. 2026 sollten es 1,2% und 2027 1,4% werden." @gfelbermayr.bsky.social 1/12 www.wifo.ac.at/news/oester...
Reposted by Lukas Schmoigl

#TodayinHistory #dataviz #Onthisday #OTD 📊
💀Dec 13, 1900 Michael George Mulhall died in Dublin, Ireland 🇮🇪
1884: 1st? use of a pictogram, to represent data by icons proportional to a number
The train one is accurate; the wheel one commits the area illusion, using diameter to represent the number
💀Dec 13, 1900 Michael George Mulhall died in Dublin, Ireland 🇮🇪
1884: 1st? use of a pictogram, to represent data by icons proportional to a number
The train one is accurate; the wheel one commits the area illusion, using diameter to represent the number


December 14, 2025 at 3:11 AM
#TodayinHistory #dataviz #Onthisday #OTD 📊
💀Dec 13, 1900 Michael George Mulhall died in Dublin, Ireland 🇮🇪
1884: 1st? use of a pictogram, to represent data by icons proportional to a number
The train one is accurate; the wheel one commits the area illusion, using diameter to represent the number
💀Dec 13, 1900 Michael George Mulhall died in Dublin, Ireland 🇮🇪
1884: 1st? use of a pictogram, to represent data by icons proportional to a number
The train one is accurate; the wheel one commits the area illusion, using diameter to represent the number
Reposted by Lukas Schmoigl
@attilabatorfy.bsky.social delights #dataviz with:
Pie chart frenzy from Brazil
open.substack.com/pub/attilaba...
Pie chart frenzy from Brazil
open.substack.com/pub/attilaba...

Pie chart frenzy from Brazil
The illustrations of the "Little Atlas of Coffee" from the early 1940s.
open.substack.com
November 24, 2025 at 2:48 PM
@attilabatorfy.bsky.social delights #dataviz with:
Pie chart frenzy from Brazil
open.substack.com/pub/attilaba...
Pie chart frenzy from Brazil
open.substack.com/pub/attilaba...
Reposted by Lukas Schmoigl

Now this is how you detect whether an election was stolen. Humans choose rounder numbers.
by @TheEconomist
by @TheEconomist

November 6, 2025 at 9:55 AM
Now this is how you detect whether an election was stolen. Humans choose rounder numbers.
by @TheEconomist
by @TheEconomist
Reposted by Lukas Schmoigl

🚨 Wir schreiben den 1. Marie Neurath Preis für Datenvisualisierung aus!
Alle Infos hier: wien.arbeiterkammer.at/neurath
Prämiert werden 3 Visualisierungen mit Fokus auf Verteilungsfragen.
Wir freuen uns auf viele Einreichungen!
Alle Infos hier: wien.arbeiterkammer.at/neurath
Prämiert werden 3 Visualisierungen mit Fokus auf Verteilungsfragen.
Wir freuen uns auf viele Einreichungen!

Marie Neurath Preis für Datenvisualisierung
Die AK Wien schreibt 2025 erstmals den Marie Neurath Preis für Datenvisualisierung aus.
wien.arbeiterkammer.at
November 6, 2025 at 7:28 AM
🚨 Wir schreiben den 1. Marie Neurath Preis für Datenvisualisierung aus!
Alle Infos hier: wien.arbeiterkammer.at/neurath
Prämiert werden 3 Visualisierungen mit Fokus auf Verteilungsfragen.
Wir freuen uns auf viele Einreichungen!
Alle Infos hier: wien.arbeiterkammer.at/neurath
Prämiert werden 3 Visualisierungen mit Fokus auf Verteilungsfragen.
Wir freuen uns auf viele Einreichungen!
Reposted by Lukas Schmoigl

My #IEEEVIS 2025 paper explorer is live! 🎉
👉 johnguerra.co/viz/ieeevis2... 👈
An interactive #dataviz to explore 300+ papers by similarity. Perfect for:
✨ Discovering papers related to your interests
✨ Planning which sessions to attend
✨ Creating your own paper list (new!)
Pls help me distribute it
👉 johnguerra.co/viz/ieeevis2... 👈
An interactive #dataviz to explore 300+ papers by similarity. Perfect for:
✨ Discovering papers related to your interests
✨ Planning which sessions to attend
✨ Creating your own paper list (new!)
Pls help me distribute it
November 2, 2025 at 1:28 PM
My #IEEEVIS 2025 paper explorer is live! 🎉
👉 johnguerra.co/viz/ieeevis2... 👈
An interactive #dataviz to explore 300+ papers by similarity. Perfect for:
✨ Discovering papers related to your interests
✨ Planning which sessions to attend
✨ Creating your own paper list (new!)
Pls help me distribute it
👉 johnguerra.co/viz/ieeevis2... 👈
An interactive #dataviz to explore 300+ papers by similarity. Perfect for:
✨ Discovering papers related to your interests
✨ Planning which sessions to attend
✨ Creating your own paper list (new!)
Pls help me distribute it
Reposted by Lukas Schmoigl

Excellent data journalism on housing rents in Vienna and other major European cities. Includes great interactive visualizations (in German): wien.orf.at/stories/3327...

Wohnen in Wien für Systemerhalter schwer leistbar
In Wien werden Personen in systemrelevanten Berufen, etwa in der Pflege, gesucht. Eine Recherche des Urban Journalism Network unter Beteiligung des ORF und der Wiener Zeitung zeigt, dass die Wohnkoste...
wien.orf.at
October 28, 2025 at 8:10 AM
Excellent data journalism on housing rents in Vienna and other major European cities. Includes great interactive visualizations (in German): wien.orf.at/stories/3327...
Reposted by Lukas Schmoigl

Some beautiful Datawrapper hacks from our article on the MSCI World. And yes, technically those are custom choropleth maps 😀 #dataviz
www.spiegel.de/wirtschaft/s...
www.spiegel.de/wirtschaft/s...


October 8, 2025 at 7:51 AM
Some beautiful Datawrapper hacks from our article on the MSCI World. And yes, technically those are custom choropleth maps 😀 #dataviz
www.spiegel.de/wirtschaft/s...
www.spiegel.de/wirtschaft/s...
Reposted by Lukas Schmoigl
It's fun to learn how to create impactful #infographics & data-visuals like this.
2 x virtual half days:
15th & 16th Oct 🇺🇸 USA timezone
11th & 12th Nov 🇬🇧 UK/EU/AUS
In-person Mon 13th Oct London 🇬🇧
Details geni.us/WAB2024
Reviews geni.us/WABreviews
2 x virtual half days:
15th & 16th Oct 🇺🇸 USA timezone
11th & 12th Nov 🇬🇧 UK/EU/AUS
In-person Mon 13th Oct London 🇬🇧
Details geni.us/WAB2024
Reviews geni.us/WABreviews

October 2, 2025 at 11:55 AM
It's fun to learn how to create impactful #infographics & data-visuals like this.
2 x virtual half days:
15th & 16th Oct 🇺🇸 USA timezone
11th & 12th Nov 🇬🇧 UK/EU/AUS
In-person Mon 13th Oct London 🇬🇧
Details geni.us/WAB2024
Reviews geni.us/WABreviews
2 x virtual half days:
15th & 16th Oct 🇺🇸 USA timezone
11th & 12th Nov 🇬🇧 UK/EU/AUS
In-person Mon 13th Oct London 🇬🇧
Details geni.us/WAB2024
Reviews geni.us/WABreviews
For today's chartle I had to reconsult one of my older maps:
observablehq.com/@schmoigl/wi...
chartle.cc
#chartle #eurostat-map
observablehq.com/@schmoigl/wi...
chartle.cc
#chartle #eurostat-map

October 2, 2025 at 11:21 AM
For today's chartle I had to reconsult one of my older maps:
observablehq.com/@schmoigl/wi...
chartle.cc
#chartle #eurostat-map
observablehq.com/@schmoigl/wi...
chartle.cc
#chartle #eurostat-map
Reposted by Lukas Schmoigl

A new daily puzzle game that asks you to guess what country the chart line represents - super fun for all my #dataviz peeps out there. (h/t @wwb099.bsky.social) chartle.cc

Chartle - A daily chart game
Guess the country in red by analysing today's chart
chartle.cc
September 22, 2025 at 2:50 PM
A new daily puzzle game that asks you to guess what country the chart line represents - super fun for all my #dataviz peeps out there. (h/t @wwb099.bsky.social) chartle.cc
Reposted by Lukas Schmoigl
#BreakingNews: Nach zwei Jahren der Rezession (jeweils -1,0%) wird das BIP laut #WIFO-Prognose 2025 stagnieren und erst 2026 zulegen (+1,2%). @gfelbermayr.bsky.social
Mehr: www.wifo.ac.at/news/oester... 1/13
Mehr: www.wifo.ac.at/news/oester... 1/13

June 26, 2025 at 8:00 AM
#BreakingNews: Nach zwei Jahren der Rezession (jeweils -1,0%) wird das BIP laut #WIFO-Prognose 2025 stagnieren und erst 2026 zulegen (+1,2%). @gfelbermayr.bsky.social
Mehr: www.wifo.ac.at/news/oester... 1/13
Mehr: www.wifo.ac.at/news/oester... 1/13
Reposted by Lukas Schmoigl

Ojeh - das sieht heuer nicht gut aus.
Zu wenige Niederschläge 🌧️ in großen Teilen der 🇪🇺.
drought.emergency.co...
Interessanterweise sind die Preiserwartungen noch moderat (preise.agrarforschun...)
Zu wenige Niederschläge 🌧️ in großen Teilen der 🇪🇺.
drought.emergency.co...
Interessanterweise sind die Preiserwartungen noch moderat (preise.agrarforschun...)

April 17, 2025 at 5:12 AM
Ojeh - das sieht heuer nicht gut aus.
Zu wenige Niederschläge 🌧️ in großen Teilen der 🇪🇺.
drought.emergency.co...
Interessanterweise sind die Preiserwartungen noch moderat (preise.agrarforschun...)
Zu wenige Niederschläge 🌧️ in großen Teilen der 🇪🇺.
drought.emergency.co...
Interessanterweise sind die Preiserwartungen noch moderat (preise.agrarforschun...)
Reposted by Lukas Schmoigl
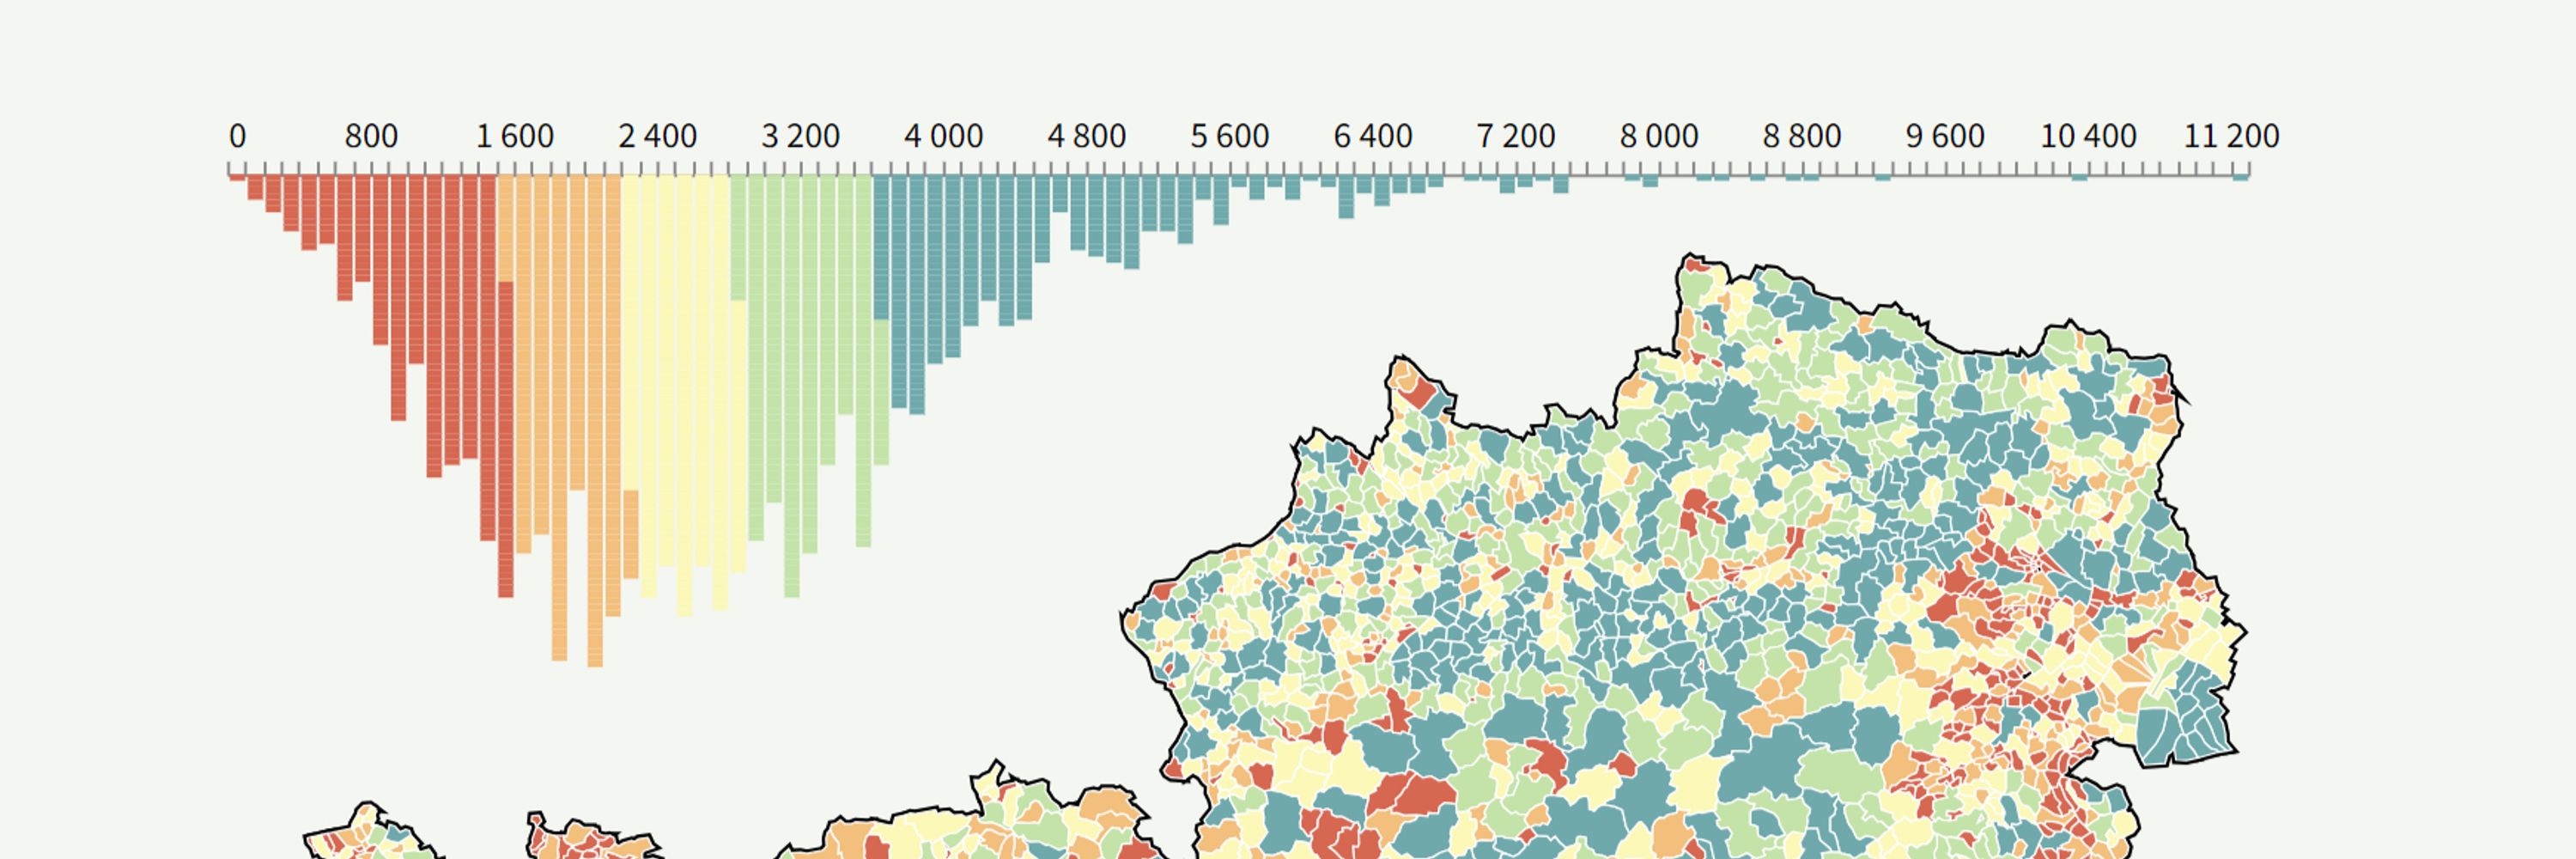
Wo lebt es sich in 🇦🇹 am besten? Natürlich zu Hause. Wo sonst.
Wie sind die materiellen Lebensbedingungen dort? Das beantwortet der @wifo.bsky.social -Lebenssituationsindex.
Von @schmoigl.bsky.social perfekt in Szene gesetzt.
Tipp: scrolle nach unten für alle Details
➡️ data-science.wifo.ac...
Wie sind die materiellen Lebensbedingungen dort? Das beantwortet der @wifo.bsky.social -Lebenssituationsindex.
Von @schmoigl.bsky.social perfekt in Szene gesetzt.
Tipp: scrolle nach unten für alle Details
➡️ data-science.wifo.ac...
March 20, 2025 at 6:07 AM
Wo lebt es sich in 🇦🇹 am besten? Natürlich zu Hause. Wo sonst.
Wie sind die materiellen Lebensbedingungen dort? Das beantwortet der @wifo.bsky.social -Lebenssituationsindex.
Von @schmoigl.bsky.social perfekt in Szene gesetzt.
Tipp: scrolle nach unten für alle Details
➡️ data-science.wifo.ac...
Wie sind die materiellen Lebensbedingungen dort? Das beantwortet der @wifo.bsky.social -Lebenssituationsindex.
Von @schmoigl.bsky.social perfekt in Szene gesetzt.
Tipp: scrolle nach unten für alle Details
➡️ data-science.wifo.ac...
A bit late to the Closerread party but here you go:
🔗 data-science.wifo.ac.at/Lebenssituat...
🔗 data-science.wifo.ac.at/Lebenssituat...
March 19, 2025 at 9:31 AM
A bit late to the Closerread party but here you go:
🔗 data-science.wifo.ac.at/Lebenssituat...
🔗 data-science.wifo.ac.at/Lebenssituat...
Reposted by Lukas Schmoigl
#WIFO-Lebenssituationsindex von @franzsinabell.bsky.social & Julia Bock-Schappelwein gibt Einblick in materielle Lebensumstände & lässt damit Rückschlüsse auf Lebenssituation in 2.115 Wohngemeinden in 🇦🇹 zu. www.wifo.ac.at/news/so-leb...
Interaktive Geschichte im 🧵 lesen @schmoigl.bsky.social 1/9
Interaktive Geschichte im 🧵 lesen @schmoigl.bsky.social 1/9

March 19, 2025 at 9:16 AM
#WIFO-Lebenssituationsindex von @franzsinabell.bsky.social & Julia Bock-Schappelwein gibt Einblick in materielle Lebensumstände & lässt damit Rückschlüsse auf Lebenssituation in 2.115 Wohngemeinden in 🇦🇹 zu. www.wifo.ac.at/news/so-leb...
Interaktive Geschichte im 🧵 lesen @schmoigl.bsky.social 1/9
Interaktive Geschichte im 🧵 lesen @schmoigl.bsky.social 1/9
The EU Revenue Galaxy 🪐 Where does the EU budget come from? My contribution to the Other Revenue project for the EU Parliament, exploring the different sources of EU funding.
🔗 data-science.wifo.ac.at/other-revenu...
🔗 data-science.wifo.ac.at/other-revenu...

March 17, 2025 at 10:02 AM
The EU Revenue Galaxy 🪐 Where does the EU budget come from? My contribution to the Other Revenue project for the EU Parliament, exploring the different sources of EU funding.
🔗 data-science.wifo.ac.at/other-revenu...
🔗 data-science.wifo.ac.at/other-revenu...
Reposted by Lukas Schmoigl


My year in #dataviz part VI 👵🏻 Visualizing the gender pension gap in Austria ↓
The gender pension gap in Austria:
How are the gross pensions of men and women distributed? The differences are enormous for current cohorts. 1/5
data-science.wifo.ac.at/AK-Pensionsf...
How are the gross pensions of men and women distributed? The differences are enormous for current cohorts. 1/5
data-science.wifo.ac.at/AK-Pensionsf...
December 31, 2024 at 10:57 AM
My year in #dataviz part VI 👵🏻 Visualizing the gender pension gap in Austria ↓
My year in #dataviz part V 🌊 The 2024 flood in Austria. What where the damages? Flash estimates based on the affected area.
www.wifo.ac.at/en/institute...
www.wifo.ac.at/en/institute...

December 30, 2024 at 9:50 AM
My year in #dataviz part V 🌊 The 2024 flood in Austria. What where the damages? Flash estimates based on the affected area.
www.wifo.ac.at/en/institute...
www.wifo.ac.at/en/institute...
Reposted by Lukas Schmoigl
#BreakingNews: "Die wirtschaftspolitische Unsicherheit in Österreich ist hoch. Im Prognosezeitraum ist mit erheblichen Einsparungen in den öffentlichen Haushalten zu rechnen, deren Auswirkungen derzeit nicht abschätzbar sind", so @gfelbermayr.bsky.social. 1/13 ow.ly/YMJw50UtZsk

December 20, 2024 at 9:00 AM
#BreakingNews: "Die wirtschaftspolitische Unsicherheit in Österreich ist hoch. Im Prognosezeitraum ist mit erheblichen Einsparungen in den öffentlichen Haushalten zu rechnen, deren Auswirkungen derzeit nicht abschätzbar sind", so @gfelbermayr.bsky.social. 1/13 ow.ly/YMJw50UtZsk
Reposted by Lukas Schmoigl

Heute jährt sich zum 74. Mal der Todestag des #Mathematikers und #Statistikers Abraham Wald. Der „Wald-Test“ ist zentraler Bestandteil jeder #Statistiksoftware. Er arbeitete von 1933-1938 am Österreichischen Konjunkturforschungsinstitut (heute #WIFO), 1938 musste er fliehen.
December 13, 2024 at 6:11 AM
Heute jährt sich zum 74. Mal der Todestag des #Mathematikers und #Statistikers Abraham Wald. Der „Wald-Test“ ist zentraler Bestandteil jeder #Statistiksoftware. Er arbeitete von 1933-1938 am Österreichischen Konjunkturforschungsinstitut (heute #WIFO), 1938 musste er fliehen.
My year in #dataviz part IV 🔃 Visualizing the trade flows of EU member states:
www.wifo.ac.at/en/research/...
www.wifo.ac.at/en/research/...

December 16, 2024 at 4:14 PM
My year in #dataviz part IV 🔃 Visualizing the trade flows of EU member states:
www.wifo.ac.at/en/research/...
www.wifo.ac.at/en/research/...
Reposted by Lukas Schmoigl
#TodayinHistory #dataviz #Onthisday #OTD 📊
📅Dec 12, 1854 John Snow reports on the cholera outbreak that occurred in London in 1854 to the Cholera Inquiry Committee [Gilbert:1958; Snow:1855]
📅Dec 12, 1854 John Snow reports on the cholera outbreak that occurred in London in 1854 to the Cholera Inquiry Committee [Gilbert:1958; Snow:1855]

December 12, 2024 at 1:08 AM
#TodayinHistory #dataviz #Onthisday #OTD 📊
📅Dec 12, 1854 John Snow reports on the cholera outbreak that occurred in London in 1854 to the Cholera Inquiry Committee [Gilbert:1958; Snow:1855]
📅Dec 12, 1854 John Snow reports on the cholera outbreak that occurred in London in 1854 to the Cholera Inquiry Committee [Gilbert:1958; Snow:1855]
My year in #dataviz part III 👷️ How effective are different labor market subsidies in integrating the unemployed back into the workforce? Here's an overview based on a WIFO study:
www.wifo.ac.at/en/research/...
www.wifo.ac.at/en/research/...

December 11, 2024 at 10:47 AM
My year in #dataviz part III 👷️ How effective are different labor market subsidies in integrating the unemployed back into the workforce? Here's an overview based on a WIFO study:
www.wifo.ac.at/en/research/...
www.wifo.ac.at/en/research/...