


Canadian Aqua
@priorconfirmed.bsky.social
Canada shill. Economic stuffs
Reposted by Canadian Aqua

10 years of this shit

January 20, 2026 at 10:44 PM
10 years of this shit
Reposted by Canadian Aqua

Introducing CanViz, my little side project over the break to make StatCan tables more accessible.

CanViz - Canadian Data Visualization Tool
Interactive data visualization tool for exploring and analyzing Statistics Canada data tables. Browse thousands of Canadian statistics, create custom plots, and download data in multiple formats.
canviz.mountainmath.ca
January 12, 2026 at 4:31 PM
Introducing CanViz, my little side project over the break to make StatCan tables more accessible.
So I was doing some perusing of the temporary foreign worker program literature and I found this paper. I believe I have identified multiple critical flaws in their paper. I'm baffled as to how these were not caught.

November 19, 2025 at 1:24 AM
So I was doing some perusing of the temporary foreign worker program literature and I found this paper. I believe I have identified multiple critical flaws in their paper. I'm baffled as to how these were not caught.
Reposted by Canadian Aqua
Updated Urban Greenness data out from StatCan is out today, quantifying the "average greenness" on a 250m grid. Data is annual and goes back to 2000 and allows for some comparison (although some caution is advised).


November 17, 2025 at 5:37 PM
Updated Urban Greenness data out from StatCan is out today, quantifying the "average greenness" on a 250m grid. Data is annual and goes back to 2000 and allows for some comparison (although some caution is advised).
Reposted by Canadian Aqua

The Jobs Report, brought to you by DoorDash.

November 11, 2025 at 9:42 PM
The Jobs Report, brought to you by DoorDash.
With the release of the 2022 supply and use tables and revisions, here's what the updated GDP per capita looks like. We'll have to wait later this month for 2025 updates. I just did a crude upward lift here since we only got annual up to 2024.

November 6, 2025 at 9:35 PM
With the release of the 2022 supply and use tables and revisions, here's what the updated GDP per capita looks like. We'll have to wait later this month for 2025 updates. I just did a crude upward lift here since we only got annual up to 2024.
Reposted by Canadian Aqua

The media elites don't want you to know that immigrants out earn Canadians by a substantial margin, including the 2021 cohort

November 5, 2025 at 9:23 PM
The media elites don't want you to know that immigrants out earn Canadians by a substantial margin, including the 2021 cohort
I just had to say something on this report by TD. Their argument for why unemployment would be higher in counterfactual world with higher population growth is drawing a straight line. Like my god, bank economists truly are topic economic minds.

October 31, 2025 at 6:55 PM
I just had to say something on this report by TD. Their argument for why unemployment would be higher in counterfactual world with higher population growth is drawing a straight line. Like my god, bank economists truly are topic economic minds.
Reposted by Canadian Aqua
Workday morning rush hour for comparison. More bus lines, and more service.
(Still missing buses not sending realtime data, as well as sea bus and skytrain which don't show up in the realtime data feed.)
(Still missing buses not sending realtime data, as well as sea bus and skytrain which don't show up in the realtime data feed.)
October 15, 2025 at 2:24 AM
Workday morning rush hour for comparison. More bus lines, and more service.
(Still missing buses not sending realtime data, as well as sea bus and skytrain which don't show up in the realtime data feed.)
(Still missing buses not sending realtime data, as well as sea bus and skytrain which don't show up in the realtime data feed.)
Reposted by Canadian Aqua
I find it funny that the anti-immigration people like to cite Denmark as their success story when their youth unemployment is higher than Canada's
October 14, 2025 at 6:04 PM
I find it funny that the anti-immigration people like to cite Denmark as their success story when their youth unemployment is higher than Canada's
With the adoption of the 2025 SNA coming around in 2029-2030, here's the impact on nominal GDP from the inclusion of data as recommended by it.
We see a slight shift upward (average of 2.2%) over 2000-2019 with it's impact growing over time. If the trend holds 2024 will be ≈2.6% high
We see a slight shift upward (average of 2.2%) over 2000-2019 with it's impact growing over time. If the trend holds 2024 will be ≈2.6% high

August 5, 2025 at 2:34 PM
With the adoption of the 2025 SNA coming around in 2029-2030, here's the impact on nominal GDP from the inclusion of data as recommended by it.
We see a slight shift upward (average of 2.2%) over 2000-2019 with it's impact growing over time. If the trend holds 2024 will be ≈2.6% high
We see a slight shift upward (average of 2.2%) over 2000-2019 with it's impact growing over time. If the trend holds 2024 will be ≈2.6% high
Reposted by Canadian Aqua

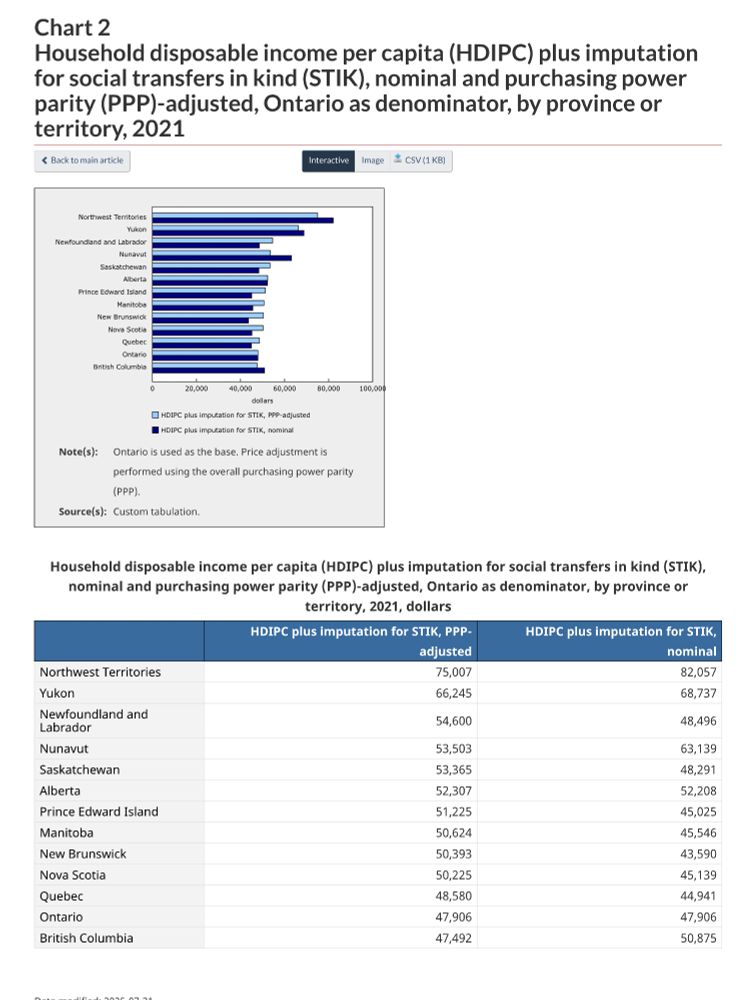
A significant study released by Statistics Canada this morning casts new and surprising light on real per capita regional income disparities in Canada. After PPP adjustment, Ontario and BC ranked lower in 2021 while the poorer regions correspondingly higher. www150.statcan.gc.ca/n1/daily-quo...
July 31, 2025 at 12:57 PM
A significant study released by Statistics Canada this morning casts new and surprising light on real per capita regional income disparities in Canada. After PPP adjustment, Ontario and BC ranked lower in 2021 while the poorer regions correspondingly higher. www150.statcan.gc.ca/n1/daily-quo...
Lol we got an "urban studies" guy saying that immigrants are stealing jobs because the average labour force participation rate is falling. In addition he cites Borjas as his proof that immigrants suppress wages LOL
nationalpost.com/opinion/joel...
nationalpost.com/opinion/joel...

Joel Kotkin: The West's immigration reckoning is here
Soaring immigration has coincided with steadily dropping labour market participation
nationalpost.com
July 5, 2025 at 2:51 AM
Lol we got an "urban studies" guy saying that immigrants are stealing jobs because the average labour force participation rate is falling. In addition he cites Borjas as his proof that immigrants suppress wages LOL
nationalpost.com/opinion/joel...
nationalpost.com/opinion/joel...
An update to my TFP calculation. Made a coding error with the pre-2006 LFS data so it strongly overstated labour composition growth.

June 25, 2025 at 12:05 PM
An update to my TFP calculation. Made a coding error with the pre-2006 LFS data so it strongly overstated labour composition growth.
Ok there's the final product for quartrely total factor productivity! Happy with this for now.

June 21, 2025 at 6:35 AM
Ok there's the final product for quartrely total factor productivity! Happy with this for now.
Really rough first pass at calculating TFP for Canada. A lot of stuff I'm really not happy about here that I'll be revisiting. I will also be extending this further back in time as well.

June 19, 2025 at 4:44 AM
Really rough first pass at calculating TFP for Canada. A lot of stuff I'm really not happy about here that I'll be revisiting. I will also be extending this further back in time as well.
In the process of replicating and extending Diewert and Yu (2012) where they calculate Total Factor Productivity but I will be doing it on a quarterly basis and extending it to the Present.
Multiplying labour quality by hours worked gives us our "labour services" input.
Details below 1/n
Multiplying labour quality by hours worked gives us our "labour services" input.
Details below 1/n

June 3, 2025 at 8:41 AM
In the process of replicating and extending Diewert and Yu (2012) where they calculate Total Factor Productivity but I will be doing it on a quarterly basis and extending it to the Present.
Multiplying labour quality by hours worked gives us our "labour services" input.
Details below 1/n
Multiplying labour quality by hours worked gives us our "labour services" input.
Details below 1/n
Reposted by Canadian Aqua
Long-term interest rate yields on US Treasury securities have trended up since Trump's 'Liberation Day'. The risk of default has never been higher as the fiscal deficit explodes and uncertainty stalls private decision-making under a President who made a career out of welshing on his personal debt.

May 24, 2025 at 1:44 AM
Long-term interest rate yields on US Treasury securities have trended up since Trump's 'Liberation Day'. The risk of default has never been higher as the fiscal deficit explodes and uncertainty stalls private decision-making under a President who made a career out of welshing on his personal debt.
Twitter is completely FUCKED right now. Unusable 🤧
What will I do for entertainment now???
What will I do for entertainment now???
May 24, 2025 at 12:48 PM
Twitter is completely FUCKED right now. Unusable 🤧
What will I do for entertainment now???
What will I do for entertainment now???
An update on permits issued for study, temporary foreign worker program, and international mobility program. Reminder that this includes renewals and new permits!
Looks like study permit issuances is going up again after falling, but exercise caution with this series!
Looks like study permit issuances is going up again after falling, but exercise caution with this series!

May 23, 2025 at 1:10 PM
An update on permits issued for study, temporary foreign worker program, and international mobility program. Reminder that this includes renewals and new permits!
Looks like study permit issuances is going up again after falling, but exercise caution with this series!
Looks like study permit issuances is going up again after falling, but exercise caution with this series!
Reposted by Canadian Aqua
As the US drives its international indebtedness ever higher, Canada's net asset position keeps expending. Our financial picture is much better balanced. The Trump budget plan for this year will drive US indebtedness even further down, necessitating more borrowing and further weakening the US$.

May 22, 2025 at 6:40 PM
As the US drives its international indebtedness ever higher, Canada's net asset position keeps expending. Our financial picture is much better balanced. The Trump budget plan for this year will drive US indebtedness even further down, necessitating more borrowing and further weakening the US$.
Reposted by Canadian Aqua

A US deficit of $2.3 trillion is about 7.5% of expected US GDP in 2026. Canada is in the range of 2% defict/GDP.
Their 10 year bond is about 4.5%; ours is about 3.5%.
Their 10 year bond is about 4.5%; ours is about 3.5%.

Pretty concerned about ye olde budget deficit situation with inflation still a bit above target and interest rates rising

May 20, 2025 at 11:45 PM
A US deficit of $2.3 trillion is about 7.5% of expected US GDP in 2026. Canada is in the range of 2% defict/GDP.
Their 10 year bond is about 4.5%; ours is about 3.5%.
Their 10 year bond is about 4.5%; ours is about 3.5%.
Reposted by Canadian Aqua

Today's inflation data: avg prices rose 1.7% in April vs last year.
Absent carbon taxes, inflation would have been 2.3% in April (see: www150.statcan.gc.ca/t1/tbl1/en/...). This 0.6% effect validates research (incl. by myself and @dr_jen_winter) on the effect of CTaxes. #cdnecon #cdnpoli
Absent carbon taxes, inflation would have been 2.3% in April (see: www150.statcan.gc.ca/t1/tbl1/en/...). This 0.6% effect validates research (incl. by myself and @dr_jen_winter) on the effect of CTaxes. #cdnecon #cdnpoli
May 20, 2025 at 2:00 PM
Today's inflation data: avg prices rose 1.7% in April vs last year.
Absent carbon taxes, inflation would have been 2.3% in April (see: www150.statcan.gc.ca/t1/tbl1/en/...). This 0.6% effect validates research (incl. by myself and @dr_jen_winter) on the effect of CTaxes. #cdnecon #cdnpoli
Absent carbon taxes, inflation would have been 2.3% in April (see: www150.statcan.gc.ca/t1/tbl1/en/...). This 0.6% effect validates research (incl. by myself and @dr_jen_winter) on the effect of CTaxes. #cdnecon #cdnpoli
Reposted by Canadian Aqua
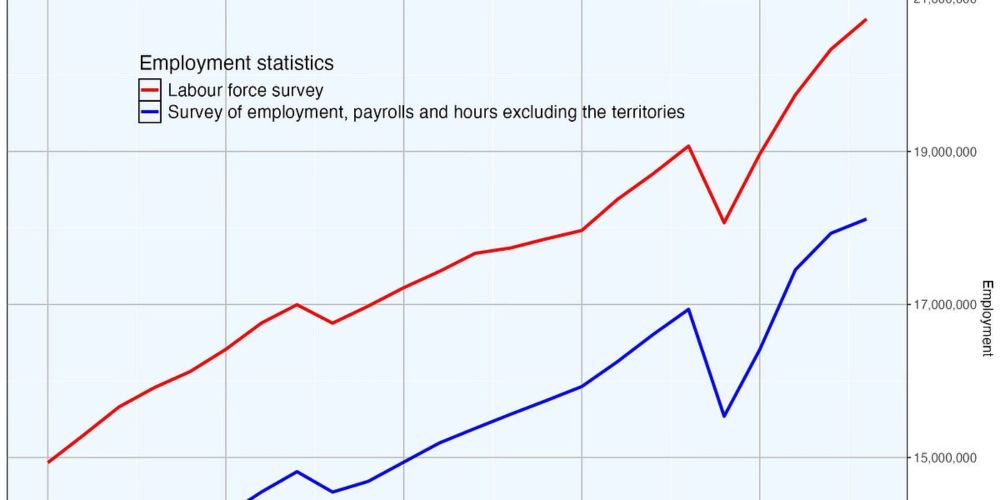
If you are interested in Canadian employment statistics, I have a new piece on Substack (free) comparing LFS and SEPH here: philip635.substack.com/p/comparing-...
Comparing Canada's two employment surveys
Introduction
philip635.substack.com
May 17, 2025 at 8:16 PM
If you are interested in Canadian employment statistics, I have a new piece on Substack (free) comparing LFS and SEPH here: philip635.substack.com/p/comparing-...
Reposted by Canadian Aqua
The big problem with most of the financialization and commodification of housing arguments is the lack of foundation in data and real world processes. It’s 90% ideology and 10% cherry-picked examples.

This discussion between Sam Seder and Ezra Klein is a succinct distillation of the intra-left conversation about housing affordability.
May 16, 2025 at 9:05 PM
The big problem with most of the financialization and commodification of housing arguments is the lack of foundation in data and real world processes. It’s 90% ideology and 10% cherry-picked examples.