


Joe Davies
@joewdavies.bsky.social
GIS and Cartography at Eurostat.
Exploring new ways of making maps.
observablehq.com/@joewdavies
Exploring new ways of making maps.
observablehq.com/@joewdavies
Pinned
Joe Davies
@joewdavies.bsky.social
· Jan 6
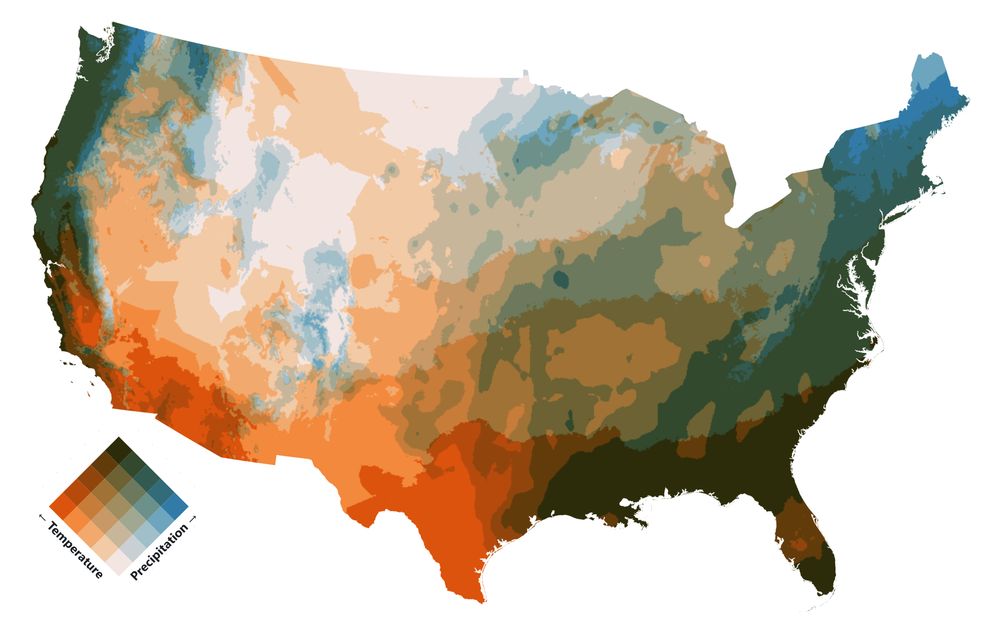
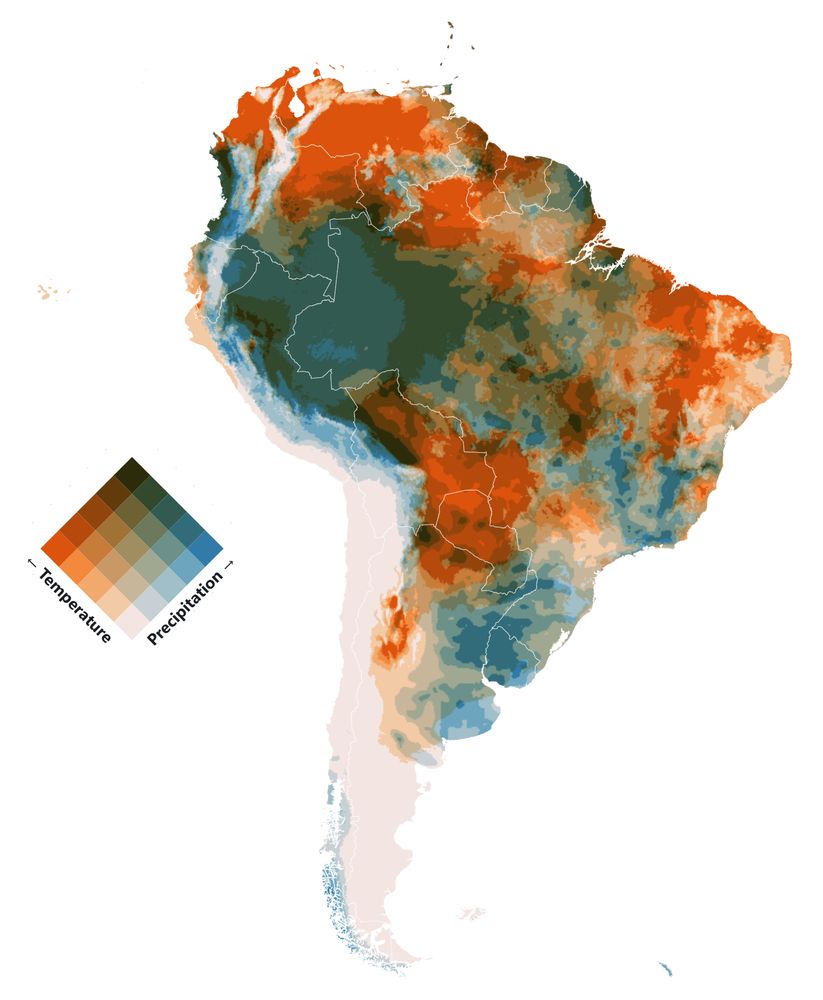
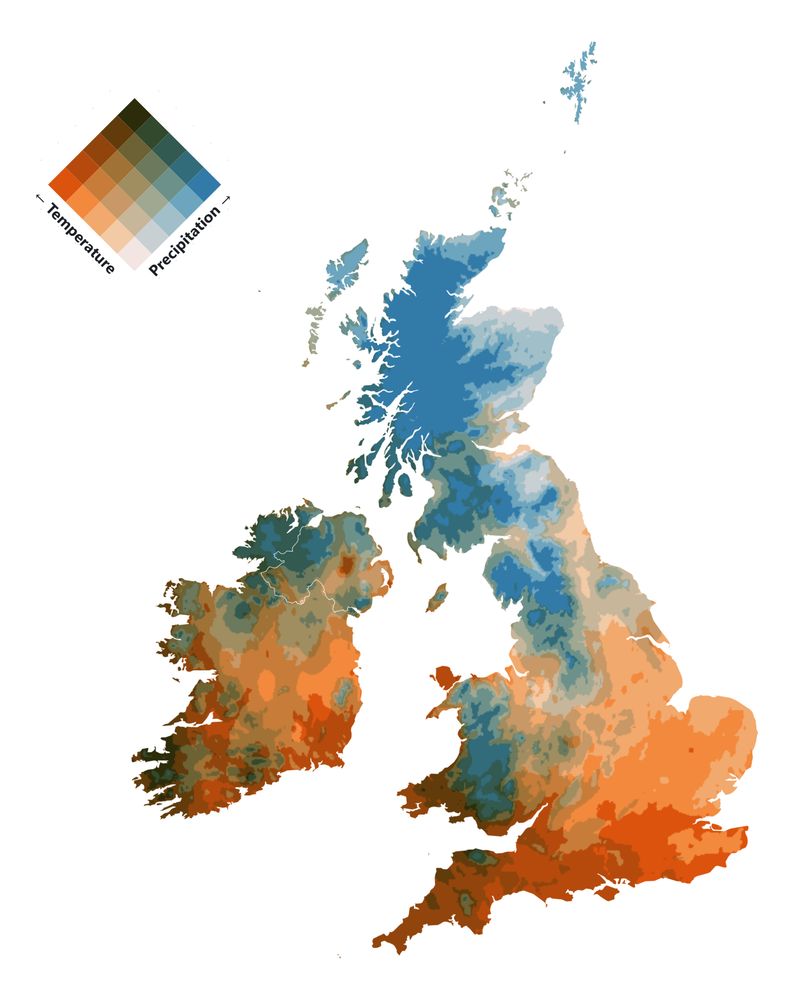
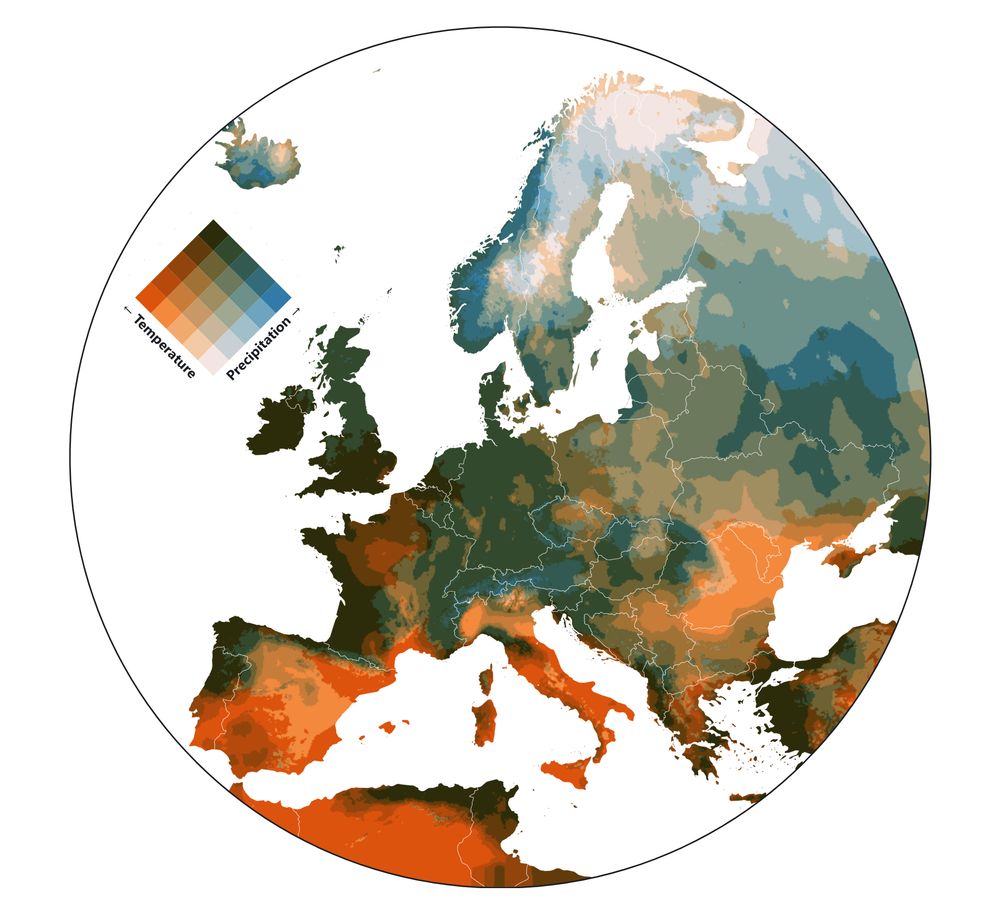
Bivariate maps showing the relationships between Temperature and Precipitation.
Made with Plot, based on a great tutorial by Fil: observablehq.com/@jo...
Data from TerraClimate (1958-present).
#cartography #maps #mapping #climate #dataviz #SciArt
Made with Plot, based on a great tutorial by Fil: observablehq.com/@jo...
Data from TerraClimate (1958-present).
#cartography #maps #mapping #climate #dataviz #SciArt
Reposted by Joe Davies

This #map title could be "Retirement with a sea view in Belgium".
See online version on Eurostat website: tinyurl.com/2ps59n6a
See online version on Eurostat website: tinyurl.com/2ps59n6a

January 29, 2026 at 4:08 PM
This #map title could be "Retirement with a sea view in Belgium".
See online version on Eurostat website: tinyurl.com/2ps59n6a
See online version on Eurostat website: tinyurl.com/2ps59n6a
Reposted by Joe Davies
Here's a brief cartographic exploration of Brittany's resident population by age, using Eurostat gridded data at 1km resolution ! Thread: ↪️
#map #gis #demography #gischat #cartography
#map #gis #demography #gischat #cartography

January 25, 2026 at 5:57 PM
Here's a brief cartographic exploration of Brittany's resident population by age, using Eurostat gridded data at 1km resolution ! Thread: ↪️
#map #gis #demography #gischat #cartography
#map #gis #demography #gischat #cartography
lets play 'guess the country based on its DEM'


January 21, 2026 at 7:17 PM
lets play 'guess the country based on its DEM'
Statle (17/01/2026) 1/6 (100%)
🔥 Current Win Streak: 19
🟩🟩🟩🟩🟩🎉
joewdavies.github.io/statle
Nobody is beating that!!
🔥 Current Win Streak: 19
🟩🟩🟩🟩🟩🎉
joewdavies.github.io/statle
Nobody is beating that!!

Statle — Guess the country!
One country per day. Guess in up to 6 tries.
joewdavies.github.io
January 17, 2026 at 8:39 AM
Statle (17/01/2026) 1/6 (100%)
🔥 Current Win Streak: 19
🟩🟩🟩🟩🟩🎉
joewdavies.github.io/statle
Nobody is beating that!!
🔥 Current Win Streak: 19
🟩🟩🟩🟩🟩🎉
joewdavies.github.io/statle
Nobody is beating that!!
Reposted by Joe Davies

The Geography of the Labour Force Composition in the Netherlands by Ate Poorthuis (doi.org/10.1111/tesg...). One of the best uses of the centered ternary balance scheme (www.demographic-research.org/articles/vol...) I've seen so far. Build with tricolore github.com/jschoeley/tr... @ikashnitsky.phd

January 8, 2026 at 8:31 AM
The Geography of the Labour Force Composition in the Netherlands by Ate Poorthuis (doi.org/10.1111/tesg...). One of the best uses of the centered ternary balance scheme (www.demographic-research.org/articles/vol...) I've seen so far. Build with tricolore github.com/jschoeley/tr... @ikashnitsky.phd
Reposted by Joe Davies
I've updated Geoblender so that the country DEM prep is automated using python! Simply add the DEM tiles and set COUNTRY_CODE to your desired country.
I also added the option to download and drape a Sentinel satellite image over it!
See github.com/joewdavies/g...
#gis #cartography #blender #b3d
I also added the option to download and drape a Sentinel satellite image over it!
See github.com/joewdavies/g...
#gis #cartography #blender #b3d


January 11, 2026 at 7:51 PM
I've updated Geoblender so that the country DEM prep is automated using python! Simply add the DEM tiles and set COUNTRY_CODE to your desired country.
I also added the option to download and drape a Sentinel satellite image over it!
See github.com/joewdavies/g...
#gis #cartography #blender #b3d
I also added the option to download and drape a Sentinel satellite image over it!
See github.com/joewdavies/g...
#gis #cartography #blender #b3d
January 11, 2026 at 7:51 PM
I've updated Geoblender so that the country DEM prep is automated using python! Simply add the DEM tiles and set COUNTRY_CODE to your desired country.
I also added the option to download and drape a Sentinel satellite image over it!
See github.com/joewdavies/g...
#gis #cartography #blender #b3d
I also added the option to download and drape a Sentinel satellite image over it!
See github.com/joewdavies/g...
#gis #cartography #blender #b3d


Reposted by Joe Davies

Built a palette extractor that thinks like a curator, not a pixel counter.
– Physics-based color repulsion
– Auto-detects muted vs vibrant bias
– Adaptive spacing to hit target count
– OKLCh color space (perceptually uniform)
Early Access: please break it!
chipper-otter-d6c600.netlify.app
– Physics-based color repulsion
– Auto-detects muted vs vibrant bias
– Adaptive spacing to hit target count
– OKLCh color space (perceptually uniform)
Early Access: please break it!
chipper-otter-d6c600.netlify.app
January 8, 2026 at 7:51 PM
Built a palette extractor that thinks like a curator, not a pixel counter.
– Physics-based color repulsion
– Auto-detects muted vs vibrant bias
– Adaptive spacing to hit target count
– OKLCh color space (perceptually uniform)
Early Access: please break it!
chipper-otter-d6c600.netlify.app
– Physics-based color repulsion
– Auto-detects muted vs vibrant bias
– Adaptive spacing to hit target count
– OKLCh color space (perceptually uniform)
Early Access: please break it!
chipper-otter-d6c600.netlify.app
Reposted by Joe Davies

January 7, 2026 at 4:20 PM
Reposted by Joe Davies

January 2, 2026 at 4:08 PM
First attempts at visualizing El Tranco, a place where I have spent many summers, using CartoHD (by @jgaffuri.bsky.social


January 2, 2026 at 4:08 PM
First attempts at visualizing El Tranco, a place where I have spent many summers, using CartoHD (by @jgaffuri.bsky.social
Reposted by Joe Davies

New record year for renewable electricity in Britain - thanks especially to strong solar output.
Read our analysis of 2025 here www.bbc.co.uk/news/article...
Read our analysis of 2025 here www.bbc.co.uk/news/article...

January 2, 2026 at 12:23 PM
New record year for renewable electricity in Britain - thanks especially to strong solar output.
Read our analysis of 2025 here www.bbc.co.uk/news/article...
Read our analysis of 2025 here www.bbc.co.uk/news/article...
these are excellent
📣 NEW WORK! Excited to share my latest work with the Publications Office of the European Union 🇪🇺
I got to create 9 dataviz for 3 of the EU's monthly Data Stories, covering fascinating topics, from leisure, health and the future.
See all the visuals here: www.visualcinnamon.com/portfolio/eu...
I got to create 9 dataviz for 3 of the EU's monthly Data Stories, covering fascinating topics, from leisure, health and the future.
See all the visuals here: www.visualcinnamon.com/portfolio/eu...


December 29, 2025 at 10:07 AM
these are excellent
Reposted by Joe Davies

📣 NEW WORK! Excited to share my latest work with the Publications Office of the European Union 🇪🇺
I got to create 9 dataviz for 3 of the EU's monthly Data Stories, covering fascinating topics, from leisure, health and the future.
See all the visuals here: www.visualcinnamon.com/portfolio/eu...
I got to create 9 dataviz for 3 of the EU's monthly Data Stories, covering fascinating topics, from leisure, health and the future.
See all the visuals here: www.visualcinnamon.com/portfolio/eu...
September 25, 2025 at 1:27 PM
📣 NEW WORK! Excited to share my latest work with the Publications Office of the European Union 🇪🇺
I got to create 9 dataviz for 3 of the EU's monthly Data Stories, covering fascinating topics, from leisure, health and the future.
See all the visuals here: www.visualcinnamon.com/portfolio/eu...
I got to create 9 dataviz for 3 of the EU's monthly Data Stories, covering fascinating topics, from leisure, health and the future.
See all the visuals here: www.visualcinnamon.com/portfolio/eu...
Reposted by Joe Davies
Just stumbled across this wonderful FREE book on "Engineers of Map Art" documenting over a decade of cartography at ETH Zurich.
A quick scroll shows amazing maps 😍
👉 ebook: www.research-collection.ethz.ch/entities/pub...
👉 physical copy: karto.ethz.ch/en/publicati...
Have fun reading!
A quick scroll shows amazing maps 😍
👉 ebook: www.research-collection.ethz.ch/entities/pub...
👉 physical copy: karto.ethz.ch/en/publicati...
Have fun reading!


December 5, 2025 at 9:14 AM
Just stumbled across this wonderful FREE book on "Engineers of Map Art" documenting over a decade of cartography at ETH Zurich.
A quick scroll shows amazing maps 😍
👉 ebook: www.research-collection.ethz.ch/entities/pub...
👉 physical copy: karto.ethz.ch/en/publicati...
Have fun reading!
A quick scroll shows amazing maps 😍
👉 ebook: www.research-collection.ethz.ch/entities/pub...
👉 physical copy: karto.ethz.ch/en/publicati...
Have fun reading!
Merry Christmas everyone! 🎄
December 25, 2025 at 10:32 AM
Merry Christmas everyone! 🎄
Reposted by Joe Davies
#relief #maps of various places in #europe as #hysometric tints.
shorturl.at/UHMfW
#cartography #gischat #map
shorturl.at/UHMfW
#cartography #gischat #map


December 25, 2025 at 10:12 AM
#relief #maps of various places in #europe as #hysometric tints.
shorturl.at/UHMfW
#cartography #gischat #map
shorturl.at/UHMfW
#cartography #gischat #map
Some more gridviz experimental sillyness applied to a map of US passenger flights...
December 24, 2025 at 5:25 PM
Some more gridviz experimental sillyness applied to a map of US passenger flights...
Reposted by Joe Davies

Reposted by Joe Davies
Out of curiosity, I made a notebook that turns an image into a csv grid and visualises it with gridviz, allowing you to manipulate each pixel: observablehq.com/d/0a51240cfc...
Not that useful, but I thought it looked cool!
Not that useful, but I thought it looked cool!


December 22, 2025 at 6:16 PM
Out of curiosity, I made a notebook that turns an image into a csv grid and visualises it with gridviz, allowing you to manipulate each pixel: observablehq.com/d/0a51240cfc...
Not that useful, but I thought it looked cool!
Not that useful, but I thought it looked cool!
Out of curiosity, I made a notebook that turns an image into a csv grid and visualises it with gridviz, allowing you to manipulate each pixel: observablehq.com/d/0a51240cfc...
Not that useful, but I thought it looked cool!
Not that useful, but I thought it looked cool!
December 22, 2025 at 6:16 PM
Out of curiosity, I made a notebook that turns an image into a csv grid and visualises it with gridviz, allowing you to manipulate each pixel: observablehq.com/d/0a51240cfc...
Not that useful, but I thought it looked cool!
Not that useful, but I thought it looked cool!
Reposted by Joe Davies

NEW: Deforestation in Indonesia is underway at a rapid pace, with the help of the military, to make way for rice and sugarcane.
Huge thanks to @mightyearth.org for their help with the data.
Read Anantha Lakshmi's excellent report
www.ft.com/content/27a6...
#dataviz #gistribe
Huge thanks to @mightyearth.org for their help with the data.
Read Anantha Lakshmi's excellent report
www.ft.com/content/27a6...
#dataviz #gistribe
December 21, 2025 at 12:15 PM
NEW: Deforestation in Indonesia is underway at a rapid pace, with the help of the military, to make way for rice and sugarcane.
Huge thanks to @mightyearth.org for their help with the data.
Read Anantha Lakshmi's excellent report
www.ft.com/content/27a6...
#dataviz #gistribe
Huge thanks to @mightyearth.org for their help with the data.
Read Anantha Lakshmi's excellent report
www.ft.com/content/27a6...
#dataviz #gistribe
Difficult one today!
Statle (19/12/2025) 5/6 (100%)
🔥 Current Win Streak: 11
🟩🟩🟩🟩🟩↖️
🟩🟩🟩🟩⬜➡️
🟩🟩🟩🟩⬜⬅️
🟩🟩🟩🟩⬜↘️
🟩🟩🟩🟩🟩🎉
joewdavies.github.io/statle
Statle (19/12/2025) 5/6 (100%)
🔥 Current Win Streak: 11
🟩🟩🟩🟩🟩↖️
🟩🟩🟩🟩⬜➡️
🟩🟩🟩🟩⬜⬅️
🟩🟩🟩🟩⬜↘️
🟩🟩🟩🟩🟩🎉
joewdavies.github.io/statle
Statle — Guess the country!
One country per day. Guess in up to 6 tries.
joewdavies.github.io
December 19, 2025 at 8:50 AM
Difficult one today!
Statle (19/12/2025) 5/6 (100%)
🔥 Current Win Streak: 11
🟩🟩🟩🟩🟩↖️
🟩🟩🟩🟩⬜➡️
🟩🟩🟩🟩⬜⬅️
🟩🟩🟩🟩⬜↘️
🟩🟩🟩🟩🟩🎉
joewdavies.github.io/statle
Statle (19/12/2025) 5/6 (100%)
🔥 Current Win Streak: 11
🟩🟩🟩🟩🟩↖️
🟩🟩🟩🟩⬜➡️
🟩🟩🟩🟩⬜⬅️
🟩🟩🟩🟩⬜↘️
🟩🟩🟩🟩🟩🎉
joewdavies.github.io/statle